Edge computing power consumption climbs fast under AI workloads
Publication Date
author
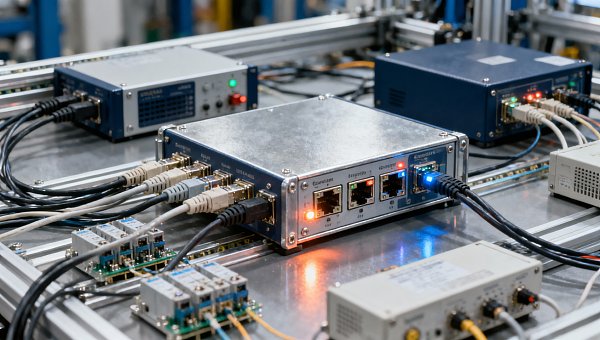
As edge computing power consumption rises sharply under AI workloads, engineers and buyers need clearer benchmarks—not hype. From edge ai inference speed fps and industrial iot gateway latency to iot gateway throughput benchmark, solid state lidar point cloud density, and machine vision sub-pixel accuracy, reliable data now determines deployment cost, thermal design, and sourcing decisions across modern industrial systems.
For R&D teams, operators, procurement managers, and business leaders, the issue is no longer whether edge AI will be deployed. The real question is how to deploy it without underestimating power draw, overbuilding cooling, or buying hardware that cannot sustain performance after 6 to 12 months of real-world use.
In manufacturing, logistics, UAV operations, machine vision inspection, and industrial sensing, AI workloads are shifting from light rule-based processing to dense inference pipelines. That shift changes the energy profile of edge systems. A gateway that once handled telemetry at 8W to 15W may now operate at 25W to 60W, while a compact vision node can move from under 20W to more than 75W depending on model size, frame rate, and ambient temperature.
This is where TechStat Vanguard’s data-first perspective matters. In hard-tech procurement, labels such as “high performance” or “low power” are not enough. Teams need measurable thresholds: sustained watts under load, thermal derating points, edge ai inference speed fps at specific precision modes, and gateway latency under packet congestion. Those parameters directly affect enclosure design, battery sizing, maintenance intervals, and total cost of ownership.
Why AI workloads are pushing edge power consumption upward
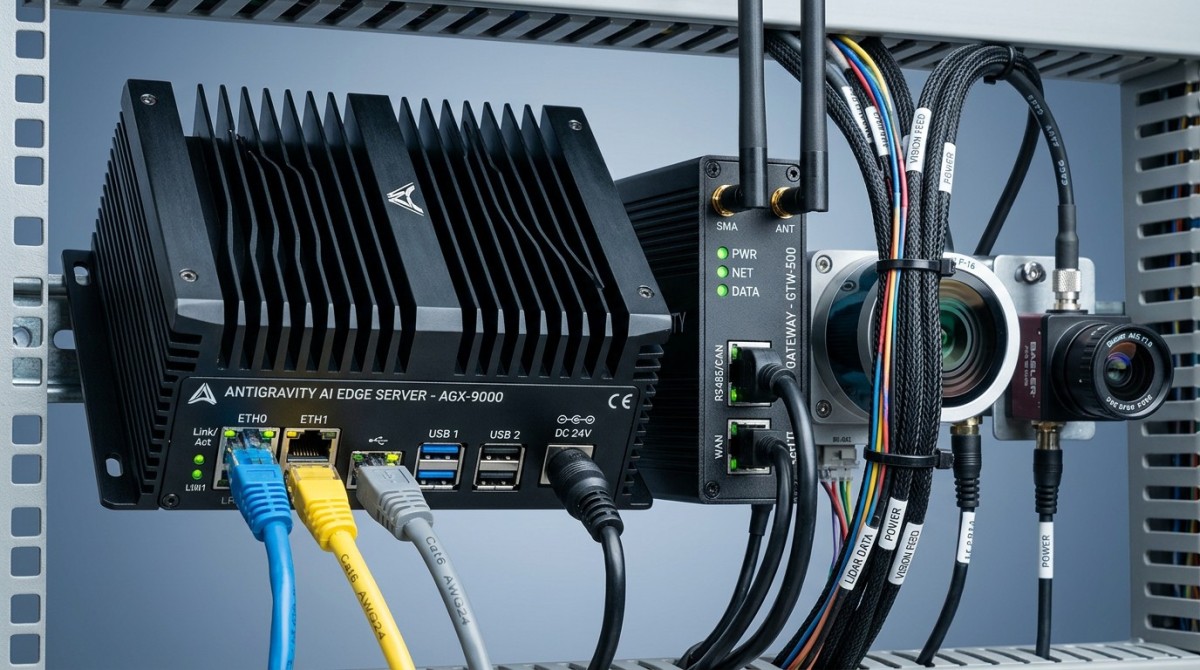
The main driver is simple: modern edge workloads are doing more computation per second than earlier industrial controllers were designed to handle. Traditional edge nodes processed sensor polling, PLC communication, and basic filtering. AI-enabled nodes now run object detection, defect classification, anomaly scoring, signal fusion, and local decision loops at the same time.
A second driver is concurrency. In many deployments, one edge device is expected to process 2 to 6 camera feeds, ingest LiDAR data, log to a historian, encrypt traffic, and maintain sub-20 ms response windows. Even if each task seems moderate alone, the combined workload raises CPU, GPU, memory, and storage activity together, increasing peak and sustained power draw.
Model complexity also matters. Lightweight inference models can operate at 5 to 20 fps on modest hardware, but many users now expect 30 fps or higher for machine vision and mobile robotics. Moving from INT8-optimized models to FP16 or mixed precision can improve accuracy in some scenarios, yet it often raises energy consumption and thermal output. The trade-off is no longer theoretical; it affects cabinet layout and field reliability.
Environmental conditions amplify the problem. An edge node that performs well at 22°C in a lab may throttle at 40°C on a factory line or inside a sealed roadside cabinet. Once throttling begins, users may see reduced edge ai inference speed fps, delayed industrial iot gateway latency, or intermittent sensor buffering. This creates a false impression that networking or software is at fault when the actual issue is thermal power saturation.
Four technical causes behind higher watts at the edge
- Higher model density: larger parameter counts and multi-stage pipelines increase compute cycles per inference.
- Faster I/O demand: camera streams, LiDAR packets, and industrial bus traffic force memory and storage subsystems to stay active longer.
- Always-on local decision making: many systems now avoid cloud round trips, so the edge box carries the full processing burden 24/7.
- Thermal overhead: cooling fans, heat spreaders, and power conditioning add secondary energy consumption beyond the processor itself.
For buyers, the practical lesson is clear: quoted TDP figures are only one reference point. Real deployment decisions should compare idle power, 50% utilization power, sustained 30-minute load power, and derated output at elevated ambient temperatures. Without those four views, budget and enclosure planning can be badly distorted.
The metrics that matter more than marketing claims
In edge AI sourcing, the most useful benchmarks are not general-purpose performance scores. Industrial teams need application-linked measurements. For example, an object inspection station may care about edge ai inference speed fps at 1080p, while a logistics gateway may care more about industrial iot gateway latency under 5,000 to 20,000 packets per second.
The table below summarizes the most decision-relevant metrics for industrial edge deployments. These are the parameters TSV-style benchmarking should prioritize when comparing suppliers or architectures.
The key insight is that these metrics are interconnected. Higher point cloud density raises throughput demand. Higher throughput can increase latency if the processor or bus is undersized. Higher fps targets lift compute power and enclosure temperature. Evaluating only one metric in isolation often leads to poor system balance.
Procurement teams should request at least 4 benchmark conditions from suppliers: idle, nominal production load, sustained peak load for 30 minutes, and high-temperature derated mode. If benchmark sheets omit those conditions, total deployment risk remains high even if headline specs look attractive.
What operators should verify during pilot runs
A 2-week pilot is often more revealing than a polished demo. During validation, operators should log average watts, peak watts, fan activity, frame drops, and latency spikes over at least 3 production shifts. That exposes thermal creep and data congestion patterns that rarely appear in short lab tests.
Minimum pilot checklist
- Record power draw in 5-minute intervals for 72 hours.
- Test at both standard ambient and elevated ambient, such as 35°C to 45°C where practical.
- Measure fps, packet loss, and latency under full sensor load rather than single-stream load.
- Track whether the device throttles after 20 to 40 minutes of continuous inference.
How rising power consumption changes thermal design, uptime, and TCO
Power consumption is not just an electrical issue. Every additional 10W to 20W at the edge can reshape thermal management, cabinet spacing, and maintenance strategy. In compact industrial cabinets, the difference between a 30W node and a 70W node may determine whether passive cooling is sufficient or forced airflow becomes mandatory.
That shift affects uptime. Fan-based systems can improve cooling, but they introduce moving parts, dust loading, and service intervals. In dirty environments such as machining cells or outdoor infrastructure, filters may require inspection every 30 to 90 days. If maintenance is missed, effective heat dissipation drops, and inference performance or gateway stability can degrade.
Battery-backed and mobile systems feel the impact even more directly. A UAV support edge unit, mobile robot compute box, or remote solar-powered gateway may have strict energy limits. Increasing average power from 18W to 42W can cut run time by more than half if battery capacity stays fixed. For field operations, that changes mission planning and charging logistics.
Total cost of ownership rises through several channels at once: larger power supplies, stronger heat sinks, more frequent service, bigger battery packs, and potentially higher failure rates if components operate closer to thermal limits. The cheapest compute module at purchase can become the most expensive option over a 24- to 36-month lifecycle.
Power-related design trade-offs
The following comparison helps teams evaluate how power growth affects architecture choices across common edge deployments.
The table shows why power should be treated as a system variable, not a chip variable. In industrial settings, watts influence cooling design, maintenance rhythm, and field service cost just as much as they affect electrical load.
A practical 5-step implementation flow
- Define the real workload: number of streams, target fps, sensor types, and latency ceiling.
- Measure expected ambient conditions, including worst-case temperatures and dust exposure.
- Select compute hardware with 20% to 30% power and thermal headroom.
- Run sustained load tests for at least 30 minutes, ideally across 3 operating cycles.
- Validate serviceability, including filter access, fan replacement time, and remote monitoring support.
How engineers and procurement teams should compare edge platforms
Effective sourcing starts by linking technical metrics to business impact. Engineers may focus on compute utilization, memory bandwidth, and model compatibility. Procurement teams often prioritize price, lead time, warranty, and supplier responsiveness. A strong decision process combines both views into a single comparison framework.
For example, a cheaper device may appear attractive on unit price, but if it needs a larger enclosure, a 120W power supply instead of a 60W one, and quarterly cleaning, the operating cost gap can close quickly. By contrast, a slightly higher-priced unit with stable throughput, lower thermal sensitivity, and easier maintenance may deliver better 2-year value.
Suppliers should also be judged on how precisely they present performance data. A serious industrial vendor should be able to specify supported protocols, sustained IoT gateway throughput benchmark conditions, input voltage tolerance, operating temperature range, and expected behavior under packet bursts or continuous AI inference.
The procurement matrix below is useful when teams need to compare multiple edge computing options across technical and commercial dimensions without relying on vague sales language.
This comparison method reduces qualification noise. Instead of asking who has the “most advanced” edge AI box, teams ask which platform can maintain required machine vision sub-pixel accuracy, gateway latency, and power stability in a realistic operating envelope.
Common sourcing mistakes
- Buying to peak benchmark instead of sustained benchmark.
- Ignoring cooling and power supply costs during BOM review.
- Comparing fps without checking image resolution, precision mode, or concurrent tasks.
- Using lab network latency instead of loaded industrial network latency.
- Overlooking sensor-side data rates, especially for solid-state LiDAR point cloud density.
FAQ: selection, deployment, and risk control for edge AI power growth
Because edge AI projects often involve cross-functional teams, the same questions appear repeatedly during planning and qualification. The answers below focus on practical thresholds and deployment logic rather than generic claims.
How should teams estimate power budget for an AI edge node?
Start with sustained load rather than nominal chip power. Add processor load, sensor interfaces, storage activity, network ports, and cooling accessories, then reserve 20% to 30% headroom. If the device will power cameras, LiDAR, or auxiliary modules, include those loads separately. For many industrial builds, measured system power is 1.3x to 1.8x higher than the compute module alone.
What edge AI inference speed fps is enough for industrial use?
It depends on motion and decision timing. Slow inspection lines may work at 10 to 20 fps, while robotic pick-and-place, mobile safety monitoring, or vehicle perception may need 25 to 60 fps or more. The target should be tied to cycle time, conveyor speed, or stopping distance, not to a generic performance label.
Why do gateway latency and throughput often worsen after deployment?
Because production traffic is more complex than pilot traffic. Once historian uploads, security logging, multi-protocol translation, and AI data streams run together, queues lengthen. That is why industrial iot gateway latency should be tested under realistic packet bursts and simultaneous workloads, not in isolated protocol demos.
How important are sensor metrics such as LiDAR density and sub-pixel accuracy when discussing power?
They are central. Higher solid-state LiDAR point cloud density increases compute, storage, and fusion demand. Higher machine vision sub-pixel accuracy usually depends on stronger optics, stable lighting, calibration, and more processing discipline. In both cases, better sensing quality often increases edge workload, which in turn raises system power and thermal complexity.
Edge computing power consumption is climbing because industrial AI is moving from simple event handling to always-on, high-density inference at the point of action. For engineering teams, that means performance must be evaluated together with watts, thermal derating, latency, throughput, and sensing quality. For procurement and executive decision-makers, it means the right benchmark framework can prevent overspend, downtime, and poor-fit sourcing.
TechStat Vanguard’s approach is straightforward: strip away generic claims and compare what actually governs deployment success—edge ai inference speed fps, industrial iot gateway latency, iot gateway throughput benchmark, solid-state LiDAR point cloud density, machine vision sub-pixel accuracy, and sustained power behavior under real load. If you are qualifying suppliers, refining a spec sheet, or planning a new edge AI rollout, now is the right time to replace assumptions with measurable engineering data.
Contact us to discuss a benchmark-driven evaluation framework, request a tailored selection checklist, or explore a deployment-specific comparison model for your industrial edge systems.
Search News
Hot Articles
- Carbon Fiber StructuresHow to Specify Aerospace Carbon Fiber Assemblies for Lightweight, Load-Bearing PartsJul 11, 2026
- Machine VisionXiaomi, Alibaba DAMO Academy Drive Open-Source Robotics Model Ecosystem, Lowering Algorithm Development Barriers for Overseas SMEs Adopting Chinese Robotics SolutionsMar 30, 2026
- Cobots & ArmsShanxi 'AI+' Conference Showcases Embodied Intelligence with Multinational Buyer Engagement: Key Industry ImplicationsMar 30, 2026
Popular Tags
Recommended News
 Jul 11, 2026How to Specify Aerospace Carbon Fiber Assemblies for Lightweight, Load-Bearing PartsAerospace carbon fiber assemblies: learn how to specify laminate design, load data, joining methods, and inspection controls for lighter, reliable load-bearing aerospace parts.Elena Rostova (UAV Systems Researcher)
 Mar 30, 2026Xiaomi, Alibaba DAMO Academy Drive Open-Source Robotics Model Ecosystem, Lowering Algorithm Development Barriers for Overseas SMEs Adopting Chinese Robotics SolutionsXiaomi & Alibaba DAMO Academy's open-source robotics models lower algorithm barriers for global SMEs. Boost efficiency in manufacturing, logistics & smart retail with ROS 2 compatible solutions.TSV Data Lab
 Mar 30, 2026Shanxi 'AI+' Conference Showcases Embodied Intelligence with Multinational Buyer Engagement: Key Industry ImplicationsShanxi 'AI+' Conference highlights embodied intelligence with Tesla, Ubtech & Jiantao showcasing multimodal robotics. 40+ global buyers validated tech on-site, creating new B2B channels for industrial automation & AI solutions.Chen Wei (Automation Lead Engineer)
 Mar 30, 2026Zhongguancun Unveils 6G Integrated Sensing-Computing-Intelligence Platform to Empower Embodied Robots for Global Industrial ApplicationsZhongguancun's new 6G platform revolutionizes industrial robotics with <10ms latency, empowering global automotive, logistics & port automation. Discover how this tech boosts China's smart manufacturing exports.TSV Data Lab
 Mar 30, 2026Mech-Mind Tianjin Embodied Intelligence R&D and Production Base Goes Live, Cutting Delivery Time by 20%–30% for Global Customized AMR+Vision SolutionsMech-Mind's Tianjin AMR+Vision production base cuts delivery time by 20%-30% for欧美 & Latin American markets. Discover how this PLd-certified facility accelerates customized robotics solutions for smart manufacturing and logistics.Chen Wei (Automation Lead Engineer)
 Mar 30, 2026Boao Forum Reveals 'Co-evolution of Big and Small Brains' Trend in Humanoid Robots, China's Embodied Intelligence Accelerates Adaptation to Overseas Manufacturing Service ScenariosDiscover how China's humanoid robots, featuring 'Co-evolution of Big and Small Brains,' are revolutionizing global manufacturing. Learn about Embodied Tian Gong 3.0's ISO compliance and overseas deployment at Boao Forum 2026.Chen Wei (Automation Lead Engineer)
 Mar 30, 2026China Railway Industrial Secures Patent for Embodied Robotics in Material Handling, Boosting High-Precision Delivery Capabilities for Overseas Infrastructure and Manufacturing ProjectsChina Railway Industrial's new patent for embodied robotics in material handling boosts high-precision delivery for global infrastructure & manufacturing. Discover how this innovation enhances logistics accuracy in automotive, rail transit & EPC projects.Chen Wei (Automation Lead Engineer)
 Oct 21, 2026China’s Industrial Robot Exports Near RMB 10 Billion in First Nine Months of 2026China’s industrial robot exports neared RMB 10 billion in January–September 2026, with value rising faster than volume. Explore the data and what it could mean for suppliers.Chen Wei (Automation Lead Engineer)
 Oct 21, 2026Low-Latency Industrial Data Processing: Pricing and Key Cost DriversExplore industrial data latency price drivers, from edge hardware to integration and support. Learn how to compare quotes, verify performance, and avoid unnecessary costs.TSV Data Lab
 Oct 20, 2026KUKA Launches iiQKA.AI Vision to Simplify Industrial Image ProcessingKUKA iiQKA.AI Vision simplifies industrial image processing with controller-based 2D and 3D vision. Explore drag-and-drop setup for vision-guided automation.TSV Data Lab
 Oct 20, 2026Smart Industrial Edge Devices: Key Criteria for Legacy PLC IntegrationChoose smart industrial edge devices for legacy PLC integration. Discover key criteria for compatibility, data quality, security, and reliable collection without disrupting control.TSV Data Lab
 Oct 19, 2026Choosing a Radar Sensor by Application: Range, Resolution, and Field of ViewSimplify radar sensor application based product selection. Compare range, resolution, and field of view to avoid blind spots and choose with confidence. Explore the guide.TSV Data Lab
 Oct 18, 2026Comparing Material Options for Procurement: Specs, Costs, and Supply RisksExplore procurement oriented technical content on material options, specs, costs, and supply risks. Compare alternatives to cut hidden expenses and make confident sourcing decisions.Dr. Marcus Vance
 Oct 17, 20265-Axis CNC Positioning Accuracy: How to Interpret ISO 230-2 Test ResultsAssess 5 axis CNC machining positioning accuracy with ISO 230-2. Learn to interpret repeatability, reversal error, and test conditions to compare suppliers and make confident acceptance decisions.Dr. Marcus Vance
 Oct 16, 2026Choosing a Rugged Edge AI Box Supplier: Thermal Tests and Lifecycle SupportChoose a rugged edge AI box supplier with proven thermal performance and reliable lifecycle support. Discover the tests and commitments to verify before you buy.TSV Data Lab
 Oct 15, 2026R&D Cost Reduction Services: How to Evaluate Fees, Savings, and ROIEvaluate R&D cost reduction services with confidence. Compare fees, verify savings, and calculate ROI without compromising performance. Discover how to choose a provider that delivers real value.Chen Wei (Automation Lead Engineer)
 Oct 21, 2026How Should You Balance Cobot Payload Against Reach?Explore cobot payload versus reach to choose the right robot. Learn how tooling, load limits, workspace, and cycle time affect performance—and avoid costly selection mistakes.Chen Wei (Automation Lead Engineer)
 Oct 20, 2026How Do You Measure Industrial IoT Gateway Latency Under Load?Measure industrial IoT gateway latency under load with reliable timestamps, realistic traffic, and tail-latency analysis. Discover how to expose bottlenecks and choose the right gateway.TSV Data Lab
 Oct 19, 2026How Do You Verify That Precision Machined Parts Meet Tolerances?Master precision machining tolerance verification with the right tools, datum setups, and acceptance rules. Learn how to validate parts confidently and reduce costly inspection errors.Dr. Marcus Vance
 Oct 18, 2026What Should an AS9100 Machining Supplier Checklist Include?Build an AS9100 machining supplier checklist that verifies capability, traceability, inspection, and outsourced processes. Discover what to check before approving your next aerospace supplier.Dr. Marcus Vance
 Oct 17, 2026How Should You Interpret Industrial Robot Repeatability Specs?Decode industrial robot repeatability specifications, understand ISO 9283 test conditions, and avoid costly selection mistakes. Learn how to verify performance for your process.Chen Wei (Automation Lead Engineer)
 Oct 16, 2026How Can You Fairly Compare MTBF Across Industrial Servo Motors?Make a fair industrial servo motor MTBF comparison with matched operating profiles, failure criteria, and confidence bounds. Discover how to assess reliability beyond advertised numbers.Chen Wei (Automation Lead Engineer)
 Oct 15, 2026How Should You Compare TechStat Vanguard 5-Axis CNC Tolerances?TechStat Vanguard 5-axis CNC tolerance comparison: learn how to verify part accuracy, assess inspection evidence, and choose suppliers that reliably meet your drawing requirements.Dr. Marcus Vance
 Oct 14, 2026Drone Frame Composites: Carbon Fiber vs. Fiberglass for Weight and StiffnessExplore drone structural materials composites: compare carbon fiber and fiberglass for weight, stiffness, cost, and antenna compatibility. Find the right material for your drone frame.Elena Rostova (UAV Systems Researcher)