5-Axis CNC Positioning Accuracy: How to Interpret ISO 230-2 Test Results
Publication Date
author
A supplier’s headline accuracy figure rarely tells you enough to qualify a five-axis machine. Assessing 5 axis CNC machining positioning accuracy requires reading ISO 230-2 results beyond a single tolerance: distinguishing positioning accuracy from repeatability, examining reversal error, and checking test conditions for each linear and rotary axis. The bigger question is whether those individual-axis measurements support the machining task you actually intend to run.
A machine can produce an excellent positioning report and still miss a feature when the table tilts, the spindle warms up, or several axes move together. That does not make the report useless. It means the report answers a narrower question than the sales quotation may suggest.
What ISO 230-2 establishes—and what it does not
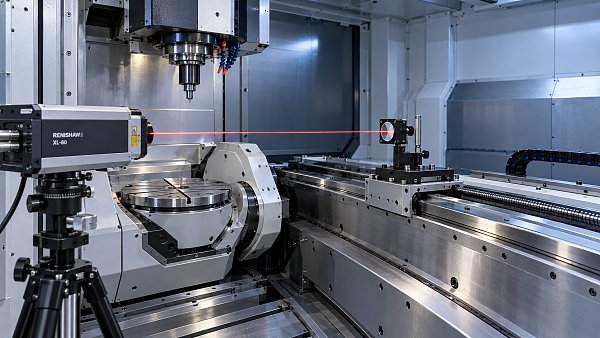
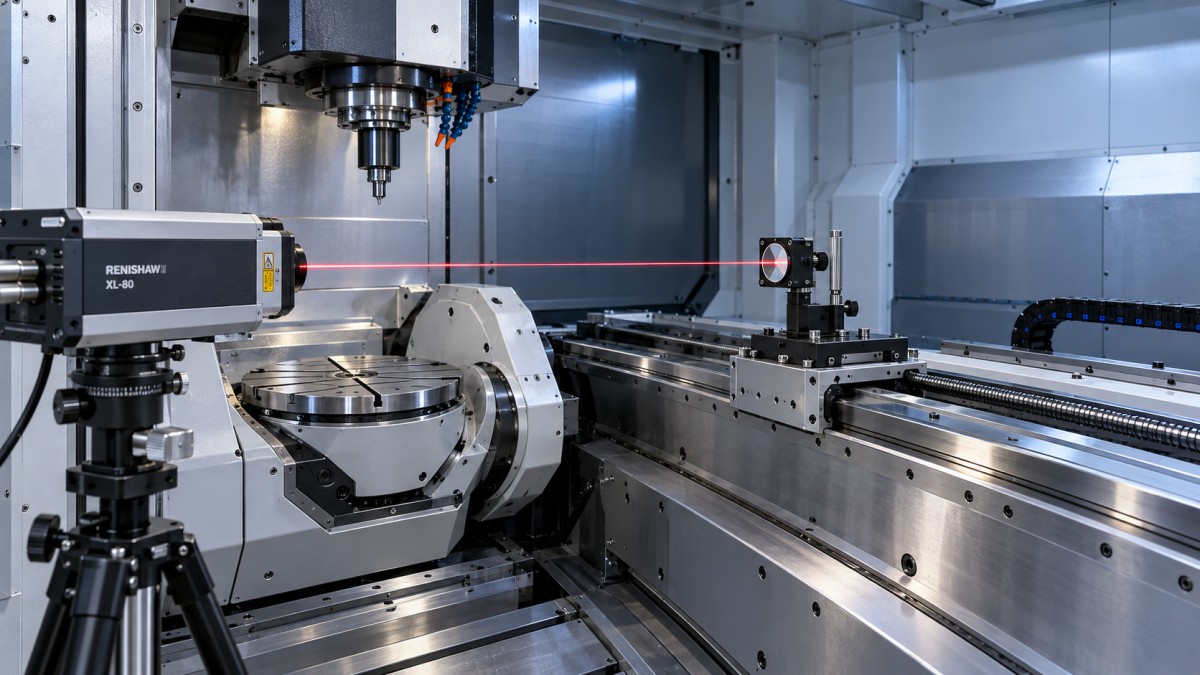
ISO 230-2 addresses the accuracy and repeatability of positioning of numerically controlled axes. Its methods apply to linear and rotary axes, evaluated individually. The test compares commanded target positions with measured positions through repeated approaches, allowing systematic positioning deviations, scatter, and direction-dependent behavior to be assessed.
This is not a complete five-axis machine acceptance test. It does not, by itself, establish volumetric accuracy throughout the working envelope, rotary-axis alignment, tool-center-point accuracy during simultaneous motion, or accuracy under cutting forces. A stationary positioning measurement is also not a direct measure of servo following error at production feed rates.
Treat “ISO 230-2 certified” cautiously. A report claiming conformity to a test method is not automatically independent certification, and the standard does not assign one universal pass/fail tolerance to every machine. Acceptance limits must come from the purchase specification or another explicitly agreed requirement. Record the standard’s edition and any deviations from its procedure.
Read the metric before comparing the number
“Accuracy: 5 µm” is incomplete. Is that a bidirectional positioning accuracy value, a unidirectional result, a repeatability figure, or an informal maximum deviation? Does it cover the full tested travel? Is it an overall range or a plus/minus statement? These distinctions can change a purchasing decision.
The standard uses specific statistical definitions; its repeatability values are not simply the observed maximum minus minimum of a few readings. If you need to audit the calculations, obtain the underlying observations and use the definitions in the cited edition rather than reconstructing the result from a screenshot.
Good repeatability can coexist with poor positioning accuracy
Imagine repeated approaches clustering tightly but consistently stopping away from the commanded target. The axis is repeatable, yet its absolute positioning is biased. A stable systematic error may be amenable to compensation, whereas variable scatter is generally harder to correct with a fixed compensation table.
Do not turn that distinction into a promise that calibration will solve everything. Temperature-dependent behavior, changing loads, and unstable mechanics can undermine a correction derived in one condition. For acceptance, the relevant result is the machine’s documented performance in its agreed delivery configuration.
The error plot often matters more than the summary
Ask for plots showing both approach directions, mean deviations, and repeatability information at the target positions. Separate directional curves make problems visible that a single summary cell can conceal.
A broadly sloping deviation curve can prompt investigation of scale-related effects or thermal conditions. A localized disturbance deserves attention if it falls within the travel used for a critical feature. Separation between forward and reverse means points to direction-dependent behavior. These are diagnostic clues, not definitive fault identifications: the graph alone cannot tell you which component needs replacement.
Reversal error is particularly relevant when machining repeatedly crosses a direction change. However, an ISO 230-2 result remains a positioning test; it cannot establish the size of a dynamic contouring defect at a particular feed rate. Use it to identify where further testing is justified, not to predict a finished surface directly.
Also inspect coverage. A favorable result over a short central travel does not substantiate the same performance near the ends of the axis. Conversely, a full-travel summary can hide the fact that two machines behave differently within the smaller working region your process uses. Retain the full-axis evidence and examine the application region separately.
Rotary-axis accuracy needs a distance as well as an angle
Five-axis comparisons often become misleading when linear-axis results are carefully checked but rotary positioning is reduced to “high-precision table.” Require separate results for each rotary axis, including tested angular range, approach directions, and units. Angular seconds, degrees, and linear micrometres are not interchangeable specifications.
For a small angular positioning error, the corresponding tangential displacement can be approximated by e ≈ r × θ, where θ is in radians and r is the perpendicular distance from the rotation axis to the point being considered.
As a calculated illustration—not a machine benchmark—an angular error of 10 arcseconds is approximately 48.5 microradians. At a 200 mm radius, that corresponds to about 9.7 µm of tangential displacement. The same angular error at a shorter radius produces a smaller displacement.
This explains why a rotary specification cannot be judged independently of the fixture, workpiece position, and machine architecture. It does not provide a complete tool-center-point error prediction. Rotary-axis location and orientation errors, linear-axis geometry, and kinematic compensation also contribute. Adding the five axis-accuracy figures together is not a defensible volumetric error model.
Conditions that can invalidate a supplier comparison
Two reports carrying the same standard reference are not necessarily comparable. Before ranking their headline values, establish the measurement conditions and configuration:
- Thermal state: ambient conditions, machine warm-up, relevant temperatures, and whether the spindle was operating.
- Compensation state: which positioning and thermal corrections were enabled, and whether the report represents the delivered settings.
- Test coverage: travel or angular range, target positions, repeated approaches, and any exclusions.
- Machine configuration: positions of non-tested axes, fixture or payload conditions, and rotary clamping state where applicable.
- Metrology: instrument identification, calibration traceability, measurement setup, environmental corrections, and uncertainty.
Measurement alignment deserves particular attention. Linear positioning results depend on where and how the measurement line is established. Offset between that line and the functional machining location can make angular error motions relevant through Abbe effects. A well-executed axis test still does not measure every error at the cutting point.
Uncertainty matters most near the acceptance boundary. If a result is close to the contractual limit, “the displayed number is below the limit” may not settle conformity. Agree how measurement uncertainty will be treated before testing. Calibration certificates support traceability; they do not, alone, establish the uncertainty of the complete machine measurement.
Bridge the gap to simultaneous five-axis machining
The follow-up evidence should match the part. For indexed machining, rotary positioning and geometric alignment are central concerns, including whether the axis is clamped during cutting. For simultaneous machining, coordinated motion, changing orientation, tool length, and feed-dependent effects become harder to ignore.
Relevant supplementary methods may include circular testing under ISO 230-4, applicable machining-centre interpolation tests under ISO 10791-6, and finished test pieces under ISO 10791-7. Check the scope and applicable procedures rather than assuming any one test proves all five-axis performance. Dedicated tool-center-point measurements can provide additional evidence when their trajectories, instrumentation, and evaluation method are clearly specified.
A representative cutting trial addresses another layer: workholding, tool deflection, material response, and thermal behavior during production. It should use agreed tools, conditions, inspection methods, and feature requirements. One successful part does not replace axis metrology, just as an excellent axis report does not guarantee a thin-walled component will remain within tolerance.
Likewise, AS9100 or ISO 13485 certification should not be read as proof of a particular machining tolerance. These are quality-management standards, not substitutes for machine capability measurements or part-specific validation.
Turn the report into an acceptance decision
A useful acceptance specification names each axis, the required metrics, test range, machine configuration, applicable standard edition, and agreed limits. It also identifies who performs the test, what data must be delivered, and what happens when a result is borderline or fails. Where installation conditions matter, distinguish factory acceptance from verification after installation.
This is the evidence-first approach behind TechStat Vanguard’s precision-machining benchmarking: compare traceable measurements and their boundaries, not adjectives. A slightly larger documented error may be more useful for qualification than a smaller number whose direction, range, and uncertainty are unknown.
Before approving the machine, request the complete axis reports and the supplementary evidence needed for your actual toolpaths. If the supplier cannot distinguish positioning accuracy, repeatability, reversal error, and simultaneous-motion performance, the headline accuracy figure is not yet an adequate basis for acceptance.
Search News
Hot Articles
- Carbon Fiber StructuresHow to Specify Aerospace Carbon Fiber Assemblies for Lightweight, Load-Bearing PartsJul 11, 2026
- Machine VisionXiaomi, Alibaba DAMO Academy Drive Open-Source Robotics Model Ecosystem, Lowering Algorithm Development Barriers for Overseas SMEs Adopting Chinese Robotics SolutionsMar 30, 2026
- Cobots & ArmsShanxi 'AI+' Conference Showcases Embodied Intelligence with Multinational Buyer Engagement: Key Industry ImplicationsMar 30, 2026
Popular Tags
Recommended News
 Jul 11, 2026How to Specify Aerospace Carbon Fiber Assemblies for Lightweight, Load-Bearing PartsAerospace carbon fiber assemblies: learn how to specify laminate design, load data, joining methods, and inspection controls for lighter, reliable load-bearing aerospace parts.Elena Rostova (UAV Systems Researcher)
 Mar 30, 2026Xiaomi, Alibaba DAMO Academy Drive Open-Source Robotics Model Ecosystem, Lowering Algorithm Development Barriers for Overseas SMEs Adopting Chinese Robotics SolutionsXiaomi & Alibaba DAMO Academy's open-source robotics models lower algorithm barriers for global SMEs. Boost efficiency in manufacturing, logistics & smart retail with ROS 2 compatible solutions.TSV Data Lab
 Mar 30, 2026Shanxi 'AI+' Conference Showcases Embodied Intelligence with Multinational Buyer Engagement: Key Industry ImplicationsShanxi 'AI+' Conference highlights embodied intelligence with Tesla, Ubtech & Jiantao showcasing multimodal robotics. 40+ global buyers validated tech on-site, creating new B2B channels for industrial automation & AI solutions.Chen Wei (Automation Lead Engineer)
 Mar 30, 2026Zhongguancun Unveils 6G Integrated Sensing-Computing-Intelligence Platform to Empower Embodied Robots for Global Industrial ApplicationsZhongguancun's new 6G platform revolutionizes industrial robotics with <10ms latency, empowering global automotive, logistics & port automation. Discover how this tech boosts China's smart manufacturing exports.TSV Data Lab
 Mar 30, 2026Mech-Mind Tianjin Embodied Intelligence R&D and Production Base Goes Live, Cutting Delivery Time by 20%–30% for Global Customized AMR+Vision SolutionsMech-Mind's Tianjin AMR+Vision production base cuts delivery time by 20%-30% for欧美 & Latin American markets. Discover how this PLd-certified facility accelerates customized robotics solutions for smart manufacturing and logistics.Chen Wei (Automation Lead Engineer)
 Mar 30, 2026Boao Forum Reveals 'Co-evolution of Big and Small Brains' Trend in Humanoid Robots, China's Embodied Intelligence Accelerates Adaptation to Overseas Manufacturing Service ScenariosDiscover how China's humanoid robots, featuring 'Co-evolution of Big and Small Brains,' are revolutionizing global manufacturing. Learn about Embodied Tian Gong 3.0's ISO compliance and overseas deployment at Boao Forum 2026.Chen Wei (Automation Lead Engineer)
 Mar 30, 2026China Railway Industrial Secures Patent for Embodied Robotics in Material Handling, Boosting High-Precision Delivery Capabilities for Overseas Infrastructure and Manufacturing ProjectsChina Railway Industrial's new patent for embodied robotics in material handling boosts high-precision delivery for global infrastructure & manufacturing. Discover how this innovation enhances logistics accuracy in automotive, rail transit & EPC projects.Chen Wei (Automation Lead Engineer)
 Oct 17, 20265-Axis CNC Positioning Accuracy: How to Interpret ISO 230-2 Test ResultsAssess 5 axis CNC machining positioning accuracy with ISO 230-2. Learn to interpret repeatability, reversal error, and test conditions to compare suppliers and make confident acceptance decisions.Dr. Marcus Vance
 Oct 16, 2026Choosing a Rugged Edge AI Box Supplier: Thermal Tests and Lifecycle SupportChoose a rugged edge AI box supplier with proven thermal performance and reliable lifecycle support. Discover the tests and commitments to verify before you buy.TSV Data Lab
 Oct 15, 2026R&D Cost Reduction Services: How to Evaluate Fees, Savings, and ROIEvaluate R&D cost reduction services with confidence. Compare fees, verify savings, and calculate ROI without compromising performance. Discover how to choose a provider that delivers real value.Chen Wei (Automation Lead Engineer)
 Oct 16, 2026How Can You Fairly Compare MTBF Across Industrial Servo Motors?Make a fair industrial servo motor MTBF comparison with matched operating profiles, failure criteria, and confidence bounds. Discover how to assess reliability beyond advertised numbers.Chen Wei (Automation Lead Engineer)
 Oct 15, 2026How Should You Compare TechStat Vanguard 5-Axis CNC Tolerances?TechStat Vanguard 5-axis CNC tolerance comparison: learn how to verify part accuracy, assess inspection evidence, and choose suppliers that reliably meet your drawing requirements.Dr. Marcus Vance
 Oct 14, 2026Drone Frame Composites: Carbon Fiber vs. Fiberglass for Weight and StiffnessExplore drone structural materials composites: compare carbon fiber and fiberglass for weight, stiffness, cost, and antenna compatibility. Find the right material for your drone frame.Elena Rostova (UAV Systems Researcher)
 Oct 13, 2026Smart Cameras vs. PC-Based Machine Vision: Which Fits High-Speed Inspection?This industrial product comparison for machine vision weighs smart cameras vs. PC-based systems on latency, throughput, and cost. Discover your best fit for high-speed inspection.TSV Data Lab
 Oct 12, 2026How to Verify RoHS Compliance in Industrial Sensing Systems Before DeploymentRoHS compliant sensing systems: learn how to verify materials, supplier declarations, testing, and configuration controls before industrial deployment.TSV Data Lab
 Oct 11, 2026How Procurement-Oriented Content Taxonomy Improves B2B Buying JourneysProcurement-oriented content taxonomy streamlines B2B buying journeys with clearer evidence, supplier comparisons, risk visibility, and faster approvals.TSV Data Lab
 Oct 10, 2026How to Select a Machine Performance Monitoring Platform for OEE and Downtime ReductionMachine performance monitoring platform selection guide: validate machine states, OEE data, downtime reasons, integrations, and scalability to reduce losses with confidence.TSV Data Lab
 Oct 08, 2026How to Machine Inconel 625 Blades Without Heat Cracks or Edge ChippingInconel 625 blade machining guide: prevent heat cracks, edge chipping, chatter, and work hardening with proven tooling, cooling, fixturing, and inspection strategies.Dr. Marcus Vance
 Oct 07, 2026How to Evaluate an HMI Panel Distributor for Industrial Automation ProjectsHMI panel distributor evaluation guide: verify technical compatibility, traceability, supply reliability, lifecycle support, and total cost for automation projects.Victor Lin (Chief Software Architect)
 Oct 06, 2026Navigation Fault Tolerance Standards for AMRs: What Safety Teams Must VerifyNavigation fault tolerance standards: learn what AMR safety teams must verify, from localization loss and sensor faults to stopping distance, safe restart, and site-specific validation.Chen Wei (Automation Lead Engineer)
 Oct 05, 2026Calculating Edge Computing Total Cost of Ownership Across Distributed SitesEdge computing ownership cost explained: calculate deployment, energy, connectivity, security, remote support, and refresh costs across distributed sites.TSV Data Lab
 Oct 04, 2026CAD/CAM Benchmarking in the GCC: What Manufacturers Should Ask a ConsultantCAD CAM benchmark consultant GCC guide: learn the key questions manufacturers should ask to validate post-processors, workflows, machine performance, and production risk.Victor Lin (Chief Software Architect)
 Oct 03, 2026Selecting Automotive Radar Sensor Modules for ADAS Range, Resolution, and IntegrationAutomotive radar sensor module selection guide for ADAS: compare range, resolution, field of view, latency, and integration to build safer, reliable vehicle systems.TSV Data Lab
 Oct 02, 2026How to Qualify Machined Parts Suppliers for Hard Tech ProgramsHard tech supply chain machined parts demand rigorous supplier qualification. Learn how to assess capability, traceability, quality controls, and delivery resilience.Dr. Marcus Vance