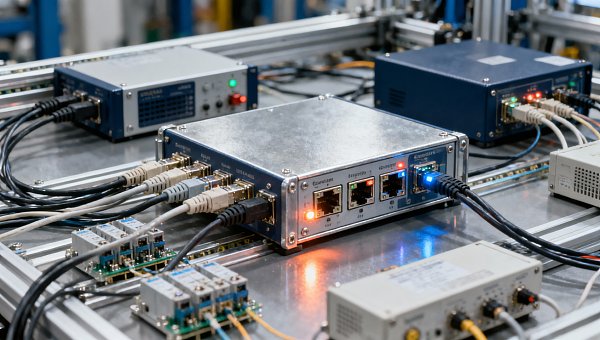
A gateway that performs well at idle can become a bottleneck when sensor traffic spikes, protocol conversion intensifies, and edge workloads compete for CPU time.
Measuring industrial IoT gateway latency under load requires more than an average response time: engineers need defined measurement boundaries, reliable timestamps, and realistic traffic profiles.
Tail-latency data must accompany packet loss and throughput measurements. Otherwise, apparently fast results can conceal dropped messages, growing queues, or delays that violate application deadlines.
This guide explains how to build reproducible tests, separate gateway delays from network effects, and compare supplier claims against representative operating conditions and application-specific deadlines.
What Exactly Should Your Latency Measurement Include?
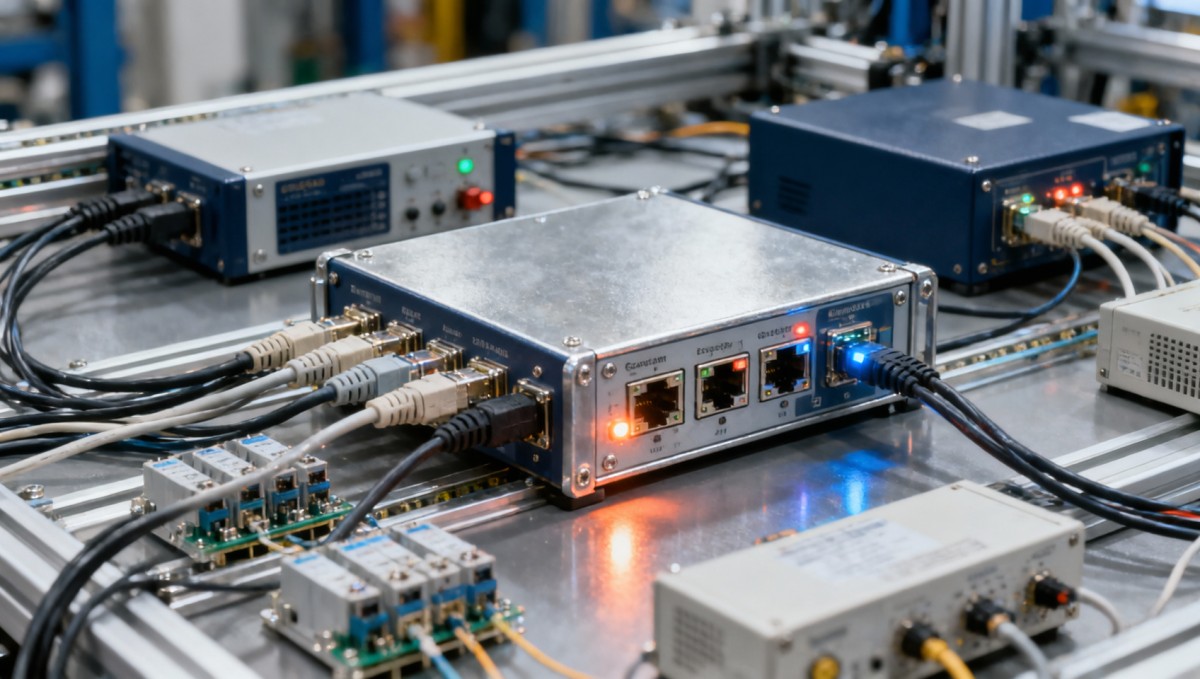
Start by defining the event that begins measurement and the event that ends it. Without explicit boundaries, latency figures from different gateways cannot support comparisons.
For gateway forwarding latency, measure from ingress reception to corresponding egress transmission. This boundary includes internal processing and buffering but excludes downstream delivery and application handling.
For application delivery latency, measure from a defined source event to receipt by the destination application. This includes the gateway and relevant network segments.
For control applications, command completion may matter more than message arrival. Specify whether completion means acknowledgement, controller acceptance, actuator movement, or independently observed physical response.
Protocol conversion requires particular care: one Modbus transaction can produce several MQTT messages, while batching may combine multiple readings into a single published payload.
Assign correlation identifiers to individual measurements wherever possible. For aggregated payloads, preserve source identifiers and acquisition timestamps so each observation remains traceable through the pipeline.
Document timestamp locations precisely, including whether they represent wire transmission, kernel reception, application entry, or completed processing. These events can differ substantially during heavy load.
How Can You Trust the Timestamps?
One-way latency requires comparable timestamps at both endpoints. Unsynchronized clocks can create apparent delays, hide real delays, or even produce physically impossible negative measurements.
For measurements within one host, use a monotonic clock. It avoids wall-clock adjustments, although clock resolution alone does not establish the accuracy of timestamp placement.
Across hosts, hardware-assisted IEEE 1588 PTP can provide suitable synchronization when supported throughout the measurement setup. Verify actual clock offset and stability during each test.
NTP may be adequate when deadlines are loose, but its suitability depends on measured synchronization error. Do not assume it supports microsecond-scale latency claims.
Estimate timing uncertainty from synchronization error, timestamp placement, and capture overhead. If uncertainty approaches the difference between candidates, the comparison cannot reliably distinguish their performance.
Hardware packet timestamps can reduce software scheduling noise, but confirm which packet event they represent. Application timestamps remain necessary when application processing belongs within scope.
If synchronized endpoints are unavailable, measure round-trip time with an explicit response mechanism. Do not halve it unless path symmetry and response overhead are justified.
What Test Setup Separates Gateway Delays From Network Effects?
Build a controlled path with a source emulator, the gateway under test, and a receiving application or broker. Instrument both gateway-facing links where practical.
Use packet captures to compare ingress and egress timing, and application logs to verify delivery. Passive capture reduces dependence on the gateway’s own diagnostic reporting.
Check whether capture interfaces drop packets under load. A monitor that misses traffic can distort correlation, loss estimates, and conclusions about where delays originate.
Run a baseline through the test network before introducing gateway processing. This identifies switch, link, receiver, and generator limitations that could contaminate subsequent results.
Keep network effects controlled during gateway comparisons. Test impairment scenarios separately, including constrained bandwidth, broker delays, wireless interference, or WAN variability when deployment requires them.
Record the gateway model, processor, memory, firmware, operating system, enabled services, interface settings, and power conditions. Preserve configuration exports alongside the raw measurement files.
For encrypted traffic, correlate messages using endpoint instrumentation or authorized decrypted captures. Connection-level packet timing alone may not reveal the latency of individual application messages.
Which Loads Reflect Your Actual Deployment?
Define workload using connected devices, message frequency, payload size, protocol mix, connection count, and conversion rules. A single messages-per-second figure rarely describes processing demand adequately.
Include representative payloads and security settings. Small unencrypted messages can produce favorable benchmark numbers while overlooking parsing, certificate operations, and larger production telemetry records.
For polling protocols, reproduce register counts, polling intervals, device response times, timeouts, and retries. Slow field devices can affect scheduling and the freshness of measurements.
Enable the edge workloads expected in service, such as filtering, aggregation, local storage, and inference. Their CPU, memory, and storage demands can compete with forwarding.
Use at least three traffic conditions: sustained expected load, representative bursts, and controlled overload. Increase demand gradually to expose the point where behavior changes.
Burst tests should specify peak rate, duration, and recurrence. A gateway may absorb one brief spike yet accumulate backlog when similar spikes arrive repeatedly.
Model fleet behavior where devices publish simultaneously after reconnecting or following a shared timer. These synchronized events often stress gateways more than evenly distributed traffic.
Maintain a fixed-rate offered workload when evaluating overload. A generator that waits for each response can unintentionally reduce demand precisely when the gateway slows down.
How Should You Run a Reproducible Load Test?
First, establish application deadlines and acceptable loss before collecting results. This prevents a favorable average from becoming the acceptance criterion after testing has finished.
Next, validate the measurement system at low load. Confirm correlation, timestamp behavior, generator capacity, receiver capacity, and consistency between counters at each observation point.
Warm the gateway into its intended operating state before measurement. Record startup behavior separately if boot time, initial connections, or cache population matters operationally.
Run each workload long enough to observe relevant cycles, including storage flushing, telemetry reporting, certificate renewal where applicable, and temperature stabilization under sustained processing demand.
At every load level, record offered traffic, accepted traffic, completed deliveries, queue growth, resource utilization, and latency distributions. Keep sampling intervals consistent across candidates.
After overload, reduce traffic and measure recovery. Determine whether queues drain, data remains stale, connections recover, and delivery deadlines return to their acceptable range.
Repeat important scenarios independently and report variation between runs. Retain the same configuration, traffic schedule, environmental conditions, and instrumentation unless a deliberate variable changes.
Publish the workload definition and measurement duration with every result. A percentile without its sample count or test conditions provides little evidence for supplier qualification.
Which Results Matter More Than Average Latency?
Report median, p95, p99, and observed maximum latency, together with sample counts. Select additional percentiles only when sufficient observations support a meaningful interpretation of them.
The median describes typical behavior; upper percentiles describe slower deliveries. The observed maximum documents the test window, but it does not establish a guaranteed bound.
A p99 value is an empirical threshold at approximately which 99 percent of measured deliveries fall at or below. It says nothing about missing deliveries.
Calculate delivery loss and deadline misses separately. Define deadline compliance against all expected messages, so dropped traffic cannot disappear from the denominator and improve results.
Track offered rate and delivered throughput together. If delivered throughput plateaus while offered traffic rises, queues, backpressure, rejection, or loss must explain the difference.
Measure queue depth where available and data age at consumption. A gateway can forward buffered messages quickly while delivering information that is already operationally stale.
Guard against coordinated omission: response-paced generators under-sample periods of severe slowdown. Schedule arrivals independently, and include source scheduling delays within the appropriate application measurement boundary.
Use sufficient observations for tail analysis. With 100,000 deliveries, only about 100 observations occupy the upper 0.1 percent, leaving extreme-tail estimates sensitive to variation.
How Do You Find the Cause of Latency Spikes?
Plot latency against offered load, delivered throughput, queue depth, and resource metrics on a shared timeline. Correlated changes help identify likely causes without proving them automatically.
CPU saturation accompanied by rising queues suggests processing pressure. Inspect per-core utilization, scheduling delays, and conversion costs because aggregate CPU figures can conceal one overloaded thread.
Memory pressure may trigger reclaim activity, allocation delays, or swapping where enabled. Record these events rather than attributing every delay to insufficient processor performance alone.
Storage-related spikes often coincide with persistence, log rotation, or database writes. Compare timing with disk activity, then isolate the suspected service in a controlled follow-up.
Network congestion can cause retransmissions, transport backpressure, and delayed acknowledgements. Inspect interface counters and captures before concluding that an internal gateway queue caused the delay.
Watch temperature and operating frequency during extended runs. Thermal throttling can reduce sustained capacity even when short laboratory tests suggest ample performance headroom remains.
Change one suspected factor at a time, then repeat the affected scenario. This turns correlation into stronger evidence and helps identify practical configuration improvements.
How Should Engineering and Procurement Teams Set Acceptance Criteria?
Translate application needs into explicit limits for delivery deadlines, acceptable loss, sustained throughput, burst tolerance, and recovery time. Different industrial workflows require different thresholds.
A condition-monitoring pipeline may tolerate delay that an interlock cannot. Evaluate latency alongside freshness, reliability, and system architecture rather than applying one universal gateway target.
Ordinary gateway benchmarks cannot establish safety integrity or guaranteed deterministic control. Applications requiring those properties need the appropriate architecture, assurance evidence, and separately defined validation.
Compare candidates under identical workloads and settings, then inspect performance near expected peaks. Capacity headroom should reflect forecast growth, uncertainty, and the consequence of overload.
Request raw distributions, loss counters, firmware details, workload scripts, and timestamp methodology from suppliers. Treat an unsupported average latency claim as insufficient evidence for qualification.
Document acceptance as a measurable statement: specified traffic, defined measurement boundary, deadline compliance, maximum loss, and required recovery. Attach environmental and configuration conditions to it.
For example, require at least 99.9 percent of expected messages to arrive within the application deadline during a defined burst, with a specified recovery limit.
Keep that example application-specific rather than treating it as an industry standard. Procurement decisions become defensible when every requirement maps to an operational need.
What Makes a Gateway Latency Result Decision-Ready?
A useful industrial IoT gateway latency benchmark combines clear measurement boundaries, trustworthy timing, representative demand, and complete accounting of deliveries, losses, and deadline misses.
The decisive question is whether the gateway sustains your required service during expected peaks and recovers predictably afterward. Average response time alone cannot answer it.
For engineering teams, this evidence identifies bottlenecks and validates deployment assumptions. For procurement teams, it turns supplier comparisons into repeatable qualification decisions with explicit conditions.
Apply TSV’s principle, Engineering Truth Through Data, by requiring reproducible measurements behind every performance claim. Select gateways whose demonstrated operating envelope matches your application’s actual demands.