Custom AMR AGV Supplier or Standard Model First?
Publication Date
author
Choosing between a standard AMR/AGV platform and a custom AMR AGV supplier is not just a sourcing question—it is a risk, scalability, and lifecycle cost decision. For enterprise leaders managing automation roadmaps, the right path depends on throughput targets, integration complexity, compliance demands, and long-term ROI. This guide cuts through vendor claims to help decision-makers evaluate both options with engineering clarity.
In most factories, warehouses, and mixed industrial campuses, the wrong mobile automation choice does not fail on day 1. It fails in months 6 to 18, when fleet utilization rises above 70%, traffic conflicts increase, ERP or MES integration exposes data gaps, or maintenance teams discover that spare parts and software support were underestimated. That is why evaluating a standard platform versus a custom AMR AGV supplier requires more than comparing unit price.
For CTOs, operations heads, and procurement directors, the practical question is simple: should you deploy a proven standard model in 8 to 12 weeks, or invest 4 to 9 months in a tailored system that better fits payload, navigation, interface, and compliance requirements? The answer depends on engineering constraints, not brochure language.
Why the Standard vs. Custom Decision Matters at Enterprise Scale
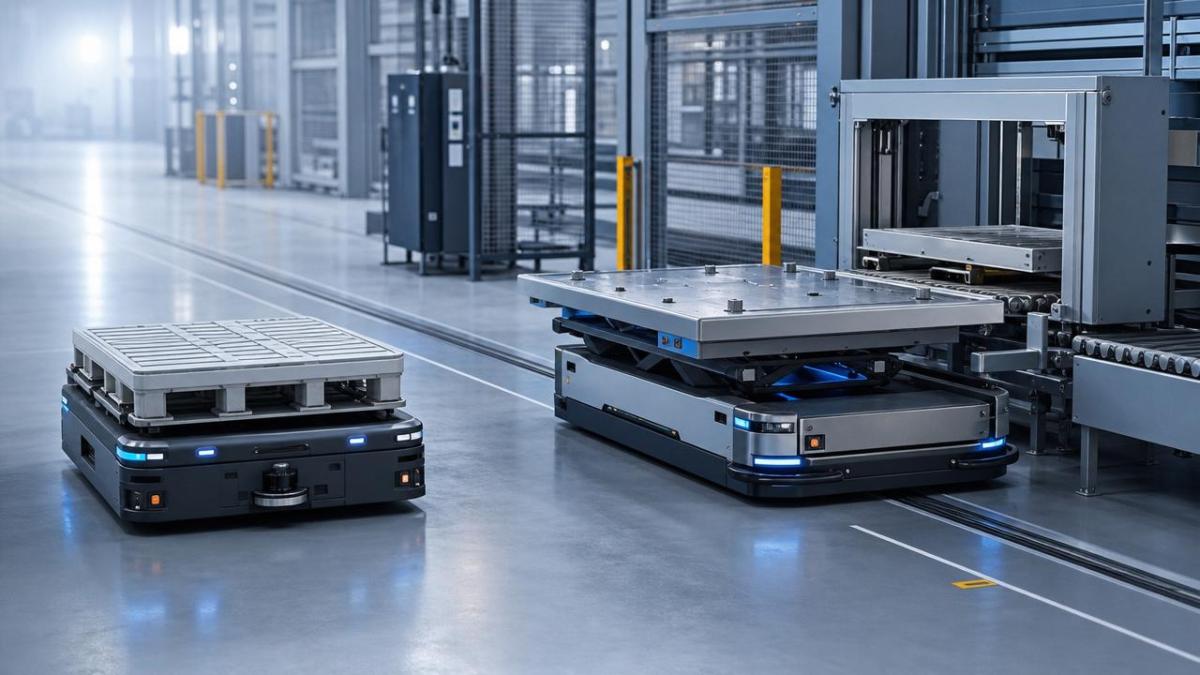
A standard AMR or AGV model is typically built around validated modules: fixed payload classes such as 300 kg, 600 kg, or 1,500 kg; common navigation stacks like SLAM, reflector guidance, or QR pathing; and pre-tested charging, safety, and fleet management software. For facilities with stable routes and repeatable workflows, this can reduce deployment risk and accelerate time to value.
A custom AMR AGV supplier, by contrast, is usually selected when the operating environment breaks those assumptions. Examples include non-standard load dimensions, aisle widths below 1.8 meters, docking tolerances tighter than ±5 mm, floor gradients above 3%, mixed indoor-outdoor transitions, or integration with specialized conveyors, machine tools, cleanroom systems, or aerospace-grade traceability workflows.
Where standard platforms usually win
- Fast deployment cycles, often 8–12 weeks for pilot sites
- Lower upfront engineering cost by 15%–35% compared with fully customized builds
- Proven spare parts structure and existing service documentation
- Simpler operator training, often completed within 1–3 days
Where a custom AMR AGV supplier becomes necessary
- Payload or attachment requirements exceed catalog options
- Interface logic must connect with MES, WMS, SCADA, PLC, or custom API layers
- Safety zoning, traffic logic, or validation documents must fit regulated operations
- Lifecycle optimization depends on site-specific uptime targets above 98%
The cost difference is often misunderstood. A standard model may look 20% cheaper at purchase order stage, but if it requires manual load transfer, extra buffering, or software workarounds, total process cost can rise over a 3-year horizon. Likewise, a custom solution may appear expensive upfront, yet reduce labor touches from 4 steps to 2, shorten takt time by 10% to 18%, and improve traceability quality in high-value manufacturing.
Comparison framework for decision-makers
The table below provides a practical first-pass filter for enterprise teams assessing whether a standard vehicle family is sufficient or whether engagement with a custom AMR AGV supplier should start immediately.
The key conclusion is that standard models are strongest when process variation is low and scaling speed matters most. A custom AMR AGV supplier is justified when physical constraints, digital integration, or compliance risk make workaround costs more expensive than engineering the right system from the start.
How to Evaluate a Custom AMR AGV Supplier Beyond Sales Claims
When a project moves into custom territory, supplier evaluation must shift from marketing language to measurable delivery capability. Enterprise buyers should assess at least 6 dimensions: navigation performance, docking repeatability, software interface maturity, safety architecture, service response, and change-control discipline. A capable custom AMR AGV supplier should be able to discuss each of these without ambiguity.
1. Navigation and localization under real operating conditions
Ask how performance changes when aisle traffic rises, lighting fluctuates, or floor reflectivity creates sensor noise. In practical terms, decision-makers should request operating ranges for localization drift, obstacle response latency, and throughput impact during peak traffic. Even a 1.5-second delay per traffic conflict can materially reduce line supply performance over 200 to 400 missions per day.
Key technical checkpoints
- Docking accuracy target, such as ±5 mm or ±10 mm depending on interface
- Minimum aisle width and turning radius under full payload
- Performance on floor joints, ramps, and mixed surface conditions
- Recovery behavior after temporary sensor obstruction or map deviation
2. Integration depth and data transparency
In many projects, vehicle hardware is not the real bottleneck. Integration is. A custom AMR AGV supplier should define whether interfaces are available through REST API, OPC UA, MQTT, fieldbus gateways, or proprietary middleware. More importantly, they should specify event granularity: can your team capture mission start, load confirmation, docking complete, battery threshold, fault code, and operator intervention as discrete data points?
For enterprise deployment, 3 layers should be mapped early: command layer, execution layer, and analytics layer. If these are not aligned during pre-sales, hidden rework often emerges in weeks 10 to 16 of implementation.
3. Service model and change control
Customization increases dependency on supplier engineering discipline. Buyers should define response windows such as remote diagnosis in 4 hours, software bug triage in 24 hours, and critical spare part dispatch within 48 to 72 hours where geography allows. Without these terms, support quality becomes difficult to enforce after site acceptance.
The following table helps procurement and engineering teams compare supplier readiness in a more structured way.
If a supplier cannot answer these questions with engineering specificity, the project is likely still in concept-selling mode. That does not automatically disqualify them, but it does mean buyers should expect longer clarification cycles and higher implementation risk.
When a Standard Model Is the Smarter First Step
Not every automation roadmap should begin with customization. In many operations, a standard model is the better first move because it creates baseline data quickly. Within the first 60 to 120 days, a pilot fleet can reveal route congestion, battery behavior, mission density, and operator interaction issues that are hard to model accurately before deployment.
Typical use cases for starting standard
- Warehouse pallet transfer with repeatable path structure
- Point-to-point material movement between line-side buffers
- Facilities with fewer than 5 major integration endpoints
- Sites validating business case before a 10-unit to 30-unit scale-up
This approach is especially valuable when internal stakeholders are still aligning on ownership between operations, IT, maintenance, and EHS. A standard platform can create operational evidence before larger capital is committed. In some enterprises, that reduces approval friction significantly, especially when capex committees want a visible ROI path in 12 to 24 months.
A practical phased model
- Phase 1: deploy 1–3 standard units in a controlled route zone
- Phase 2: measure mission success rate, utilization, charging behavior, and labor touchpoints for 8–10 weeks
- Phase 3: decide whether software, payload interface, or traffic logic requires custom redesign
This phased path helps avoid premature over-engineering. It also makes later engagement with a custom AMR AGV supplier more efficient, because site data replaces assumptions. Instead of saying “we think the process is complex,” the buyer can show that docking misses exceed 2% on one interface or that mission queues spike between 10:00 and 12:00 when utilization passes 75%.
Total Cost, Risk, and ROI: What Enterprise Buyers Should Model
The most common purchasing mistake is comparing only vehicle price. A better model separates costs into 5 buckets: hardware, software integration, site preparation, service and spare parts, and process impact. Process impact includes manual intervention frequency, dock alignment consistency, charging strategy, and unplanned downtime exposure.
Cost categories that change the decision
- Integration engineering can account for 10%–25% of project value
- Site modifications such as markers, barriers, or docking fixtures may add 5%–12%
- Annual support and spare parts planning often ranges from 3%–8% of deployed asset value
- Each avoided manual transfer step can materially improve labor efficiency at scale
Risk should also be quantified. If one failed interface stops a high-value line for even 20 minutes per shift, the financial impact may outweigh apparent savings from choosing a cheaper standard unit. Conversely, if the application is low criticality and route flexibility is limited, a fully custom build may delay payback unnecessarily.
Three questions to test ROI realism
Can the process scale?
A fleet that works with 2 vehicles may become unstable at 12 if traffic orchestration, charging logic, and dispatch rules are not designed for higher mission density. Ask suppliers what changes between pilot mode and fleet mode, not just what works in a demo cell.
Can maintenance own the system?
If troubleshooting requires supplier intervention for every moderate fault, operating cost rises quickly. Maintenance teams should receive fault tree logic, replacement procedures, and software escalation rules during commissioning, not as an afterthought.
Is the data usable for continuous improvement?
A strong automation investment should generate operational intelligence. Mission completion time, battery cycle count, exception rate, and route congestion metrics should be visible and exportable. Without this data, optimization over the next 12 to 36 months becomes guesswork.
Selection Checklist for Procurement, Operations, and Engineering Teams
Before issuing RFQs, cross-functional teams should align on a shortlist of measurable requirements. This reduces the chance of selecting a standard unit that needs excessive adaptation or a custom supplier that stretches budget without solving the real bottleneck.
Core items to define before supplier comparison
- Payload range, center of gravity, and load dimensions
- Target mission volume per shift and peak traffic windows
- Required docking tolerance and transfer method
- Interface systems: WMS, MES, PLC, ERP, or custom database
- Battery strategy: opportunity charging, swap, or fixed-cycle charging
- Acceptance criteria for FAT, SAT, uptime, and support response
For organizations seeking engineering-first supplier evaluation, this is where disciplined technical review matters most. A credible custom AMR AGV supplier should welcome specification depth, not avoid it. Clear parameters reduce ambiguity, shorten qualification cycles, and improve long-term supplier accountability.
The best path is rarely universal. Standard models are often the right answer for fast validation, lower process complexity, and repeatable material flow. A custom AMR AGV supplier becomes the stronger choice when physical constraints, software interfaces, compliance demands, or uptime requirements exceed standard platform limits. Enterprise teams that evaluate deployment time, integration depth, service structure, and lifecycle economics together make better automation decisions and avoid expensive rework later.
If your team is now comparing standard platforms against a custom build, use an engineering-led checklist before committing budget. To discuss a tailored evaluation framework, get a custom solution, review product details, or explore more automation sourcing strategies, contact us today.
Search News
Hot Articles
- Carbon Fiber StructuresHow to Specify Aerospace Carbon Fiber Assemblies for Lightweight, Load-Bearing PartsJul 11, 2026
- Machine VisionXiaomi, Alibaba DAMO Academy Drive Open-Source Robotics Model Ecosystem, Lowering Algorithm Development Barriers for Overseas SMEs Adopting Chinese Robotics SolutionsMar 30, 2026
- Cobots & ArmsShanxi 'AI+' Conference Showcases Embodied Intelligence with Multinational Buyer Engagement: Key Industry ImplicationsMar 30, 2026
Popular Tags
Recommended News
 Jul 11, 2026How to Specify Aerospace Carbon Fiber Assemblies for Lightweight, Load-Bearing PartsAerospace carbon fiber assemblies: learn how to specify laminate design, load data, joining methods, and inspection controls for lighter, reliable load-bearing aerospace parts.Elena Rostova (UAV Systems Researcher)
 Mar 30, 2026Xiaomi, Alibaba DAMO Academy Drive Open-Source Robotics Model Ecosystem, Lowering Algorithm Development Barriers for Overseas SMEs Adopting Chinese Robotics SolutionsXiaomi & Alibaba DAMO Academy's open-source robotics models lower algorithm barriers for global SMEs. Boost efficiency in manufacturing, logistics & smart retail with ROS 2 compatible solutions.TSV Data Lab
 Mar 30, 2026Shanxi 'AI+' Conference Showcases Embodied Intelligence with Multinational Buyer Engagement: Key Industry ImplicationsShanxi 'AI+' Conference highlights embodied intelligence with Tesla, Ubtech & Jiantao showcasing multimodal robotics. 40+ global buyers validated tech on-site, creating new B2B channels for industrial automation & AI solutions.Chen Wei (Automation Lead Engineer)
 Mar 30, 2026Zhongguancun Unveils 6G Integrated Sensing-Computing-Intelligence Platform to Empower Embodied Robots for Global Industrial ApplicationsZhongguancun's new 6G platform revolutionizes industrial robotics with <10ms latency, empowering global automotive, logistics & port automation. Discover how this tech boosts China's smart manufacturing exports.TSV Data Lab
 Mar 30, 2026Mech-Mind Tianjin Embodied Intelligence R&D and Production Base Goes Live, Cutting Delivery Time by 20%–30% for Global Customized AMR+Vision SolutionsMech-Mind's Tianjin AMR+Vision production base cuts delivery time by 20%-30% for欧美 & Latin American markets. Discover how this PLd-certified facility accelerates customized robotics solutions for smart manufacturing and logistics.Chen Wei (Automation Lead Engineer)
 Mar 30, 2026Boao Forum Reveals 'Co-evolution of Big and Small Brains' Trend in Humanoid Robots, China's Embodied Intelligence Accelerates Adaptation to Overseas Manufacturing Service ScenariosDiscover how China's humanoid robots, featuring 'Co-evolution of Big and Small Brains,' are revolutionizing global manufacturing. Learn about Embodied Tian Gong 3.0's ISO compliance and overseas deployment at Boao Forum 2026.Chen Wei (Automation Lead Engineer)
 Mar 30, 2026China Railway Industrial Secures Patent for Embodied Robotics in Material Handling, Boosting High-Precision Delivery Capabilities for Overseas Infrastructure and Manufacturing ProjectsChina Railway Industrial's new patent for embodied robotics in material handling boosts high-precision delivery for global infrastructure & manufacturing. Discover how this innovation enhances logistics accuracy in automotive, rail transit & EPC projects.Chen Wei (Automation Lead Engineer)
 Sep 29, 2026ISO 9283 Repeatability: How to Evaluate Cobot Positioning PerformanceISO 9283 cobot repeatability explained: learn how payload, reach, approach direction, and test conditions affect positioning performance and cell capability.Chen Wei (Automation Lead Engineer)
 Sep 28, 2026Spindle Runout Measurement in Germany: DIN Standards, Methods, and Acceptance LimitsSpindle runout measurement Germany: explore DIN standards, proven methods, acceptance limits, and audit-ready practices for reliable machining quality.Dr. Marcus Vance
 Sep 27, 2026How to Select Wall-Mount Edge Devices for Space-Constrained Factory NetworksWall mount edge devices for space-constrained factories: evaluate workload, thermal design, power resilience, cable access, and network reliability for smarter deployments.TSV Data Lab
 Sep 26, 2026Machining Tolerance Analysis: How to Set Limits That Meet Function and Cost TargetsMachining tolerance analysis: learn how to set functional limits, control tolerance stacks, reduce inspection risk, and balance precision with production cost.Dr. Marcus Vance
 Sep 25, 2026How to Evaluate an Industrial Infrastructure Data Platform for Multi-Site OperationsIndustrial infrastructure data platform evaluation guide for multi-site operations: compare data quality, edge resilience, interoperability, governance, and scalable proof-of-value criteria.Victor Lin (Chief Software Architect)
 Sep 24, 2026How to Select Machine Vision Optics for Accurate Inspection at Different Working DistancesMachine vision optics selection guide for accurate inspection at every working distance. Compare FOV, pixel scale, DOF, distortion, lighting, and telecentric options.TSV Data Lab
 Sep 23, 2026How to Evaluate a Machine Vision System Integrator for High-Speed Inspection LinesChoose a machine vision system integrator with proven expertise in high-speed inspection, reliable reject timing, robust optics, and measurable acceptance criteria.TSV Data Lab
 Sep 28, 2026When is a SCADA API the right choice for connecting plant systems?SCADA API guide: learn when governed plant data integration improves traceability, security, and scalability—without compromising real-time control.Victor Lin (Chief Software Architect)
 Sep 27, 2026How SCADA data integration improves traceability across production linesSCADA data integration connects production-line data to improve traceability, accelerate quality investigations, and strengthen safety decisions.Victor Lin (Chief Software Architect)
 Sep 26, 2026What to define before starting SCADA integration planningSCADA integration planning starts with clear scope, control boundaries, data models, cybersecurity, and testing. Discover the definitions that reduce risk and costly rework.Victor Lin (Chief Software Architect)
 Sep 25, 2026How a smart factory with Industrial IoT reduces production blind spotsDiscover how a smart factory with Industrial IoT turns real-time machine, quality, and workflow data into actionable insights that reduce production blind spots and delivery risks.Victor Lin (Chief Software Architect)
 Sep 24, 2026When does Industrial IoT make smart manufacturing easier to scale?Smart manufacturing Industrial IoT scales when trusted data, interoperable systems, and secure workflows turn connected assets into measurable gains.TSV Data Lab
 Sep 23, 2026What drives ultra-precision machining cost at 1-micron tolerance?Ultra precision machining cost per part at 1 micron tolerance depends on process, material, metrology, and yield. Learn how to compare quotes confidently.Dr. Marcus Vance
 Sep 22, 2026Drone Engine-T550CC Applications: Build the UAV Power System Around the MissionAn application guide for Drone Engine-T550CC integration, covering payload planning, airframe matching, cooling, fuel, vibration, test procedures, documentation, and service preparation.Elena Rostova (UAV Systems Researcher)
 Sep 22, 2026How to Evaluate Industrial Edge Computing Vendors for Factory DeploymentIndustrial edge computing vendor evaluation guide for factories: compare latency, protocol fit, reliability, security, and lifecycle support before deployment.TSV Data Lab
 Sep 21, 2026Drone Payload Integration: Matching Power, Data, and Center of Gravity for Reliable FlightsDrone payload integration made practical: balance power, data, center of gravity, and endurance to build safer, more reliable mission-ready flights.Elena Rostova (UAV Systems Researcher)
 Sep 20, 2026Autonomous Navigation Pricing: Cost Drivers and Budget Benchmarks for AMR ProjectsAutonomous navigation price explained: compare AMR cost drivers, software, sensors, integration, safety, and lifecycle budgets to build a scalable project plan.Chen Wei (Automation Lead Engineer)