AMR Load Capacity Comparison: How to Match Payload, Speed, and Floor Conditions
Publication Date
author
An effective amr load capacity comparison starts where many vendor brochures stop. Rated payload matters, but it never acts alone.
Once speed targets rise and floor conditions become less controlled, the useful carrying range of an AMR can change quickly.
That is why this topic now sits at the center of warehouse automation, electronics assembly, aerospace supply chains, and mixed-use industrial logistics.
For teams working from hard data rather than marketing language, the real question is simple: what load can a mobile robot move reliably, repeatedly, and safely in the actual facility?
Why payload figures rarely tell the full story
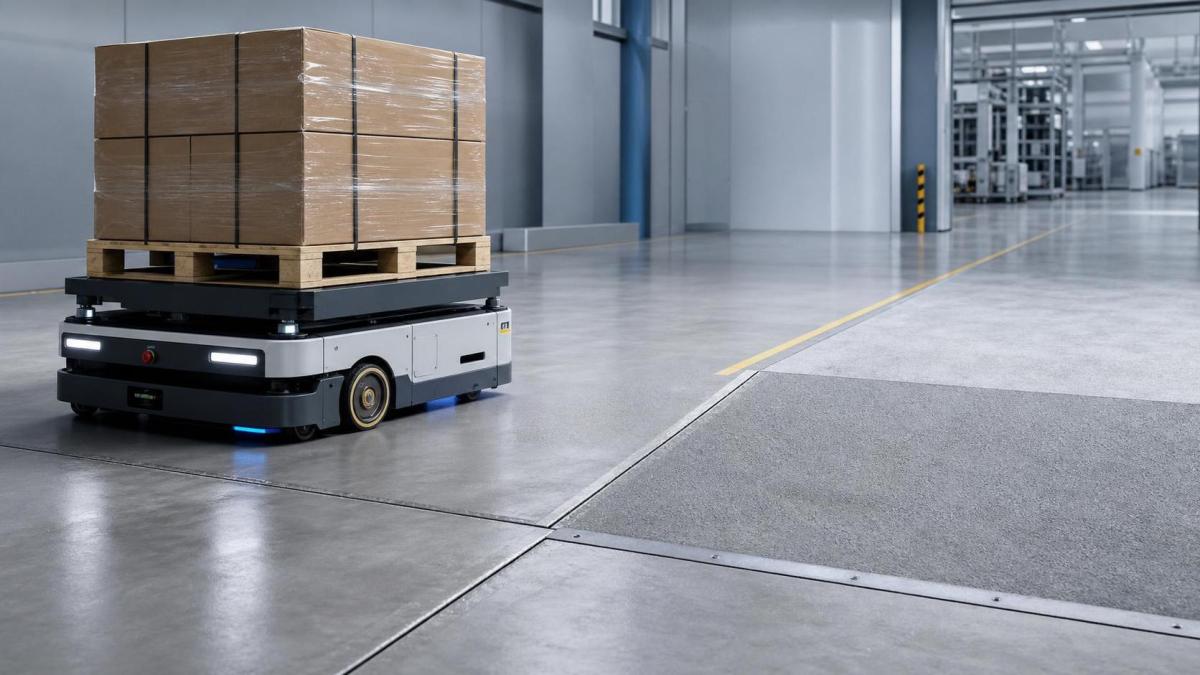
A catalog may show 300 kg, 600 kg, or 1500 kg as a clean number. In practice, that number is tied to test assumptions.
Those assumptions often include flat concrete, moderate speed, centered loads, limited ramping, and predictable stop distances.
The moment one condition shifts, the comparison changes. A robot carrying 500 kg at 1.8 m/s behaves differently from one moving the same load at 0.8 m/s.
This is where a disciplined amr load capacity comparison becomes valuable. It reveals whether rated payload aligns with operating payload.
TechStat Vanguard has consistently argued that engineering decisions should be anchored in measurable thresholds, not headline claims. AMR selection is a clear example.
The three variables that change carrying performance
Payload, speed, and floor condition form a coupled system. Evaluating one without the others creates blind spots.
Payload affects more than lifting strength
Higher payload changes braking distance, turning stability, battery draw, wheel wear, and docking precision.
It can also shift the center of gravity, especially when loads are tall, offset, or dynamically unstable.
Speed multiplies mechanical and control demands
A platform may carry a nominal load safely at low speed, yet lose navigation smoothness under aggressive acceleration profiles.
Throughput models often ignore this tradeoff. Faster travel can reduce cycle time on paper while increasing emergency stops or route slowdowns in reality.
Floors define traction and repeatability
Small floor defects matter more than many buyers expect. Joint gaps, repaired cracks, embedded rails, coatings, dust, and wet zones can all alter traction.
In an amr load capacity comparison, floor quality often explains why identical models perform differently across sites.
What should be compared instead of rated load alone
A better evaluation framework uses operating envelopes rather than a single payload number.
The table below shows the factors that usually separate a usable comparison from a superficial one.
In other words, a serious amr load capacity comparison should describe a range of conditions, not a single maximum.
Why floor conditions deserve earlier attention
Floor quality is often reviewed too late, after route design or vendor shortlisting.
That sequence creates avoidable risk because floor variation directly affects wheel slip, sensor confidence, and docking repeatability.
A polished epoxy surface may support clean motion at one loading level, then produce drift under heavier braking.
A rough slab may be acceptable for tugging applications, yet unsuitable for precise handoff stations.
This matters beyond warehouses. Semiconductor support zones, aerospace subassembly cells, medical device production, and heavy machining logistics all have different floor realities.
TSV’s broader benchmarking philosophy applies here as well: parameters need environmental context before they can support procurement decisions.
Typical scenarios where the wrong match appears
The most expensive AMR mismatch is not always a total failure. Often it is a partial underperformance that becomes visible only after launch.
- A unit meets payload requirements but must run below planned speed, reducing line replenishment frequency.
- A platform handles smooth routes well but struggles at dock transitions with loaded pallets.
- Battery life falls short because heavy loads and repeated acceleration increase current draw.
- Navigation remains accurate in empty runs but degrades when load height blocks sensor fields or changes vibration response.
- Wheel and drivetrain maintenance costs rise because the selected margin was too narrow for the floor profile.
Each case begins with the same mistake: treating amr load capacity comparison as a static specification check.
A practical method for comparing AMRs
A useful comparison process starts from route physics and process timing, then works backward into robot specifications.
Map the real load profile
Document average load, peak load, load height, footprint, and center-of-mass variation across the route.
Define throughput targets honestly
Separate theoretical maximum speed from allowed operating speed in traffic, crossings, and handoff zones.
Audit the floor as an engineering input
Record slope, cracks, patchwork, expansion joints, coating changes, and contamination risk by route segment.
Ask vendors for condition-based data
Request stopping distance, acceleration limits, repeatability, and battery performance at your intended payload and surface condition.
Test the edge cases
The most useful trial is rarely the average case. Test loaded turns, route merges, dock entries, and degraded floor sections.
What stronger evaluation data looks like
For higher-value deployments, the evidence standard should rise with operational risk.
Instead of asking whether an AMR can carry a certain mass, ask for data sets that show how performance changes across payload bands.
A stronger amr load capacity comparison may include loaded braking curves, cycle-time loss at different speeds, wheel wear rates, and repeatability under floor variation.
That approach reflects the larger TSV principle that supply chain decisions improve when specifications are traceable, comparable, and testable.
Where to focus the next decision
Before expanding a shortlist, convert broad automation goals into a site-specific comparison sheet.
Include payload distribution, route speed, stop frequency, floor segments, docking tolerance, and duty cycle expectations.
Then use that sheet to structure every amr load capacity comparison in the same format.
That single step usually exposes which platforms are robust fits, which need route compromises, and which should be removed early.
In a market crowded with broad claims, the most reliable path remains the same: compare payload in motion, compare speed under load, and compare both against the floor that will decide actual performance.
Search News
Hot Articles
- Carbon Fiber StructuresHow to Specify Aerospace Carbon Fiber Assemblies for Lightweight, Load-Bearing PartsJul 11, 2026
- Machine VisionXiaomi, Alibaba DAMO Academy Drive Open-Source Robotics Model Ecosystem, Lowering Algorithm Development Barriers for Overseas SMEs Adopting Chinese Robotics SolutionsMar 30, 2026
- Cobots & ArmsShanxi 'AI+' Conference Showcases Embodied Intelligence with Multinational Buyer Engagement: Key Industry ImplicationsMar 30, 2026
Popular Tags
Recommended News
 Jul 11, 2026How to Specify Aerospace Carbon Fiber Assemblies for Lightweight, Load-Bearing PartsAerospace carbon fiber assemblies: learn how to specify laminate design, load data, joining methods, and inspection controls for lighter, reliable load-bearing aerospace parts.Elena Rostova (UAV Systems Researcher)
 Mar 30, 2026Xiaomi, Alibaba DAMO Academy Drive Open-Source Robotics Model Ecosystem, Lowering Algorithm Development Barriers for Overseas SMEs Adopting Chinese Robotics SolutionsXiaomi & Alibaba DAMO Academy's open-source robotics models lower algorithm barriers for global SMEs. Boost efficiency in manufacturing, logistics & smart retail with ROS 2 compatible solutions.TSV Data Lab
 Mar 30, 2026Shanxi 'AI+' Conference Showcases Embodied Intelligence with Multinational Buyer Engagement: Key Industry ImplicationsShanxi 'AI+' Conference highlights embodied intelligence with Tesla, Ubtech & Jiantao showcasing multimodal robotics. 40+ global buyers validated tech on-site, creating new B2B channels for industrial automation & AI solutions.Chen Wei (Automation Lead Engineer)
 Mar 30, 2026Zhongguancun Unveils 6G Integrated Sensing-Computing-Intelligence Platform to Empower Embodied Robots for Global Industrial ApplicationsZhongguancun's new 6G platform revolutionizes industrial robotics with <10ms latency, empowering global automotive, logistics & port automation. Discover how this tech boosts China's smart manufacturing exports.TSV Data Lab
 Mar 30, 2026Mech-Mind Tianjin Embodied Intelligence R&D and Production Base Goes Live, Cutting Delivery Time by 20%–30% for Global Customized AMR+Vision SolutionsMech-Mind's Tianjin AMR+Vision production base cuts delivery time by 20%-30% for欧美 & Latin American markets. Discover how this PLd-certified facility accelerates customized robotics solutions for smart manufacturing and logistics.Chen Wei (Automation Lead Engineer)
 Mar 30, 2026Boao Forum Reveals 'Co-evolution of Big and Small Brains' Trend in Humanoid Robots, China's Embodied Intelligence Accelerates Adaptation to Overseas Manufacturing Service ScenariosDiscover how China's humanoid robots, featuring 'Co-evolution of Big and Small Brains,' are revolutionizing global manufacturing. Learn about Embodied Tian Gong 3.0's ISO compliance and overseas deployment at Boao Forum 2026.Chen Wei (Automation Lead Engineer)
 Mar 30, 2026China Railway Industrial Secures Patent for Embodied Robotics in Material Handling, Boosting High-Precision Delivery Capabilities for Overseas Infrastructure and Manufacturing ProjectsChina Railway Industrial's new patent for embodied robotics in material handling boosts high-precision delivery for global infrastructure & manufacturing. Discover how this innovation enhances logistics accuracy in automotive, rail transit & EPC projects.Chen Wei (Automation Lead Engineer)
 Oct 06, 2026Navigation Fault Tolerance Standards for AMRs: What Safety Teams Must VerifyNavigation fault tolerance standards: learn what AMR safety teams must verify, from localization loss and sensor faults to stopping distance, safe restart, and site-specific validation.Chen Wei (Automation Lead Engineer)
 Oct 05, 2026Calculating Edge Computing Total Cost of Ownership Across Distributed SitesEdge computing ownership cost explained: calculate deployment, energy, connectivity, security, remote support, and refresh costs across distributed sites.TSV Data Lab
 Oct 04, 2026CAD/CAM Benchmarking in the GCC: What Manufacturers Should Ask a ConsultantCAD CAM benchmark consultant GCC guide: learn the key questions manufacturers should ask to validate post-processors, workflows, machine performance, and production risk.Victor Lin (Chief Software Architect)
 Oct 03, 2026Selecting Automotive Radar Sensor Modules for ADAS Range, Resolution, and IntegrationAutomotive radar sensor module selection guide for ADAS: compare range, resolution, field of view, latency, and integration to build safer, reliable vehicle systems.TSV Data Lab
 Oct 02, 2026How to Qualify Machined Parts Suppliers for Hard Tech ProgramsHard tech supply chain machined parts demand rigorous supplier qualification. Learn how to assess capability, traceability, quality controls, and delivery resilience.Dr. Marcus Vance
 Oct 01, 2026How to Select an Outdoor Security Radar Sensor for Perimeter Detection?Outdoor security radar sensor selection guide: compare range, accuracy, false-alarm control, integration, and field testing for reliable perimeter detection.TSV Data Lab
 Sep 30, 2026How to Evaluate Solid-State LiDAR Hardware for Outdoor Autonomous VehiclesSolid state LiDAR hardware evaluation guide for outdoor autonomous vehicles—compare range, point-cloud quality, environmental resilience, integration, and safety.TSV Data Lab
 Sep 29, 2026ISO 9283 Repeatability: How to Evaluate Cobot Positioning PerformanceISO 9283 cobot repeatability explained: learn how payload, reach, approach direction, and test conditions affect positioning performance and cell capability.Chen Wei (Automation Lead Engineer)
 Oct 06, 2026Are Collaborative Robots Safe Enough to Operate Without Fencing?Are collaborative robots safe enough to work without fencing? Explore risk assessment, safeguarding options, and practical guidance for safer, productive cobot cells.Chen Wei (Automation Lead Engineer)
 Oct 05, 2026What Causes Machine Vision Systems to Miss Small Defects?What causes machine vision systems to miss small defects? Discover how lighting, optics, motion, and AI thresholds affect detection—and prevent costly escapes.TSV Data Lab
 Oct 04, 2026How Should You Compare 5-Axis CNC Machine Accuracy Claims?How do I compare 5-axis CNC machine accuracy claims? Learn how to assess standards, thermal stability, TCP accuracy, and real-world test evidence.Dr. Marcus Vance
 Oct 03, 2026Is Edge Computing Necessary for Real-Time Quality Inspection?Is industrial edge computing necessary for real-time quality inspection? Explore how latency, data volume, reliability, and control integration shape the right architecture.TSV Data Lab
 Oct 02, 2026What Documents Prove a Precision Machining Supplier Can Hold Tolerance?What documents prove a precision machining supplier can hold tolerance? Explore certificates, FAI reports, calibration, SPC, and traceability evidence to qualify suppliers with confidence.Dr. Marcus Vance
 Oct 01, 2026Can a Machining Supplier Meet Aerospace Fatigue Testing Requirements?Can a machining supplier meet aerospace fatigue testing requirements? Learn the traceability, process control, and test evidence needed for reliable aerospace parts.Dr. Marcus Vance
 Sep 30, 2026Which Industrial Robot Specifications Matter for High-Precision Assembly?Which industrial robot specifications matter most for high-precision assembly? Explore repeatability, accuracy, stiffness, vibration, calibration, and force control for reliable yields.Chen Wei (Automation Lead Engineer)
 Sep 29, 2026How Do You Verify Servo Motor Torque Under Continuous Load?How do I verify servo motor torque under continuous load? Learn RMS torque checks, torque-speed limits, thermal derating, and real-machine testing.Chen Wei (Automation Lead Engineer)
 Oct 02, 2026ZD330 Software Configuration: Verifying Cut-List Import Before PurchaseZD330 software and machine configuration: verify cut-list imports, data mapping, labels, and workflow before purchase to reduce errors and choose with confidence.Victor Lin (Chief Software Architect)