Why some 3D printing titanium porosity tests miss weak spots
Publication Date
author
Why do some 3d printing titanium porosity test methods overlook critical weak spots that later trigger fatigue failure? For engineers, buyers, and decision-makers comparing industrial 3d printing service china capabilities, the answer often lies in scan resolution, sample location, and interpretation standards. This article explains where hidden defects escape detection and how porosity data should connect with titanium grade 5 machinability, micro machining tolerance limits, and real production risk.
In titanium additive manufacturing, especially for aerospace, UAV, medical, and high-load industrial parts, a porosity report is often treated as a pass-or-fail document. That is too simplistic. A part can show acceptable average density while still containing local defect clusters that become fatigue initiation sites after machining, heat treatment, or cyclic loading.
For procurement teams and technical managers, this creates a hidden sourcing risk. Two suppliers may both claim low porosity, yet their inspection logic, CT scan settings, coupon strategy, and acceptance criteria may differ by a factor of 2 to 5 in defect sensitivity. The result is not just a metrology issue; it is a qualification, warranty, and lifecycle cost issue.
TechStat Vanguard focuses on this gap between marketing claims and engineering truth. In real production, porosity data only becomes decision-grade when it is linked to build orientation, hotspot geometry, post-processing, and downstream machining windows. Without that linkage, weak spots remain invisible until the part reaches service.
Why average porosity numbers can hide dangerous local defects
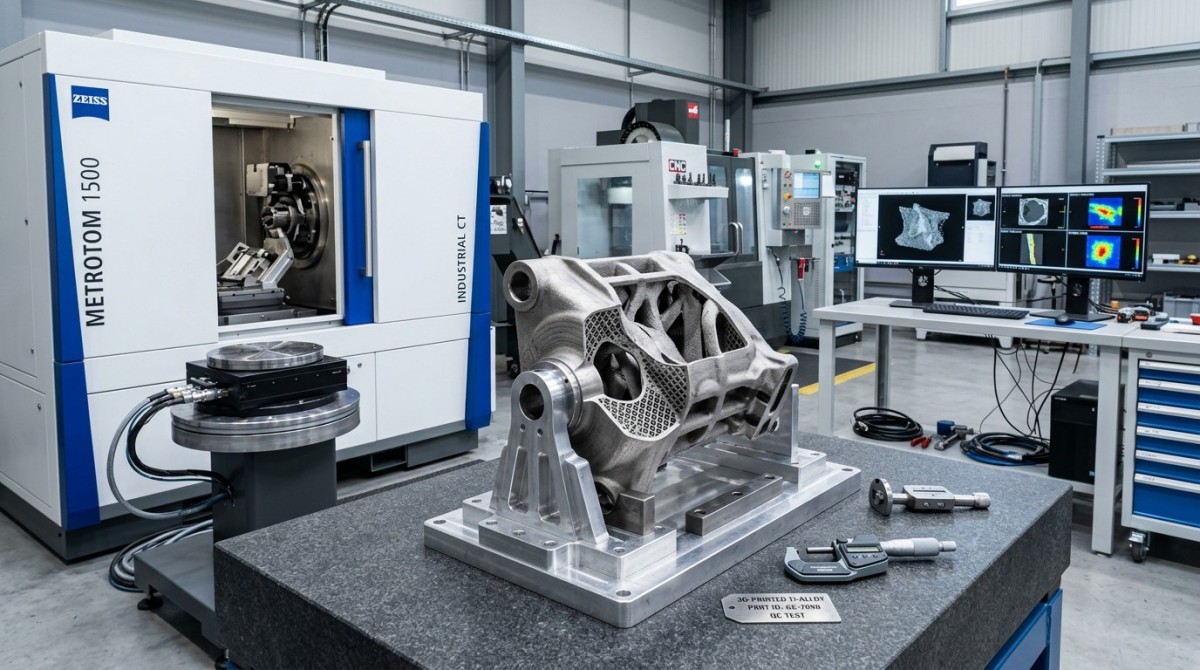
Many porosity tests summarize the result as a single volume fraction, such as 0.02%, 0.05%, or 0.1%. That number is useful, but it does not show whether pores are evenly dispersed or concentrated near a notch, thin wall, internal channel, or support transition. In fatigue-critical titanium parts, a 200–500 µm cluster near a high-stress zone can matter more than a much larger number of tiny isolated pores elsewhere.
This is particularly relevant for Ti-6Al-4V, commonly referred to as titanium grade 5. The alloy performs well in high strength-to-weight applications, but it is also sensitive to process history. During laser powder bed fusion or related metal AM routes, pore formation can be driven by lack of fusion, keyholing, trapped gas, powder contamination, or unstable energy density. Each mechanism creates different pore shapes, distributions, and mechanical consequences.
A rounded gas pore with a diameter below 50 µm may have a limited effect in some static load cases. By contrast, elongated lack-of-fusion defects aligned across layer boundaries can reduce fatigue performance much more severely, even when the total porosity percentage looks low. That is why engineers should ask not only “How much porosity?” but also “What morphology, what location, and what orientation?”
The problem grows when test reports rely on witness coupons rather than the actual critical geometry. Coupons may be built in a thermally stable region of the build plate, while the real part contains thicker masses, unsupported overhangs, or abrupt section changes. In such cases, the coupon passes and the part fails later in service or during validation testing after 105 to 107 load cycles.
Common ways weak spots escape detection
- Testing only bulk average density without mapping porosity by region, layer band, or stress-critical feature.
- Using coupons built 20–80 mm away from the actual part thermal environment on the same plate.
- Applying one global acceptance threshold, even when local fatigue hotspots require stricter limits.
- Ignoring morphology and reporting only pore count or pore percentage.
For decision-makers, the implication is clear: a low porosity claim without defect mapping is incomplete. It may support a sales brochure, but it does not fully support source approval for flight hardware, critical fixtures, or precision titanium inserts.
How scan resolution, threshold settings, and sample strategy distort results
Computed tomography, metallographic sectioning, Archimedes density, and ultrasonic methods are all used in porosity evaluation, but they do not have the same sensitivity. CT is powerful because it can reveal internal pore distribution in 3D, yet it is strongly limited by voxel size, beam hardening control, reconstruction quality, and segmentation thresholds. A scan at 30–50 µm voxel resolution may miss defects that become highly relevant in thin walls or micro-feature zones.
Threshold setting is another hidden variable. If grayscale segmentation is tuned aggressively to reduce noise, very small pores or low-contrast lack-of-fusion regions may disappear from the final dataset. If the threshold is too loose, false positives increase. This means two labs can scan the same titanium part and produce different pore counts, maximum defect diameters, and local volume fractions, even when both follow internally consistent procedures.
Metallographic sectioning offers higher local resolution, often revealing pores below 10 µm, but it samples only selected planes. If the section misses the critical band where thermal instability occurred, the defect cluster remains undetected. Archimedes density is fast and useful for trend control, but it is a bulk method. It cannot tell whether density loss comes from harmless distributed microporosity or one severe internal discontinuity.
For procurement and supplier auditing, this means porosity reports should always be read together with the test method statement. A result without stated scan resolution, threshold logic, sample count, and region of interest is not sufficiently decision-ready for high-consequence titanium components.
Comparison of common porosity test methods
The table below shows why different porosity test methods can lead to different conclusions when evaluating 3D printed titanium parts used in demanding industrial applications.
The key takeaway is not that one method is always best. It is that method capability must match risk level. For a cosmetic bracket, one bulk method may be enough. For a fatigue-loaded aerospace or UAV component, a combined strategy is often more reliable: high-resolution CT for location mapping, plus targeted metallography in the highest-risk zones.
Minimum reporting details buyers should request
- Voxel size or section resolution used for defect detection.
- Part region tested: gauge section, fillet, thin wall, internal channel, or coupon.
- Thresholding or image segmentation logic.
- Maximum pore size, not just total porosity percentage.
- Defect morphology notes: spherical, irregular, planar, or clustered.
Why porosity data must be linked to machining, tolerance, and final part geometry
A frequent sourcing mistake is to evaluate porosity before machining and then assume the final part inherits the same risk profile. In reality, machining can either remove pore-rich surface layers or expose subsurface defects in the finished tolerance zone. This is especially important in titanium grade 5 components that require tight dimensional control, such as micro features, sealing lands, threaded bosses, and thin structural interfaces.
Suppose an as-built surface has a 0.3–0.6 mm machining allowance. If the defect population is concentrated in the outer 200 µm, finish machining may improve integrity. But if lack-of-fusion defects extend 0.8–1.2 mm below the surface at a fillet root, the final machined part may still contain the most dangerous discontinuities exactly where stress is highest. A pre-machining density result alone cannot answer that question.
Micro machining tolerance adds another layer. When final features require tolerances such as ±0.02 mm, ±0.01 mm, or finer in selected areas, defect exposure becomes more sensitive to stock removal strategy and toolpath planning. Pores opened by final finishing can increase local roughness, create edge breakout, or reduce thread quality in small-diameter features. This is where porosity testing and machining planning must be reviewed together rather than as separate departments.
For operators and process engineers, the practical implication is simple: identify which surfaces are functional after machining, then inspect the material volume that will remain after stock removal. A porosity map should be referenced to the final CAD boundary, not only the as-built envelope.
Interaction between porosity and downstream manufacturing risk
The following table connects porosity findings with machining and tolerance concerns that matter in supplier qualification and drawing review.
This is why advanced buyers increasingly ask not only for porosity values, but for defect-position overlays relative to final part geometry. That request is especially justified when the component enters aerospace assemblies, high-speed rotating systems, compact robotics, or precision medical tooling where failure cost is much higher than test cost.
Three questions to ask before approving a titanium AM supplier
- Was porosity assessed on the as-built coupon, the near-net part, or the final machined geometry volume?
- Do the reported defects overlap with areas carrying the highest cyclic stress or the tightest machining tolerance?
- Is there a defined response plan when local pore size exceeds the drawing-critical limit by 50–100 µm?
A practical qualification framework for engineers, buyers, and decision-makers
A useful supplier review process for industrial 3d printing service china or any global source should move beyond a single lab certificate. Instead, build a 4-layer qualification framework: process stability, inspection capability, geometry relevance, and downstream performance. This approach reduces the chance of approving a vendor on attractive sample data that does not represent serial production conditions.
First, review process stability. Ask about powder reuse policy, lot traceability, layer thickness range, and energy parameter control windows. Even a well-tuned titanium process can drift if powder oxygen level, particle morphology, or recoating consistency changes over 3 to 10 builds. Stable porosity control depends on stable upstream discipline.
Second, review inspection capability. A credible supplier should explain when they use CT, when they use metallography, and how they define a region of interest. Third, review geometry relevance. A report on a simple block does not qualify a lattice-reinforced bracket, a hollow UAV hinge, or a thin-wall medical guide. Fourth, review downstream performance, including hot isostatic pressing, heat treatment, machining allowance, and fatigue validation where required.
For business leaders, this framework also supports better cost control. A more rigorous inspection plan may add 3% to 8% to part qualification cost, but that is usually minor compared with field failure, requalification delay, grounded hardware, or production stop caused by hidden titanium porosity defects.
Recommended qualification checkpoints
The table below can be used as a practical sourcing checklist when comparing suppliers for titanium additive manufacturing programs with moderate to high reliability requirements.
A supplier that answers these points with traceable data is easier to benchmark objectively. That is the kind of evidence procurement teams should prioritize when reducing qualification cycles without lowering technical standards.
Implementation sequence for a new part
- Define critical load paths and fatigue-sensitive features from the drawing and use case.
- Choose porosity test methods based on required defect detectability, not only lab convenience.
- Align inspection zones with final machined geometry and tolerance windows.
- Set region-based acceptance thresholds and escalation actions for outliers.
- Revalidate after process, heat treatment, or machining strategy changes.
FAQ and final guidance for risk-based sourcing
In practice, the most costly mistakes happen when porosity testing is treated as a routine box-check instead of a part-specific risk control tool. The questions below address common search and procurement concerns that arise during supplier comparison, technical review, and launch planning.
Is low porosity percentage enough to approve a titanium AM part?
No. A low average value can still hide a local defect cluster in a high-stress region. Approval decisions should include maximum pore size, defect morphology, location relative to the final geometry, and intended service condition. For components facing repeated cyclic loading, local conditions often matter more than the global average.
How many samples or sections are usually reasonable?
There is no universal number, but one coupon and one scan are often insufficient for high-risk parts. A practical approach is to inspect multiple regions: at least one representative coupon, one or more critical part zones, and targeted sections where thermal gradients or stress concentration are expected. Higher-value parts justify more sampling than low-consequence hardware.
Does hot isostatic pressing eliminate the problem?
It can reduce certain internal pores, but it does not automatically solve every defect type or every fatigue concern. Planar lack-of-fusion defects, contamination-related issues, and geometry-driven process instability still require proper build control and verification. HIP should be seen as one control layer, not a substitute for sound inspection logic.
What should buyers ask when comparing industrial 3d printing service china suppliers?
Ask for method details, not just pass statements. Request scan resolution, region-of-interest definition, coupon-to-part correlation, post-processing route, titanium grade 5 machinability considerations, and how porosity data is linked to final tolerance features. Suppliers that can explain these points clearly are usually better prepared for stable production and technical audits.
Porosity testing misses weak spots when it focuses on averages, uses the wrong sampling logic, or ignores how the final titanium part will be machined and loaded. Better sourcing decisions come from linking defect detection to geometry, fatigue risk, machining allowance, and traceable inspection settings. That is where engineering truth replaces vague quality claims.
If your team is benchmarking titanium additive manufacturing capability, qualifying a new supplier, or reviewing a fatigue-sensitive part, a data-first evaluation framework will save time, reduce rework, and improve source confidence. Contact us to discuss your component requirements, request a customized assessment approach, or explore more hard-tech benchmarking solutions.
Search News
Hot Articles
- Carbon Fiber StructuresHow to Specify Aerospace Carbon Fiber Assemblies for Lightweight, Load-Bearing PartsJul 11, 2026
- Machine VisionXiaomi, Alibaba DAMO Academy Drive Open-Source Robotics Model Ecosystem, Lowering Algorithm Development Barriers for Overseas SMEs Adopting Chinese Robotics SolutionsMar 30, 2026
- Cobots & ArmsShanxi 'AI+' Conference Showcases Embodied Intelligence with Multinational Buyer Engagement: Key Industry ImplicationsMar 30, 2026
Popular Tags
Recommended News
 Jul 11, 2026How to Specify Aerospace Carbon Fiber Assemblies for Lightweight, Load-Bearing PartsAerospace carbon fiber assemblies: learn how to specify laminate design, load data, joining methods, and inspection controls for lighter, reliable load-bearing aerospace parts.Elena Rostova (UAV Systems Researcher)
 Mar 30, 2026Xiaomi, Alibaba DAMO Academy Drive Open-Source Robotics Model Ecosystem, Lowering Algorithm Development Barriers for Overseas SMEs Adopting Chinese Robotics SolutionsXiaomi & Alibaba DAMO Academy's open-source robotics models lower algorithm barriers for global SMEs. Boost efficiency in manufacturing, logistics & smart retail with ROS 2 compatible solutions.TSV Data Lab
 Mar 30, 2026Shanxi 'AI+' Conference Showcases Embodied Intelligence with Multinational Buyer Engagement: Key Industry ImplicationsShanxi 'AI+' Conference highlights embodied intelligence with Tesla, Ubtech & Jiantao showcasing multimodal robotics. 40+ global buyers validated tech on-site, creating new B2B channels for industrial automation & AI solutions.Chen Wei (Automation Lead Engineer)
 Mar 30, 2026Zhongguancun Unveils 6G Integrated Sensing-Computing-Intelligence Platform to Empower Embodied Robots for Global Industrial ApplicationsZhongguancun's new 6G platform revolutionizes industrial robotics with <10ms latency, empowering global automotive, logistics & port automation. Discover how this tech boosts China's smart manufacturing exports.TSV Data Lab
 Mar 30, 2026Mech-Mind Tianjin Embodied Intelligence R&D and Production Base Goes Live, Cutting Delivery Time by 20%–30% for Global Customized AMR+Vision SolutionsMech-Mind's Tianjin AMR+Vision production base cuts delivery time by 20%-30% for欧美 & Latin American markets. Discover how this PLd-certified facility accelerates customized robotics solutions for smart manufacturing and logistics.Chen Wei (Automation Lead Engineer)
 Mar 30, 2026Boao Forum Reveals 'Co-evolution of Big and Small Brains' Trend in Humanoid Robots, China's Embodied Intelligence Accelerates Adaptation to Overseas Manufacturing Service ScenariosDiscover how China's humanoid robots, featuring 'Co-evolution of Big and Small Brains,' are revolutionizing global manufacturing. Learn about Embodied Tian Gong 3.0's ISO compliance and overseas deployment at Boao Forum 2026.Chen Wei (Automation Lead Engineer)
 Mar 30, 2026China Railway Industrial Secures Patent for Embodied Robotics in Material Handling, Boosting High-Precision Delivery Capabilities for Overseas Infrastructure and Manufacturing ProjectsChina Railway Industrial's new patent for embodied robotics in material handling boosts high-precision delivery for global infrastructure & manufacturing. Discover how this innovation enhances logistics accuracy in automotive, rail transit & EPC projects.Chen Wei (Automation Lead Engineer)
 Oct 20, 2026KUKA Launches iiQKA.AI Vision to Simplify Industrial Image ProcessingKUKA iiQKA.AI Vision simplifies industrial image processing with controller-based 2D and 3D vision. Explore drag-and-drop setup for vision-guided automation.TSV Data Lab
 Oct 20, 2026Smart Industrial Edge Devices: Key Criteria for Legacy PLC IntegrationChoose smart industrial edge devices for legacy PLC integration. Discover key criteria for compatibility, data quality, security, and reliable collection without disrupting control.TSV Data Lab
 Oct 19, 2026Choosing a Radar Sensor by Application: Range, Resolution, and Field of ViewSimplify radar sensor application based product selection. Compare range, resolution, and field of view to avoid blind spots and choose with confidence. Explore the guide.TSV Data Lab
 Oct 18, 2026Comparing Material Options for Procurement: Specs, Costs, and Supply RisksExplore procurement oriented technical content on material options, specs, costs, and supply risks. Compare alternatives to cut hidden expenses and make confident sourcing decisions.Dr. Marcus Vance
 Oct 17, 20265-Axis CNC Positioning Accuracy: How to Interpret ISO 230-2 Test ResultsAssess 5 axis CNC machining positioning accuracy with ISO 230-2. Learn to interpret repeatability, reversal error, and test conditions to compare suppliers and make confident acceptance decisions.Dr. Marcus Vance
 Oct 16, 2026Choosing a Rugged Edge AI Box Supplier: Thermal Tests and Lifecycle SupportChoose a rugged edge AI box supplier with proven thermal performance and reliable lifecycle support. Discover the tests and commitments to verify before you buy.TSV Data Lab
 Oct 15, 2026R&D Cost Reduction Services: How to Evaluate Fees, Savings, and ROIEvaluate R&D cost reduction services with confidence. Compare fees, verify savings, and calculate ROI without compromising performance. Discover how to choose a provider that delivers real value.Chen Wei (Automation Lead Engineer)
 Oct 19, 2026How Do You Verify That Precision Machined Parts Meet Tolerances?Master precision machining tolerance verification with the right tools, datum setups, and acceptance rules. Learn how to validate parts confidently and reduce costly inspection errors.Dr. Marcus Vance
 Oct 18, 2026What Should an AS9100 Machining Supplier Checklist Include?Build an AS9100 machining supplier checklist that verifies capability, traceability, inspection, and outsourced processes. Discover what to check before approving your next aerospace supplier.Dr. Marcus Vance
 Oct 17, 2026How Should You Interpret Industrial Robot Repeatability Specs?Decode industrial robot repeatability specifications, understand ISO 9283 test conditions, and avoid costly selection mistakes. Learn how to verify performance for your process.Chen Wei (Automation Lead Engineer)
 Oct 16, 2026How Can You Fairly Compare MTBF Across Industrial Servo Motors?Make a fair industrial servo motor MTBF comparison with matched operating profiles, failure criteria, and confidence bounds. Discover how to assess reliability beyond advertised numbers.Chen Wei (Automation Lead Engineer)
 Oct 15, 2026How Should You Compare TechStat Vanguard 5-Axis CNC Tolerances?TechStat Vanguard 5-axis CNC tolerance comparison: learn how to verify part accuracy, assess inspection evidence, and choose suppliers that reliably meet your drawing requirements.Dr. Marcus Vance
 Oct 14, 2026Drone Frame Composites: Carbon Fiber vs. Fiberglass for Weight and StiffnessExplore drone structural materials composites: compare carbon fiber and fiberglass for weight, stiffness, cost, and antenna compatibility. Find the right material for your drone frame.Elena Rostova (UAV Systems Researcher)
 Oct 13, 2026Smart Cameras vs. PC-Based Machine Vision: Which Fits High-Speed Inspection?This industrial product comparison for machine vision weighs smart cameras vs. PC-based systems on latency, throughput, and cost. Discover your best fit for high-speed inspection.TSV Data Lab
 Oct 12, 2026How to Verify RoHS Compliance in Industrial Sensing Systems Before DeploymentRoHS compliant sensing systems: learn how to verify materials, supplier declarations, testing, and configuration controls before industrial deployment.TSV Data Lab
 Oct 11, 2026How Procurement-Oriented Content Taxonomy Improves B2B Buying JourneysProcurement-oriented content taxonomy streamlines B2B buying journeys with clearer evidence, supplier comparisons, risk visibility, and faster approvals.TSV Data Lab
 Oct 10, 2026How to Select a Machine Performance Monitoring Platform for OEE and Downtime ReductionMachine performance monitoring platform selection guide: validate machine states, OEE data, downtime reasons, integrations, and scalability to reduce losses with confidence.TSV Data Lab