3D printing titanium porosity test results that signal trouble
Publication Date
author
A failed 3D printing titanium porosity test is rarely “just a test issue.” In most production environments, it is an early warning that the build process, powder condition, parameter window, or post-processing route is no longer stable enough for demanding use cases. For aerospace, medical, and other high-reliability applications, the real concern is not simply whether pores exist, but whether their size, shape, concentration, and location indicate elevated risk for fatigue failure, leakage, distortion, or qualification delays. For engineers, operators, procurement teams, and business leaders evaluating industrial 3D printing service China suppliers against precision machining benchmarks, knowing which porosity results signal real trouble is essential for making faster and safer decisions.
What porosity test results should immediately raise concern?
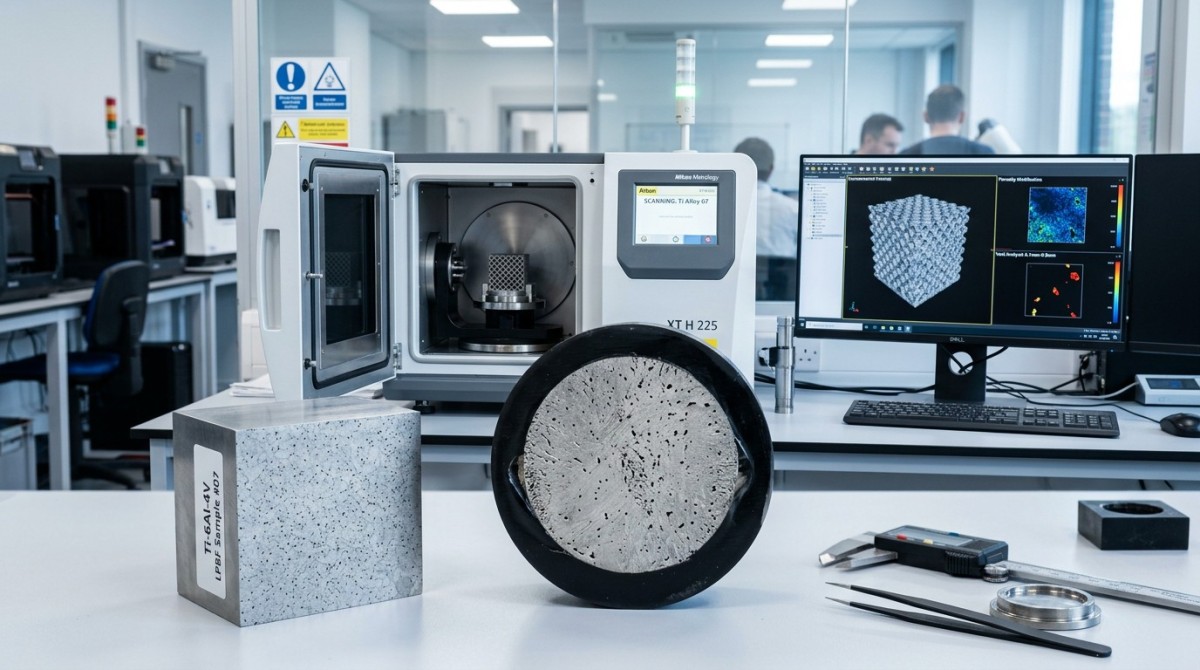
The most concerning titanium porosity test results are not always the highest total porosity percentage alone. Trouble is usually signaled by a combination of defect morphology, defect distribution, and repeatability failures across builds. In practical terms, these patterns deserve immediate escalation:
- Large isolated pores in high-stress regions, especially near surface or transition zones
- Lack-of-fusion defects with irregular or elongated shapes rather than round gas pores
- Clustered porosity concentrated in one area, layer band, or geometry feature
- Porosity trending upward across batches, even if each batch still appears “within spec”
- Build-to-build inconsistency under nominally identical machine settings
- Higher near-surface pore density, which is especially dangerous for fatigue life
- Unexpected CT-to-metallography mismatch, suggesting inspection blind spots or sampling weakness
For decision-makers, the key point is simple: a porosity report becomes a business risk when it implies unstable process control. A supplier that can produce one acceptable titanium sample but cannot hold density and pore morphology consistently across orientation, geometry, and lot changes is not yet demonstrating production-grade capability.
Why some porosity is far more dangerous than the porosity percentage suggests
Many buyers and even some technical teams make the mistake of focusing too heavily on one headline metric, such as relative density or total void fraction. That number matters, but by itself it does not predict field performance well enough.
For titanium additive manufacturing, especially in laser powder bed fusion environments, pore shape and location often matter more than raw pore volume. Small, spherical gas pores may be tolerable in some applications after proper hot isostatic pressing and finishing. In contrast, elongated lack-of-fusion defects behave like crack starters. They are particularly problematic under cyclic loading, pressure sealing requirements, or certification review.
This is why a part can show acceptable average density but still fail where it matters most:
- Fatigue-critical brackets and airframe components: near-surface or sharp-edged defects reduce fatigue resistance disproportionately
- Fluid-handling or vacuum parts: interconnected porosity can threaten leak integrity
- Medical implants: unintended pore morphology or contamination can compromise mechanical confidence and regulatory acceptance
- Thin-wall geometries: local defects consume a larger fraction of effective section thickness
In other words, “low porosity” is not the same as “low risk.” The test result becomes meaningful only when tied to service conditions, load path, finishing route, and inspection coverage.
Which defect patterns usually point to process instability rather than a one-off anomaly?
When titanium porosity results begin to show repeated patterns, the issue is usually deeper than random variation. Operators and supplier-quality teams should pay attention to whether the data points to a root cause in powder, machine condition, scan strategy, shielding gas flow, or thermal history.
Common warning patterns include:
- Layer-wise bands of porosity: often associated with recoating problems, transient energy instability, or gas flow disturbance
- Directional elongated voids: frequently linked to lack of fusion from poor melt overlap, parameter drift, or insufficient energy density
- Defects concentrated around supports, overhangs, or thick-thin transitions: often caused by local heat accumulation or unstable melt pool behavior
- Different porosity profiles by build position: may indicate chamber flow nonuniformity, optics issues, or machine calibration limits
- Porosity increase after powder reuse cycles: can signal degradation in powder quality, contamination, or particle size distribution changes
From a sourcing perspective, these are not minor technical details. They reveal whether the supplier has a mature control plan or is still relying on operator experience and selective data reporting. Serious production partners should be able to explain not just what the porosity result is, but why it occurred and how it is being controlled statistically.
How engineers and buyers should interpret porosity test methods
Not all porosity data carries the same decision value. The interpretation depends heavily on how the result was obtained.
- Computed tomography (CT): useful for volumetric defect mapping and location analysis, especially for internal structures, but detection thresholds vary with part size and scan setup
- Metallographic cross-sections: effective for pore morphology and microstructural review, but limited by sampling location and destructive nature
- Archimedes density measurement: fast and useful for broad screening, but insufficient for understanding defect type and local criticality
- Mechanical test correlation: fatigue, tensile, and leak testing often reveal whether observed porosity is actually performance-limiting
The strongest suppliers do not rely on one test alone. They build a correlation between density, CT findings, metallography, and final mechanical outcomes. That correlation is what gives procurement and leadership teams confidence that the porosity result is connected to real-world reliability rather than isolated lab data.
What acceptance thresholds make sense for aerospace, medical, and industrial titanium parts?
There is no universal porosity threshold that fits all titanium applications. Acceptance must be tied to part function, certification path, and failure consequences.
As a practical framework:
- Aerospace fatigue-loaded parts: require the strictest controls on near-surface defects, lack-of-fusion indications, and lot-to-lot consistency
- Pressure, vacuum, or sealed assemblies: need strong evidence against interconnected porosity and often benefit from leak-test correlation
- Medical components: demand both mechanical consistency and strong process traceability, especially when porosity is not intentionally designed
- General industrial parts: may tolerate more internal porosity if loads are lower and service environment is less severe, but repeatability still matters
For this reason, buyer questions should move beyond “What density do you achieve?” and toward:
- What is the maximum pore size by region?
- How do you control lack-of-fusion defects?
- What changes after HIP, machining, and surface finishing?
- How stable are results across multiple builds and powder reuse cycles?
- Can you show correlation between porosity data and fatigue or leak performance?
These questions are especially useful when comparing an industrial 3D printing service China supplier with traditional precision machining options. Machined titanium may avoid additive porosity concerns, but additive manufacturing may still deliver geometric or weight advantages if defect control is truly mature and documented.
How porosity results affect supplier qualification and commercial risk
For procurement teams and enterprise decision-makers, porosity test results are not merely a technical quality item. They influence schedule reliability, nonconformance exposure, certification readiness, and total cost of ownership.
A troubling porosity trend can create business impact in several ways:
- Longer first article approval cycles
- Higher scrap and rework rates
- More destructive validation testing
- Qualification delays for regulated sectors
- Increased warranty or field failure exposure
- Reduced confidence in scaling from prototype to serial production
This is why technically literate sourcing is critical. A supplier with slightly higher quoted price but stronger process capability, better porosity mapping discipline, and clearer statistical controls may offer lower total risk than a lower-cost source with weak inspection depth. In titanium additive manufacturing, cheap parts can become expensive very quickly if hidden porosity triggers failure investigation or requalification.
What a strong supplier response to a bad porosity result should look like
When a porosity test result fails or trends in the wrong direction, the right response is not a vague claim that the issue has been “optimized.” A credible supplier should show a structured engineering response.
Look for these elements:
- Clear defect classification: gas porosity, lack of fusion, keyhole-related, contamination-related, or post-process induced
- Root-cause analysis tied to machine, powder, and parameter history
- Containment plan: affected lots, geometries, and production windows identified
- Corrective action evidence: revised settings, maintenance action, gas flow correction, powder segregation, or recoater checks
- Validation data: repeat builds demonstrating restored stability rather than a single successful sample
- Performance correlation: fatigue, tensile, CT, or leak data showing the issue is truly resolved
This level of response separates process-driven manufacturers from marketing-driven vendors. For a platform built around engineering truth through data, that distinction matters more than broad quality claims.
Bottom line: what porosity test results truly signal trouble?
In titanium additive manufacturing, the most dangerous porosity results are those that reveal instability, not just imperfection. Large pores, elongated lack-of-fusion defects, defect clusters, near-surface concentration, and inconsistent results across builds are all stronger warning signs than an isolated average density figure. These patterns can indicate reduced fatigue life, leak risk, qualification failure, or weak production discipline.
For engineers and operators, the right next step is to connect pore morphology with process cause and service performance. For buyers and business leaders, the priority is to qualify suppliers based on repeatable data, inspection depth, and corrective-action maturity, not marketing language. When comparing industrial 3D printing service China capabilities with precision machining benchmarks, the real question is not whether a supplier can produce a good test coupon once. It is whether they can demonstrate stable titanium quality, documented porosity control, and predictable performance at production scale.
That is the threshold where porosity data stops being a lab report and becomes a reliable decision tool.
Search News
Hot Articles
- Carbon Fiber StructuresHow to Specify Aerospace Carbon Fiber Assemblies for Lightweight, Load-Bearing PartsJul 11, 2026
- Machine VisionXiaomi, Alibaba DAMO Academy Drive Open-Source Robotics Model Ecosystem, Lowering Algorithm Development Barriers for Overseas SMEs Adopting Chinese Robotics SolutionsMar 30, 2026
- Cobots & ArmsShanxi 'AI+' Conference Showcases Embodied Intelligence with Multinational Buyer Engagement: Key Industry ImplicationsMar 30, 2026
Popular Tags
Recommended News
 Jul 11, 2026How to Specify Aerospace Carbon Fiber Assemblies for Lightweight, Load-Bearing PartsAerospace carbon fiber assemblies: learn how to specify laminate design, load data, joining methods, and inspection controls for lighter, reliable load-bearing aerospace parts.Elena Rostova (UAV Systems Researcher)
 Mar 30, 2026Xiaomi, Alibaba DAMO Academy Drive Open-Source Robotics Model Ecosystem, Lowering Algorithm Development Barriers for Overseas SMEs Adopting Chinese Robotics SolutionsXiaomi & Alibaba DAMO Academy's open-source robotics models lower algorithm barriers for global SMEs. Boost efficiency in manufacturing, logistics & smart retail with ROS 2 compatible solutions.TSV Data Lab
 Mar 30, 2026Shanxi 'AI+' Conference Showcases Embodied Intelligence with Multinational Buyer Engagement: Key Industry ImplicationsShanxi 'AI+' Conference highlights embodied intelligence with Tesla, Ubtech & Jiantao showcasing multimodal robotics. 40+ global buyers validated tech on-site, creating new B2B channels for industrial automation & AI solutions.Chen Wei (Automation Lead Engineer)
 Mar 30, 2026Zhongguancun Unveils 6G Integrated Sensing-Computing-Intelligence Platform to Empower Embodied Robots for Global Industrial ApplicationsZhongguancun's new 6G platform revolutionizes industrial robotics with <10ms latency, empowering global automotive, logistics & port automation. Discover how this tech boosts China's smart manufacturing exports.TSV Data Lab
 Mar 30, 2026Mech-Mind Tianjin Embodied Intelligence R&D and Production Base Goes Live, Cutting Delivery Time by 20%–30% for Global Customized AMR+Vision SolutionsMech-Mind's Tianjin AMR+Vision production base cuts delivery time by 20%-30% for欧美 & Latin American markets. Discover how this PLd-certified facility accelerates customized robotics solutions for smart manufacturing and logistics.Chen Wei (Automation Lead Engineer)
 Mar 30, 2026Boao Forum Reveals 'Co-evolution of Big and Small Brains' Trend in Humanoid Robots, China's Embodied Intelligence Accelerates Adaptation to Overseas Manufacturing Service ScenariosDiscover how China's humanoid robots, featuring 'Co-evolution of Big and Small Brains,' are revolutionizing global manufacturing. Learn about Embodied Tian Gong 3.0's ISO compliance and overseas deployment at Boao Forum 2026.Chen Wei (Automation Lead Engineer)
 Mar 30, 2026China Railway Industrial Secures Patent for Embodied Robotics in Material Handling, Boosting High-Precision Delivery Capabilities for Overseas Infrastructure and Manufacturing ProjectsChina Railway Industrial's new patent for embodied robotics in material handling boosts high-precision delivery for global infrastructure & manufacturing. Discover how this innovation enhances logistics accuracy in automotive, rail transit & EPC projects.Chen Wei (Automation Lead Engineer)
 Oct 27, 2026GXO and Agility Robotics Expand Partnership to Accelerate US Humanoid Robot DeploymentGXO and Agility Robotics plan to expand US humanoid robot deployment with Digit 4 in early 2027. Explore warehouse automation plans, service terms and future Digit 5 upgrades.Chen Wei (Automation Lead Engineer)
 Oct 27, 2026Robotic Automation Costs: Budgeting for Equipment, Integration, and MaintenancePlan your robotics automation cost with confidence. Explore equipment, integration, and maintenance expenses, compare quotes, and build a realistic budget for better ROI.Chen Wei (Automation Lead Engineer)
 Oct 26, 2026AMAXiMAL Releases Open-Source TopMod 3D v3 With Claude AIExplore AMAXiMAL’s free, open-source TopMod 3D v3 with Claude AI assistance, topology-based modeling and plywood fabrication tools that connect complex designs to physical builds.Dr. Marcus Vance
 Oct 26, 2026Choosing a SCADA System Integrator Company: PLC Compatibility and Long-Term SupportChoose a scada system integrator company with proven PLC compatibility and reliable long-term support. Discover what to test, compare, and require before investing.Victor Lin (Chief Software Architect)
 Oct 25, 2026Hesai Leads Global ADAS Main Lidar Shipments in Yole’s 2026 ReportHesai led global ADAS main lidar shipments with a 43% share in 2025, according to Yole’s 2026 report. Explore what this ranking reveals about its automotive market position.TSV Data Lab
 Oct 25, 2026Choosing an Aerospace Materials Manufacturer: Quality and Traceability ChecksChoosing an aerospace materials manufacturer? Learn how to verify certifications, test reports, and lot traceability to qualify suppliers confidently and reduce costly sourcing risks.Dr. Marcus Vance
 Oct 24, 2026Guotai Haitong: Global Entry-Level 3D Printer Shipments Rose 39% in Q1 2026Entry-level 3D printer shipments rose 39% in Q1 2026, Guotai Haitong reports. Explore how AI, multicolor printing and print farms are shaping market growth.Dr. Marcus Vance
 Oct 24, 2026Choosing an Industrial Vision Inspection Supplier: Acceptance Tests That MatterChoose an industrial vision inspection supplier with confidence. Discover acceptance tests for defect detection, false rejects, production speed, and reliable part rejection before you buy.TSV Data Lab
 Oct 23, 2026US Navy Raises Gecko Robotics Contract Ceiling to $300M for Robotic Fleet MaintenanceUS Navy raises Gecko Robotics’ contract ceiling to $300M for Pacific Fleet robotic inspections. Explore potential opportunities for maintenance suppliers and key procurement considerations.Chen Wei (Automation Lead Engineer)
 Oct 23, 2026Choosing Industrial Sensing Systems for Global Plants: Protocol CompatibilityCompare industrial sensing systems international buyers can trust. Explore protocol compatibility, reduce integration risks, and select proven configurations for reliable global plant deployments.TSV Data Lab
 Oct 22, 2026KUKA Showcases Physical AI and iiQKA.AI Vision at NVIDIA GTC BerlinExplore KUKA’s Physical AI showcase at NVIDIA GTC Berlin and discover how iiQKA.AI Vision aims to simplify robotic vision integration and improve 2D and 3D scene recognition.TSV Data Lab
 Oct 22, 2026Robotic Machining of Advanced Composites: What Tolerances Are Achievable?Explore advanced materials machining robotics: discover what drives achievable composite tolerances and how to validate accuracy before investing in your next machining system.Dr. Marcus Vance
 Oct 21, 2026China’s Industrial Robot Exports Near RMB 10 Billion in First Nine Months of 2026China’s industrial robot exports neared RMB 10 billion in January–September 2026, with value rising faster than volume. Explore the data and what it could mean for suppliers.Chen Wei (Automation Lead Engineer)
 Oct 21, 2026Low-Latency Industrial Data Processing: Pricing and Key Cost DriversExplore industrial data latency price drivers, from edge hardware to integration and support. Learn how to compare quotes, verify performance, and avoid unnecessary costs.TSV Data Lab
 Oct 20, 2026KUKA Launches iiQKA.AI Vision to Simplify Industrial Image ProcessingKUKA iiQKA.AI Vision simplifies industrial image processing with controller-based 2D and 3D vision. Explore drag-and-drop setup for vision-guided automation.TSV Data Lab
 Oct 20, 2026Smart Industrial Edge Devices: Key Criteria for Legacy PLC IntegrationChoose smart industrial edge devices for legacy PLC integration. Discover key criteria for compatibility, data quality, security, and reliable collection without disrupting control.TSV Data Lab
 Oct 19, 2026Choosing a Radar Sensor by Application: Range, Resolution, and Field of ViewSimplify radar sensor application based product selection. Compare range, resolution, and field of view to avoid blind spots and choose with confidence. Explore the guide.TSV Data Lab