CNC milling chatter frequency analysis before surface finish drops
Publication Date
author
When surface finish starts to degrade, cnc milling chatter frequency analysis becomes the fastest path to root-cause clarity. For engineers, operators, buyers, and decision-makers comparing 5 axis cnc surface finish ra, micro machining tolerance limits, and inconel 718 tool wear rate, this guide explains how vibration signatures predict quality loss, process instability, and hidden cost before scrap rates rise.
Why chatter frequency matters before visible surface finish failure
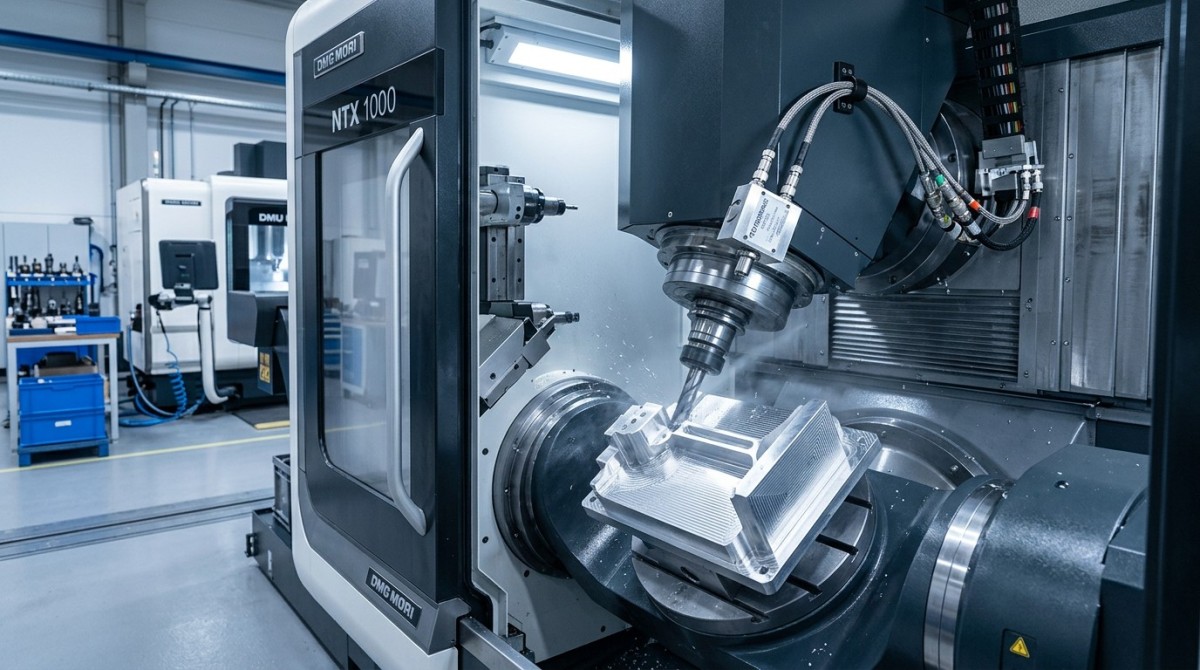
In milling, chatter is not just “noise” from the machine. It is a dynamic instability created by the interaction of spindle speed, tool geometry, workpiece stiffness, tool overhang, holder condition, feed per tooth, and regenerative vibration. By the time an operator can clearly see torn feed marks, waviness, or burr formation, the process may already have shifted from a stable cutting zone into a self-excited vibration band. That is why cnc milling chatter frequency analysis is valuable: it gives an earlier warning than surface inspection alone.
For information researchers and procurement teams, this topic matters because finish complaints are often misclassified as a tooling issue only. In reality, at least 4 core contributors usually interact: machine-tool structure, process parameters, fixturing, and material behavior. On harder alloys, thin-wall components, or long-reach 5 axis operations, a small shift in dynamic stiffness can trigger a measurable rise in vibration amplitude within minutes or across a single batch run.
For operators, the practical benefit is simple. If chatter frequency is identified before roughness moves outside the print expectation, the team can still correct spindle speed, radial engagement, stick-out, or workholding. That may prevent a 20-part lot from becoming a 20-part rework event. For decision-makers, earlier detection also reduces hidden cost in tool life loss, spindle wear, setup repetition, and delayed delivery windows of 3–7 days.
This is exactly where a data-led approach matters. TechStat Vanguard focuses on engineering truth rather than marketing adjectives. In precision machining benchmarks, the useful question is not whether a supplier claims “excellent finish,” but whether it can explain the dominant vibration band, the stable process window, and the tolerance risk when Ra, flatness, or edge integrity begin to drift.
What changes first when chatter begins
- The acoustic signature often becomes sharper or more periodic before obvious visual damage appears on the machined face.
- Spindle load can fluctuate in a repeating band instead of remaining smooth across each toolpath segment.
- Surface roughness Ra may still pass on one section, while waviness or directional patterning already indicates instability.
- Tool wear land and edge chipping can accelerate over 1–3 production cycles if the unstable zone is not corrected.
How to read cnc milling chatter frequency analysis in real shop-floor conditions
A useful chatter frequency analysis does not begin with abstract theory. It begins with the signal sources available on the machine and in the process. Shops typically work with 3 practical data inputs: accelerometers on spindle or fixture, spindle load traces from the control, and surface inspection results tied to toolpath time stamps. Even when full modal testing is not available, these three layers can reveal whether the dominant instability comes from the spindle-tool-holder chain, workpiece compliance, or a parameter mismatch.
In stable milling, vibration tends to cluster around expected tooth passing frequencies and machine harmonics with manageable amplitude. In chatter, sidebands and amplified peaks begin to appear, often near structural natural frequencies or regenerative bands. The goal is not to chase every frequency spike. The goal is to identify which peak grows as finish degrades, and whether that growth tracks spindle speed, radial width of cut, or tool engagement changes.
For a buyer evaluating a supplier, the key question is whether the supplier can convert signal data into process action. A weak answer sounds like “we reduced feed until the sound stopped.” A stronger answer includes a 4-step logic: capture the dominant band, compare it with spindle speed and flute count, test a speed shift, and verify improvement in both vibration amplitude and surface finish Ra. This process discipline matters more than generic claims about machine brand or machine age.
The table below summarizes how common shop signals relate to chatter diagnosis and what each audience should ask for during technical review, supplier qualification, or process troubleshooting.
A disciplined interpretation prevents a common error: blaming the tool alone. In many cases, a premium cutter placed in a poor holder, with excessive stick-out or weak fixture support, will still chatter. Signal context matters more than isolated component cost.
A practical 4-step diagnostic sequence
Step 1: Lock the process window
Record spindle speed, feed per tooth, radial engagement, axial depth, tool projection, holder type, coolant mode, and material lot. Without this baseline, vibration data loses meaning. Even a 5%–10% change in stick-out or radial step-over can shift dynamic response enough to confuse diagnosis.
Step 2: Match frequency to cutting event
Estimate tooth passing frequency from spindle speed and flute count, then compare it with measured peaks. If the strongest growth sits away from the expected cutting frequency and aligns with a structural resonance band, the machine-tool-workholding loop likely needs adjustment, not only parameter trimming.
Step 3: Test one change at a time
Use small controlled changes. For example, shift spindle speed, reduce overhang, or lower radial engagement, but do not alter all three at once. A 1-variable method over 2–3 trial passes produces cleaner evidence and reduces the risk of solving one problem while introducing another.
Step 4: Validate against quality and cost
The process is only improved if finish, dimensional stability, and tool life all move in the right direction. A quieter cut that doubles cycle time may not be the best business decision. Engineering truth must include throughput, scrap risk, and repeatability, not sound level alone.
Which machining scenarios show chatter earlier than others?
Not every part shows chatter in the same way. On rigid prismatic aluminum work, chatter may first appear as a cosmetic finish issue. On thin-wall aerospace features, micro-ribs, or deep cavities, the same instability can quickly become a dimensional and fatigue-risk issue. This matters to procurement because the machine or supplier that performs well on simple blocks may not hold the same stability on demanding geometries.
Five-axis finishing is especially sensitive. When the tool vector changes continuously, the effective cutter engagement, projection, and local stiffness can shift from one toolpath segment to the next. If your team is comparing 5 axis cnc surface finish ra across multiple vendors, ask whether Ra data was taken from flat easy-access zones or from the actual critical surfaces where the machine spends most of the cycle.
Material selection also changes chatter behavior. Stainless steels, titanium alloys, and Inconel 718 do not respond like free-machining aluminum. Their cutting forces, heat distribution, work-hardening tendencies, and tool wear rate can narrow the stable process window. In these cases, chatter frequency analysis helps separate thermal wear problems from structural instability, which is crucial for avoiding the wrong corrective action.
The table below compares typical scenarios where early vibration monitoring delivers the most value. It is not a ranking of industries; it is a decision aid for risk prioritization.
For supplier comparisons, this type of scenario framing is more useful than a generic capability list. A supplier should be able to explain where process stability is most likely to fail, how it monitors that risk, and what intervention window exists before parts move outside tolerance or finish expectation.
Who should care most?
- Operators who need a fast way to distinguish between harmless machine sound and quality-threatening instability.
- Process engineers responsible for keeping Ra, profile accuracy, and cycle time in balance.
- Procurement teams qualifying CNC partners for medical, aerospace, automation, or high-mix low-volume work.
- Decision-makers who need to reduce trial-and-error cost and shorten supplier validation cycles from weeks to evidence-led reviews.
What should buyers and technical teams check before approving a machining supplier?
If chatter only gets discussed after rejects appear, qualification is already too late. A better approach is to ask process-specific questions during RFQ review, first article planning, and pilot-lot approval. For complex machining projects, 5 key evaluation dimensions are usually enough: machine-tool rigidity, holder and tool control, vibration monitoring practice, finish validation method, and corrective action discipline. These are practical indicators of process maturity.
Buyers should also connect chatter risk to the commercial side. A supplier that cannot explain how it manages unstable cutting may still offer an attractive unit price, but the hidden costs appear later through longer lead times, unstable PPAP or FAI outcomes, repeated sampling, and inconsistent batch-to-batch quality. In precision programs, the cheaper quote can become the more expensive supply chain path within 2–4 deliveries.
For teams working under AS9100 or ISO 13485 environments, the issue is even more important. While these frameworks do not prescribe one vibration method for every part, they reinforce process control, traceability, risk management, and repeatable validation. Chatter analysis supports those goals by turning an unstable finish complaint into a measurable process variable rather than a subjective operator observation.
Use the checklist below when comparing suppliers, internal plants, or machining cells for high-value parts.
A procurement checklist for chatter-sensitive machining
- Ask for the stable process window, not just nominal spindle speed and feed. A capable supplier should discuss acceptable ranges, such as when radial engagement or tool projection changes.
- Request how surface finish is verified. Is the team checking only Ra, or also waviness, directional marks, edge condition, and location-specific repeatability over 3–5 parts?
- Confirm whether vibration or spindle load data can be linked to the machining event. Even a simple trace review is more useful than anecdotal comments about machine sound.
- Check the response plan when finish starts to drift. The answer should include parameter review, tool and holder inspection, fixture check, and revalidation steps.
- Evaluate the supplier’s honesty about limits. A strong partner will define where thin walls, deep cavities, micro tools, or Inconel features become higher risk and require additional control.
Common selection mistake
Many teams compare only machine count, spindle speed, and price per hour. Those are useful, but they do not reveal dynamic stability. A lower-speed but better-controlled setup can outperform a faster machine on surface finish, tool life, and delivery reliability if chatter is managed correctly.
Common misconceptions, risk signals, and what to do next
One common misconception is that chatter always sounds dramatic. In reality, some unstable cuts produce only a modest tonal change while still degrading the surface. Another misconception is that slowing the feed always fixes the problem. Sometimes reduced feed lowers cutting force, but in other cases it worsens rubbing, heat, and tool wear, especially in difficult alloys. The correct action depends on frequency behavior, not guesswork.
A second risk signal is isolated pass/fail logic. If a part passes Ra once, teams may assume the process is safe. But a process sitting near the chatter boundary can still produce variable outcomes over 5–20 parts as tools wear, fixtures settle, or ambient conditions shift. Stable production requires margin, not just one successful sample.
This is why TechStat Vanguard emphasizes benchmark thinking. Parameters do not lie; tolerances dictate success. In hard-tech supply chains, the right question is whether your machining source can quantify the boundary between stable and unstable cutting, document corrective action, and support engineering decisions with traceable data rather than promotional language.
If your team is investigating cnc milling chatter frequency analysis, comparing 5 axis cnc surface finish ra, reviewing micro machining tolerance limits, or assessing inconel 718 tool wear rate against delivery risk, an evidence-led review can shorten the path to a reliable decision.
FAQ
How early can chatter frequency analysis detect trouble?
Often before obvious finish collapse. In many shops, rising vibration amplitude, sideband growth, or unstable spindle load appears during the same setup or within the first few production pieces. The exact timing depends on the tool, material, and stiffness of the system, but it is usually earlier than relying only on visual inspection of finished parts.
Is chatter analysis only useful for aerospace-grade work?
No. It is useful anywhere surface finish, dimensional consistency, tool life, or cycle stability matters. The value grows as parts become more complex, tolerances tighten, materials harden, or rework cost rises. That includes industrial automation, medical components, energy hardware, precision fixtures, and high-mix custom manufacturing.
What is the minimum data a supplier should provide?
At minimum, ask for process parameters, finish verification method, tooling and holder details, and an explanation of how instability is recognized and corrected. If available, vibration or spindle load traces tied to the operation provide stronger confidence. The point is not to demand a laboratory report for every quote, but to confirm that process control is real and repeatable.
Why choose a data-driven advisory or benchmarking partner?
Because complex supply-chain decisions are often distorted by vague claims. TechStat Vanguard filters technical noise and focuses on measurable engineering facts: tolerance behavior, process stability, signal interpretation, and benchmark-based comparison. That helps engineering teams reduce trial-and-error cost and helps procurement teams qualify partners with clearer technical confidence.
Why work with us on machining evaluation and supplier screening
TSV supports organizations that need more than sales language. We help teams review machining risk through engineering evidence, including parameter confirmation, process capability questions, finish-risk interpretation, supplier comparison logic, and tolerance-focused decision support. Our perspective is built for R&D engineers, operators, procurement leaders, and executives who need clear answers, not hype.
You can contact us to discuss specific needs such as chatter-sensitive part review, supplier shortlisting, 5-axis finish evaluation, tool wear risk on difficult materials, sample strategy, expected delivery windows, or how to frame technical questions before RFQ release. If your goal is to reduce qualification cycles and make decisions on verifiable parameters, TSV can help structure that conversation with discipline and clarity.
Search News
Hot Articles
- Carbon Fiber StructuresHow to Specify Aerospace Carbon Fiber Assemblies for Lightweight, Load-Bearing PartsJul 11, 2026
- Machine VisionXiaomi, Alibaba DAMO Academy Drive Open-Source Robotics Model Ecosystem, Lowering Algorithm Development Barriers for Overseas SMEs Adopting Chinese Robotics SolutionsMar 30, 2026
- Cobots & ArmsShanxi 'AI+' Conference Showcases Embodied Intelligence with Multinational Buyer Engagement: Key Industry ImplicationsMar 30, 2026
Popular Tags
Recommended News
 Jul 11, 2026How to Specify Aerospace Carbon Fiber Assemblies for Lightweight, Load-Bearing PartsAerospace carbon fiber assemblies: learn how to specify laminate design, load data, joining methods, and inspection controls for lighter, reliable load-bearing aerospace parts.Elena Rostova (UAV Systems Researcher)
 Mar 30, 2026Xiaomi, Alibaba DAMO Academy Drive Open-Source Robotics Model Ecosystem, Lowering Algorithm Development Barriers for Overseas SMEs Adopting Chinese Robotics SolutionsXiaomi & Alibaba DAMO Academy's open-source robotics models lower algorithm barriers for global SMEs. Boost efficiency in manufacturing, logistics & smart retail with ROS 2 compatible solutions.TSV Data Lab
 Mar 30, 2026Shanxi 'AI+' Conference Showcases Embodied Intelligence with Multinational Buyer Engagement: Key Industry ImplicationsShanxi 'AI+' Conference highlights embodied intelligence with Tesla, Ubtech & Jiantao showcasing multimodal robotics. 40+ global buyers validated tech on-site, creating new B2B channels for industrial automation & AI solutions.Chen Wei (Automation Lead Engineer)
 Mar 30, 2026Zhongguancun Unveils 6G Integrated Sensing-Computing-Intelligence Platform to Empower Embodied Robots for Global Industrial ApplicationsZhongguancun's new 6G platform revolutionizes industrial robotics with <10ms latency, empowering global automotive, logistics & port automation. Discover how this tech boosts China's smart manufacturing exports.TSV Data Lab
 Mar 30, 2026Mech-Mind Tianjin Embodied Intelligence R&D and Production Base Goes Live, Cutting Delivery Time by 20%–30% for Global Customized AMR+Vision SolutionsMech-Mind's Tianjin AMR+Vision production base cuts delivery time by 20%-30% for欧美 & Latin American markets. Discover how this PLd-certified facility accelerates customized robotics solutions for smart manufacturing and logistics.Chen Wei (Automation Lead Engineer)
 Mar 30, 2026Boao Forum Reveals 'Co-evolution of Big and Small Brains' Trend in Humanoid Robots, China's Embodied Intelligence Accelerates Adaptation to Overseas Manufacturing Service ScenariosDiscover how China's humanoid robots, featuring 'Co-evolution of Big and Small Brains,' are revolutionizing global manufacturing. Learn about Embodied Tian Gong 3.0's ISO compliance and overseas deployment at Boao Forum 2026.Chen Wei (Automation Lead Engineer)
 Mar 30, 2026China Railway Industrial Secures Patent for Embodied Robotics in Material Handling, Boosting High-Precision Delivery Capabilities for Overseas Infrastructure and Manufacturing ProjectsChina Railway Industrial's new patent for embodied robotics in material handling boosts high-precision delivery for global infrastructure & manufacturing. Discover how this innovation enhances logistics accuracy in automotive, rail transit & EPC projects.Chen Wei (Automation Lead Engineer)
 Oct 27, 2026GXO and Agility Robotics Expand Partnership to Accelerate US Humanoid Robot DeploymentGXO and Agility Robotics plan to expand US humanoid robot deployment with Digit 4 in early 2027. Explore warehouse automation plans, service terms and future Digit 5 upgrades.Chen Wei (Automation Lead Engineer)
 Oct 27, 2026Robotic Automation Costs: Budgeting for Equipment, Integration, and MaintenancePlan your robotics automation cost with confidence. Explore equipment, integration, and maintenance expenses, compare quotes, and build a realistic budget for better ROI.Chen Wei (Automation Lead Engineer)
 Oct 26, 2026AMAXiMAL Releases Open-Source TopMod 3D v3 With Claude AIExplore AMAXiMAL’s free, open-source TopMod 3D v3 with Claude AI assistance, topology-based modeling and plywood fabrication tools that connect complex designs to physical builds.Dr. Marcus Vance
 Oct 26, 2026Choosing a SCADA System Integrator Company: PLC Compatibility and Long-Term SupportChoose a scada system integrator company with proven PLC compatibility and reliable long-term support. Discover what to test, compare, and require before investing.Victor Lin (Chief Software Architect)
 Oct 25, 2026Hesai Leads Global ADAS Main Lidar Shipments in Yole’s 2026 ReportHesai led global ADAS main lidar shipments with a 43% share in 2025, according to Yole’s 2026 report. Explore what this ranking reveals about its automotive market position.TSV Data Lab
 Oct 25, 2026Choosing an Aerospace Materials Manufacturer: Quality and Traceability ChecksChoosing an aerospace materials manufacturer? Learn how to verify certifications, test reports, and lot traceability to qualify suppliers confidently and reduce costly sourcing risks.Dr. Marcus Vance
 Oct 24, 2026Guotai Haitong: Global Entry-Level 3D Printer Shipments Rose 39% in Q1 2026Entry-level 3D printer shipments rose 39% in Q1 2026, Guotai Haitong reports. Explore how AI, multicolor printing and print farms are shaping market growth.Dr. Marcus Vance
 Oct 24, 2026Choosing an Industrial Vision Inspection Supplier: Acceptance Tests That MatterChoose an industrial vision inspection supplier with confidence. Discover acceptance tests for defect detection, false rejects, production speed, and reliable part rejection before you buy.TSV Data Lab
 Oct 23, 2026US Navy Raises Gecko Robotics Contract Ceiling to $300M for Robotic Fleet MaintenanceUS Navy raises Gecko Robotics’ contract ceiling to $300M for Pacific Fleet robotic inspections. Explore potential opportunities for maintenance suppliers and key procurement considerations.Chen Wei (Automation Lead Engineer)
 Oct 23, 2026Choosing Industrial Sensing Systems for Global Plants: Protocol CompatibilityCompare industrial sensing systems international buyers can trust. Explore protocol compatibility, reduce integration risks, and select proven configurations for reliable global plant deployments.TSV Data Lab
 Oct 22, 2026KUKA Showcases Physical AI and iiQKA.AI Vision at NVIDIA GTC BerlinExplore KUKA’s Physical AI showcase at NVIDIA GTC Berlin and discover how iiQKA.AI Vision aims to simplify robotic vision integration and improve 2D and 3D scene recognition.TSV Data Lab
 Oct 22, 2026Robotic Machining of Advanced Composites: What Tolerances Are Achievable?Explore advanced materials machining robotics: discover what drives achievable composite tolerances and how to validate accuracy before investing in your next machining system.Dr. Marcus Vance
 Oct 21, 2026China’s Industrial Robot Exports Near RMB 10 Billion in First Nine Months of 2026China’s industrial robot exports neared RMB 10 billion in January–September 2026, with value rising faster than volume. Explore the data and what it could mean for suppliers.Chen Wei (Automation Lead Engineer)
 Oct 21, 2026Low-Latency Industrial Data Processing: Pricing and Key Cost DriversExplore industrial data latency price drivers, from edge hardware to integration and support. Learn how to compare quotes, verify performance, and avoid unnecessary costs.TSV Data Lab
 Oct 20, 2026KUKA Launches iiQKA.AI Vision to Simplify Industrial Image ProcessingKUKA iiQKA.AI Vision simplifies industrial image processing with controller-based 2D and 3D vision. Explore drag-and-drop setup for vision-guided automation.TSV Data Lab
 Oct 20, 2026Smart Industrial Edge Devices: Key Criteria for Legacy PLC IntegrationChoose smart industrial edge devices for legacy PLC integration. Discover key criteria for compatibility, data quality, security, and reliable collection without disrupting control.TSV Data Lab
 Oct 19, 2026Choosing a Radar Sensor by Application: Range, Resolution, and Field of ViewSimplify radar sensor application based product selection. Compare range, resolution, and field of view to avoid blind spots and choose with confidence. Explore the guide.TSV Data Lab