How to choose a real time operating system RTOS benchmark
Publication Date
author
Choosing a real time operating system RTOS benchmark is not about chasing vendor claims—it is about identifying measurable criteria that reflect real engineering constraints, from interrupt latency and task switching to determinism under load. For technical evaluators, a reliable benchmark framework turns noisy specifications into actionable evidence, helping teams compare platforms with confidence and align RTOS selection with performance, risk, and long-term system requirements.
In industrial control, robotics, UAV avionics, edge AI gateways, and precision equipment, an RTOS decision can shape system stability for 5 to 10 years. A weak benchmark often leads to hidden integration costs, missed deadlines, or unsafe timing behavior under peak load. A strong benchmark, by contrast, turns selection into an engineering exercise based on repeatable tests, acceptance thresholds, and traceable decision logic.
For technical evaluation teams, the goal is not to find a universally “best” kernel. The goal is to identify the RTOS that fits a defined workload, processor class, certification path, middleware stack, and lifecycle support model. That is especially important when procurement, R&D, and systems engineering must align around the same data set.
Why an RTOS benchmark matters in real engineering programs
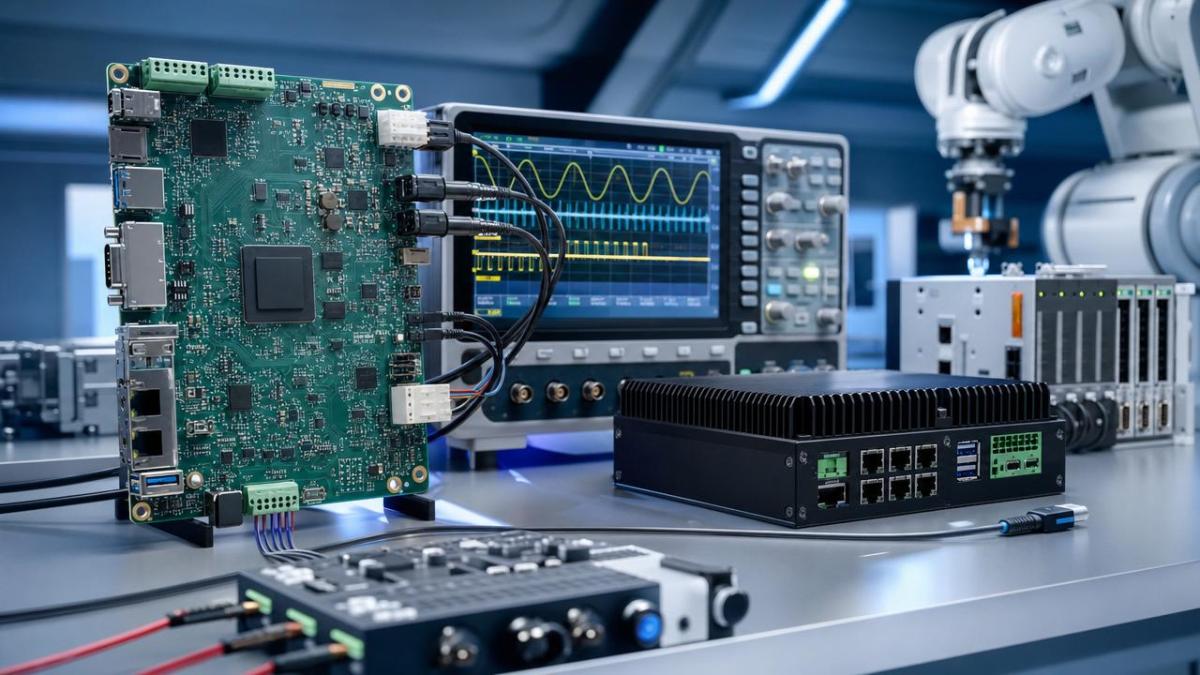
A real time operating system RTOS benchmark matters because timing numbers on a datasheet rarely reflect deployed behavior. An interrupt latency of 3 microseconds in an empty test loop may become 12 to 25 microseconds once drivers, networking, file systems, and telemetry threads are active. For systems with 1 kHz, 10 kHz, or even 100 kHz control loops, that difference is material.
Technical evaluators in hard-tech environments also need to separate average performance from worst-case performance. Averages are useful for throughput planning, but worst-case execution time, maximum scheduling jitter, and overload recovery are what determine whether a robot arm holds tolerance, whether a flight controller remains stable, or whether an edge device keeps deterministic I/O behavior.
Common failure points when teams skip benchmarking
- Selection based on marketing claims rather than test reproducibility
- Ignoring ISR load, DMA traffic, and network stack contention
- Measuring only idle-state latency instead of loaded-state determinism
- Overlooking memory footprint on MCUs with 256 KB to 2 MB RAM
- Failing to include toolchain, BSP maturity, and driver quality in scoring
In TSV-style evaluation logic, parameters must be tied to use cases. A medical device controller, an AGV navigation node, and an industrial gateway may all require an RTOS, but their benchmark priorities differ. One may prioritize certification artifacts, another may prioritize Ethernet stack predictability, and a third may prioritize low-power wake-up latency below 100 microseconds.
The benchmark should answer four practical questions
- Can the RTOS meet timing targets under realistic load?
- Does it scale across the chosen CPU, memory, and peripheral profile?
- Are debugging, maintenance, and updates manageable over a 3 to 7 year lifecycle?
- Does the platform reduce technical and procurement risk rather than shifting it downstream?
Core metrics to include in a real time operating system RTOS benchmark
The most useful benchmark frameworks combine timing, resource, and integration metrics. Evaluators should avoid overfocusing on a single headline number. A system with slightly higher context switch time may still be superior if its jitter remains tighter, memory behavior cleaner, and tooling more mature during integration.
Timing and determinism metrics
At minimum, measure interrupt latency, task switch latency, semaphore handoff time, timer accuracy, scheduling jitter, and worst-case response time. Each metric should be captured in at least 3 states: idle, nominal load at roughly 50 to 70 percent CPU use, and stress load above 85 percent. If SMP is involved, add cross-core wake-up and lock contention measurements.
Recommended baseline measurement set
The table below shows a practical baseline for technical evaluators building an RTOS comparison matrix for embedded and industrial programs.
The key conclusion is that timing data must always be paired with load context. A good real time operating system RTOS benchmark reports not just one result, but a curve of behavior across different operating conditions.
Resource and integration metrics
Beyond latency, evaluators should document RAM footprint, ROM footprint, idle CPU overhead, scheduler scalability, driver compatibility, middleware availability, and trace/debug visibility. For many industrial projects, a 15 to 20 percent memory margin is a practical minimum. If the RTOS consumes too much memory early, future features become difficult to add without board redesign.
Integration quality often decides the real cost of ownership. BSP readiness, network stack maturity, file system stability, and documentation quality can cut bring-up time from 8 weeks to 3 weeks. That is not just a software concern; it affects validation schedules, procurement timing, and supplier qualification.
How to design a benchmark methodology that technical evaluators can trust
A benchmark is credible only if it is reproducible. That means fixing the processor, clock rate, compiler version, optimization flags, memory layout, peripheral configuration, and workload profile. If one RTOS is tested with aggressive compiler optimization and another is not, the comparison is already compromised.
Build three test layers
The most reliable framework uses three layers: microbenchmarks, workload benchmarks, and system-level validation. Microbenchmarks isolate core kernel behavior. Workload benchmarks simulate real application pressure, such as fieldbus traffic, sensor acquisition, and logging. System-level validation confirms that end-to-end deadlines are met for at least 24 to 72 hours without drift, starvation, or unexpected resets.
A practical 5-step process
- Define application deadlines, for example 100 microseconds, 1 millisecond, and 10 milliseconds.
- Select identical hardware and compiler conditions across all candidates.
- Run idle, nominal, and peak-load scenarios with at least 3 repeated test cycles.
- Capture worst-case, 99th percentile, and average results for each metric.
- Score results against weighted business priorities such as safety, integration speed, and support lifecycle.
This method helps technical evaluators translate low-level measurements into sourcing decisions. If two RTOS options differ by only 2 microseconds in task switching, but one has stronger trace tooling and lower porting effort, the benchmark may reasonably favor the more maintainable option.
Control variables that often distort results
Several factors can distort a real time operating system RTOS benchmark: cache settings, interrupt nesting, DMA bursts, logging overhead, debug probe interference, and thermal throttling on higher-end processors. Teams should also note whether measurements are taken using GPIO toggling, hardware trace, cycle counters, or software timestamps, because method choice directly affects precision.
The table below summarizes a robust decision framework that combines pure performance data with operational realities relevant to B2B engineering teams.
The main takeaway is that benchmark methodology should mirror deployment reality. Raw speed matters, but timing predictability, engineering effort, and support continuity often decide total program value.
Selection criteria by application scenario
Different sectors require different benchmark emphases. A generic score can be misleading if it ignores domain-specific constraints. Technical evaluators should map benchmark weights to the actual operating environment and risk profile.
Industrial automation and robotics
In robotics and automation, scheduling stability, fieldbus stack behavior, and fault recovery usually dominate. A motion node may require sub-millisecond cyclic control, while a vision-assisted edge controller may tolerate a few milliseconds but require stronger network throughput and multicore load balancing. In these systems, measure jitter during concurrent servo control, safety monitoring, and diagnostics traffic.
UAV, aerospace, and safety-sensitive platforms
For airborne and mission-critical applications, deterministic response is only part of the picture. Evaluators should also review partitioning support, fault isolation behavior, traceability, and evidence packages needed for certification-aligned development. Even if final certification is handled at system level, early benchmark data can flag whether the RTOS architecture is suitable for higher-assurance workflows.
Sensors, gateways, and edge AI devices
For sensor fusion and edge gateways, the benchmark should include network bursts, storage writes, and mixed-priority threading. Here, it is common to measure queue latency under 1,000 to 50,000 messages per second, plus CPU impact from encryption, compression, or AI inference scheduling. The RTOS must preserve predictable response even when data paths are busy.
Frequent benchmark mistakes and how to avoid them
One common mistake is comparing RTOS kernels on different hardware abstraction layers. Another is measuring only synthetic loop performance without validating application deadlines. A third is ignoring maintainability. The fastest result on day 1 may become the most expensive platform by month 18 if diagnostics, updates, or driver changes are difficult to manage.
Checklist for technical evaluators
- Use identical board, clock, compiler, and optimization settings
- Record worst-case and percentile timing, not only averages
- Test under realistic CPU, I/O, and network contention
- Include memory footprint and debug tooling in the scorecard
- Document pass/fail thresholds before testing begins
- Review support horizon, update policy, and vendor responsiveness
A disciplined real time operating system RTOS benchmark reduces ambiguity during supplier comparison and platform approval. It also improves communication between engineering, sourcing, and leadership because the decision is anchored in measurable trade-offs rather than preference or brand familiarity.
Turning benchmark data into a defensible procurement decision
Once tests are complete, teams should convert results into a weighted decision matrix. Many organizations use 4 to 6 categories, with weights such as 35 percent determinism, 25 percent integration effort, 20 percent lifecycle support, and 20 percent resource efficiency. The exact weighting depends on whether program risk is driven by timing failure, certification burden, or long-term maintenance cost.
This is where a benchmark becomes commercially useful. It supports specification writing, supplier review, design freeze decisions, and future auditability. When stakeholders ask why a particular RTOS was selected, the team can point to repeatable measurements, documented thresholds, and scenario-specific rationale.
For organizations operating in data-sensitive, performance-critical markets, the strongest selection process is one that filters noise and exposes engineering truth. If your team is defining an RTOS evaluation framework for automation, aerospace, sensor, or edge systems, now is the time to structure the benchmark around measurable constraints and lifecycle realities. Contact TSV to discuss a customized benchmark methodology, compare platform options, and get a clearer path from raw technical data to confident system selection.
Search News
Hot Articles
- Carbon Fiber StructuresHow to Specify Aerospace Carbon Fiber Assemblies for Lightweight, Load-Bearing PartsJul 11, 2026
- Machine VisionXiaomi, Alibaba DAMO Academy Drive Open-Source Robotics Model Ecosystem, Lowering Algorithm Development Barriers for Overseas SMEs Adopting Chinese Robotics SolutionsMar 30, 2026
- Cobots & ArmsShanxi 'AI+' Conference Showcases Embodied Intelligence with Multinational Buyer Engagement: Key Industry ImplicationsMar 30, 2026
Popular Tags
Recommended News
 Jul 11, 2026How to Specify Aerospace Carbon Fiber Assemblies for Lightweight, Load-Bearing PartsAerospace carbon fiber assemblies: learn how to specify laminate design, load data, joining methods, and inspection controls for lighter, reliable load-bearing aerospace parts.Elena Rostova (UAV Systems Researcher)
 Mar 30, 2026Xiaomi, Alibaba DAMO Academy Drive Open-Source Robotics Model Ecosystem, Lowering Algorithm Development Barriers for Overseas SMEs Adopting Chinese Robotics SolutionsXiaomi & Alibaba DAMO Academy's open-source robotics models lower algorithm barriers for global SMEs. Boost efficiency in manufacturing, logistics & smart retail with ROS 2 compatible solutions.TSV Data Lab
 Mar 30, 2026Shanxi 'AI+' Conference Showcases Embodied Intelligence with Multinational Buyer Engagement: Key Industry ImplicationsShanxi 'AI+' Conference highlights embodied intelligence with Tesla, Ubtech & Jiantao showcasing multimodal robotics. 40+ global buyers validated tech on-site, creating new B2B channels for industrial automation & AI solutions.Chen Wei (Automation Lead Engineer)
 Mar 30, 2026Zhongguancun Unveils 6G Integrated Sensing-Computing-Intelligence Platform to Empower Embodied Robots for Global Industrial ApplicationsZhongguancun's new 6G platform revolutionizes industrial robotics with <10ms latency, empowering global automotive, logistics & port automation. Discover how this tech boosts China's smart manufacturing exports.TSV Data Lab
 Mar 30, 2026Mech-Mind Tianjin Embodied Intelligence R&D and Production Base Goes Live, Cutting Delivery Time by 20%–30% for Global Customized AMR+Vision SolutionsMech-Mind's Tianjin AMR+Vision production base cuts delivery time by 20%-30% for欧美 & Latin American markets. Discover how this PLd-certified facility accelerates customized robotics solutions for smart manufacturing and logistics.Chen Wei (Automation Lead Engineer)
 Mar 30, 2026Boao Forum Reveals 'Co-evolution of Big and Small Brains' Trend in Humanoid Robots, China's Embodied Intelligence Accelerates Adaptation to Overseas Manufacturing Service ScenariosDiscover how China's humanoid robots, featuring 'Co-evolution of Big and Small Brains,' are revolutionizing global manufacturing. Learn about Embodied Tian Gong 3.0's ISO compliance and overseas deployment at Boao Forum 2026.Chen Wei (Automation Lead Engineer)
 Mar 30, 2026China Railway Industrial Secures Patent for Embodied Robotics in Material Handling, Boosting High-Precision Delivery Capabilities for Overseas Infrastructure and Manufacturing ProjectsChina Railway Industrial's new patent for embodied robotics in material handling boosts high-precision delivery for global infrastructure & manufacturing. Discover how this innovation enhances logistics accuracy in automotive, rail transit & EPC projects.Chen Wei (Automation Lead Engineer)
 Oct 11, 2026How Procurement-Oriented Content Taxonomy Improves B2B Buying JourneysProcurement-oriented content taxonomy streamlines B2B buying journeys with clearer evidence, supplier comparisons, risk visibility, and faster approvals.TSV Data Lab
 Oct 10, 2026How to Select a Machine Performance Monitoring Platform for OEE and Downtime ReductionMachine performance monitoring platform selection guide: validate machine states, OEE data, downtime reasons, integrations, and scalability to reduce losses with confidence.TSV Data Lab
 Oct 08, 2026How to Machine Inconel 625 Blades Without Heat Cracks or Edge ChippingInconel 625 blade machining guide: prevent heat cracks, edge chipping, chatter, and work hardening with proven tooling, cooling, fixturing, and inspection strategies.Dr. Marcus Vance
 Oct 07, 2026How to Evaluate an HMI Panel Distributor for Industrial Automation ProjectsHMI panel distributor evaluation guide: verify technical compatibility, traceability, supply reliability, lifecycle support, and total cost for automation projects.Victor Lin (Chief Software Architect)
 Oct 06, 2026Navigation Fault Tolerance Standards for AMRs: What Safety Teams Must VerifyNavigation fault tolerance standards: learn what AMR safety teams must verify, from localization loss and sensor faults to stopping distance, safe restart, and site-specific validation.Chen Wei (Automation Lead Engineer)
 Oct 05, 2026Calculating Edge Computing Total Cost of Ownership Across Distributed SitesEdge computing ownership cost explained: calculate deployment, energy, connectivity, security, remote support, and refresh costs across distributed sites.TSV Data Lab
 Oct 04, 2026CAD/CAM Benchmarking in the GCC: What Manufacturers Should Ask a ConsultantCAD CAM benchmark consultant GCC guide: learn the key questions manufacturers should ask to validate post-processors, workflows, machine performance, and production risk.Victor Lin (Chief Software Architect)
 Oct 03, 2026Selecting Automotive Radar Sensor Modules for ADAS Range, Resolution, and IntegrationAutomotive radar sensor module selection guide for ADAS: compare range, resolution, field of view, latency, and integration to build safer, reliable vehicle systems.TSV Data Lab
 Oct 02, 2026How to Qualify Machined Parts Suppliers for Hard Tech ProgramsHard tech supply chain machined parts demand rigorous supplier qualification. Learn how to assess capability, traceability, quality controls, and delivery resilience.Dr. Marcus Vance
 Oct 01, 2026How to Select an Outdoor Security Radar Sensor for Perimeter Detection?Outdoor security radar sensor selection guide: compare range, accuracy, false-alarm control, integration, and field testing for reliable perimeter detection.TSV Data Lab
 Sep 30, 2026How to Evaluate Solid-State LiDAR Hardware for Outdoor Autonomous VehiclesSolid state LiDAR hardware evaluation guide for outdoor autonomous vehicles—compare range, point-cloud quality, environmental resilience, integration, and safety.TSV Data Lab
 Sep 29, 2026ISO 9283 Repeatability: How to Evaluate Cobot Positioning PerformanceISO 9283 cobot repeatability explained: learn how payload, reach, approach direction, and test conditions affect positioning performance and cell capability.Chen Wei (Automation Lead Engineer)
 Oct 10, 2026When does the cost of industrial robots pay back in high-volume production?Cost of industrial robots: discover how high-volume manufacturers calculate payback through uptime, cycle time, labor, quality, and integration before investing.Chen Wei (Automation Lead Engineer)
 Oct 09, 2026What does a manufacturing robot really cost beyond the purchase price?Manufacturing robot cost goes far beyond the purchase price. Explore integration, tooling, safety, uptime, and total ownership factors for smarter automation investments.Chen Wei (Automation Lead Engineer)
 Oct 08, 2026AGV vs. AMR: Which Is Better for Frequently Changing Routes?Which is better for changing routes? Compare AGVs and AMRs for flexible navigation, docking precision, traffic control, and faster facility reconfiguration.Chen Wei (Automation Lead Engineer)
 Oct 07, 2026How Much Does an Automated Guided Vehicle Cost in 2026?How much does an automated guided vehicle cost in 2026? Explore AGV price ranges, hidden deployment costs, and smart buying factors for stronger ROI.Chen Wei (Automation Lead Engineer)
 Oct 06, 2026Are Collaborative Robots Safe Enough to Operate Without Fencing?Are collaborative robots safe enough to work without fencing? Explore risk assessment, safeguarding options, and practical guidance for safer, productive cobot cells.Chen Wei (Automation Lead Engineer)