VTOL transition phase aerodynamics explained simply
Publication Date
author
The VTOL transition phase aerodynamics is where many hybrid aircraft succeed or fail, especially in missions like vtol drone for pipeline inspection where stability, efficiency, and control matter most. This guide explains vtol transition phase aerodynamics in simple terms, helping engineers, operators, buyers, and decision-makers understand the airflow, thrust shifts, and design trade-offs that shape real-world UAV performance.
For R&D teams, the transition phase is not just a flight event lasting 2 to 15 seconds. It is the point where lift moves from rotors to wings, control authority changes, and power demand can spike if the aircraft is poorly tuned. For operators and procurement teams, this phase often determines whether a platform can deliver repeatable missions in crosswinds, carry usable payloads, and maintain safe margins over long inspection corridors.
At TechStat Vanguard, the practical question is simple: which aerodynamic and system parameters actually matter when evaluating a VTOL UAV? Instead of relying on broad claims, decision-makers should focus on stall margin, thrust-to-weight ratio, wing loading, control transition logic, and energy efficiency under real operating conditions. Those variables say far more about mission success than generic marketing language.
What the VTOL transition phase really means in flight
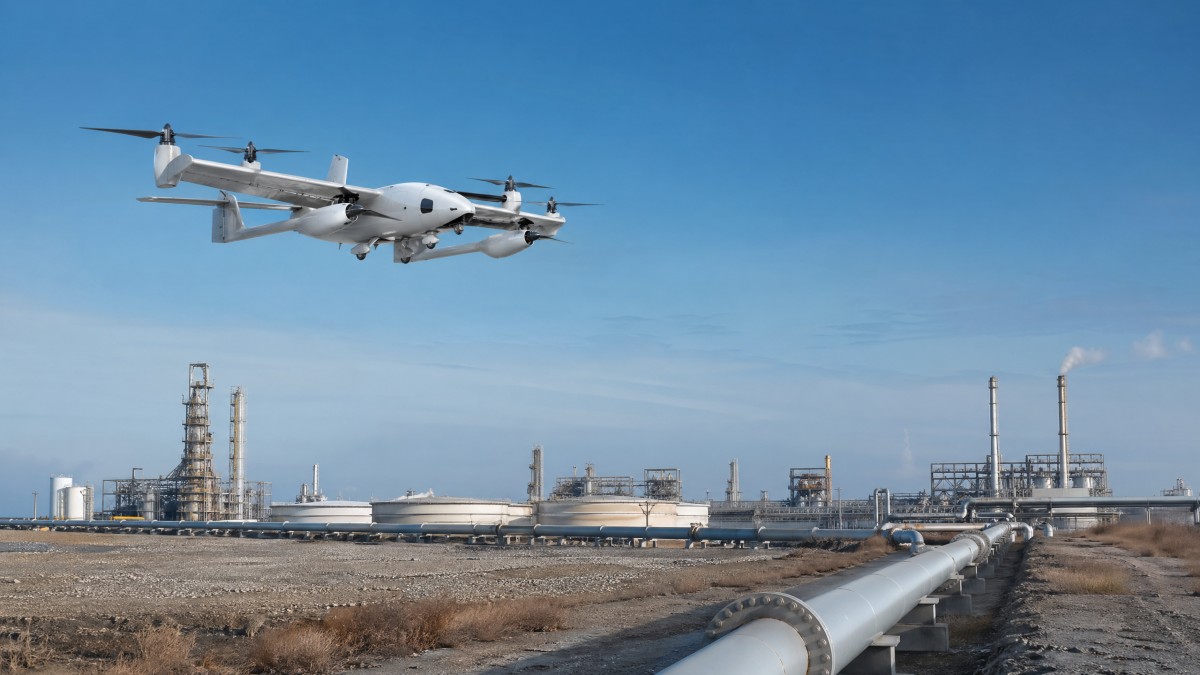
A VTOL aircraft has two basic flight states. In hover, the rotors produce nearly all the lift. In forward flight, the wings carry most of the aircraft weight and the propulsion system mainly provides thrust. The transition phase is the bridge between those states. During this interval, the aircraft must change its angle, speed, and lift distribution without losing stability.
In simple terms, the airframe is trying to do three things at once: reduce vertical lift dependence, build enough forward airspeed for the wings, and keep pitch, roll, and yaw under control. If any one of those three lags behind the others, the vehicle can experience sink rate, wing drop, oscillation, or excessive power draw. That is why transition is often the hardest part of hybrid UAV design.
For a typical fixed-wing VTOL drone, safe wing-borne flight may require around 12 to 20 m/s of airspeed, depending on wing loading and airfoil choice. If the aircraft begins reducing rotor lift before reaching that speed band, the wing may not yet generate enough lift. If it keeps too much rotor support for too long, battery consumption rises and thermal stress increases on motors and ESCs.
Why this matters for real operations
In pipeline inspection, powerline surveying, and corridor mapping, missions often involve repeated climbs, waypoint turns, and return-to-hover landing events. That means transition is not a rare edge case. A drone flying a 40 km inspection route may only transition twice, but each transition carries a high portion of the total mission risk because it happens near launch, recovery, and low-altitude airspace.
Buyers evaluating UAV platforms should therefore ask whether the aircraft has been tested in 5 to 8 m/s crosswinds, at multiple payload points, and under different center-of-gravity positions. Transition that looks smooth at 0 kg payload extension may become unstable when carrying a gimbal, LiDAR pod, or methane sensor package. Small parameter shifts can create large handling differences.
Core forces acting during transition
- Rotor thrust decreases from near-full vertical support to partial or minimal lift contribution.
- Wing lift increases rapidly as airspeed rises through the stall margin and into efficient cruise range.
- Pitch attitude changes, often by 10 to 30 degrees depending on configuration and control logic.
- Drag can peak temporarily because both rotor-induced flow and airframe drag are high at the same time.
The practical takeaway is straightforward: transition aerodynamics is the management of timing. Good designs coordinate thrust, airflow, and attitude so lift transfer happens smoothly. Poor designs force the flight controller to fight the airframe, which raises energy use and reduces safety margin.
The airflow changes that make transition difficult
During hover, the wing may sit inside disturbed rotor wash. That flow is energetic but uneven. As the aircraft pitches forward, the wing starts to see a combination of propwash and free-stream air. This mixed airflow can create local lift differences across the span, especially on designs where lift rotors are mounted close to the wing leading edge or near the tips.
The tail also experiences changing conditions. At low forward speed, the horizontal and vertical stabilizers may have weak authority unless they are deliberately placed in propeller slipstream. As speed rises from roughly 5 m/s to 15 m/s, tail effectiveness usually increases, but only if the airflow remains clean. Wake interference from wings, rotors, or booms can delay or distort that control response.
One common misunderstanding is that more rotors always make transition easier. More lift points can improve redundancy, but they can also create more interference zones. Rotor downwash interacting with wing surfaces can raise drag and alter pressure distribution. Engineers often need CFD analysis, wind tunnel testing, or flight-test correlation to confirm whether the rotor placement helps or hurts the lift transfer process.
Typical aerodynamic trouble zones
The table below summarizes where airflow-related instability usually appears and what teams should monitor during design reviews or supplier evaluation.
For buyers, the most important conclusion is that transition performance depends on interaction effects, not isolated specifications. A supplier may present strong motor thrust data and a capable wing design, yet still deliver poor transition if aerodynamic interference has not been resolved. Integrated testing matters more than any single brochure number.
Signals of a mature aerodynamic design
- Stable pitch rate through the full transition window rather than abrupt nose-up or nose-down corrections.
- Motor current peaks staying within predictable thermal limits during a 20 to 30 second climb-and-transition sequence.
- No major roll asymmetry when exposed to moderate crosswinds or small payload imbalance.
- Repeatable transition altitude loss kept within a defined range, such as less than 5 to 15 meters for a given mission class.
These are the kinds of measurable indicators that separate engineering truth from generic claims. In mission-critical UAV procurement, repeatability is often more valuable than a slightly higher top speed or a nominal endurance figure measured under ideal conditions.
Design trade-offs: tilt-rotor, tilt-wing, and lift-plus-cruise systems
Different VTOL architectures solve transition in different ways. A tilt-rotor system rotates the propulsion units from vertical to horizontal thrust. A tilt-wing rotates most or all of the wing itself, keeping propellers aligned with the local airflow. A lift-plus-cruise design uses dedicated vertical lift rotors and a separate forward propulsion system. Each architecture shifts risk between mechanics, aerodynamics, and control software.
Tilt-rotor designs can be very efficient in cruise because the same propulsors support both flight modes. However, they often demand tight control of rotor angle, pitch rate, and structural stiffness. Even a few degrees of mismatch between left and right tilt mechanisms can affect roll stability. Maintenance teams should also note that moving assemblies add inspection requirements over 100, 200, or 500 flight-hour intervals.
Lift-plus-cruise systems are common in commercial UAV markets because they simplify the mechanical architecture. The wing can be optimized for forward flight while lift rotors focus only on takeoff and landing. The trade-off is extra mass and drag, since the vertical lift hardware becomes dead weight in cruise. For long-endurance inspection work, this can reduce useful energy efficiency by several percentage points.
Architecture comparison for procurement and operations
The right configuration depends on payload, route length, maintenance capacity, and acceptable risk during transition. The table below provides a practical comparison framework.
There is no universal winner. In procurement terms, the best design is the one that maintains stable transition across the intended payload range, wind envelope, and maintenance reality of the operator. A remote utility operator with limited field support may favor a less efficient but easier-to-service airframe over a mechanically advanced platform with tighter tolerance demands.
Questions buyers should ask suppliers
- What is the validated transition speed range at minimum and maximum takeoff mass?
- How much altitude is typically lost during transition in 0 m/s, 5 m/s, and 8 m/s wind conditions?
- What component inspections are required every 50, 100, or 200 flight hours?
- Has the platform been tested with the exact payload class required for corridor inspection or sensing missions?
Those questions reveal maturity quickly. If a vendor can only describe transition qualitatively, engineering risk remains high. If they can explain the test envelope, failure modes, and maintenance intervals clearly, the platform is more likely to be suitable for professional deployment.
Control logic, sensors, and the operating envelope
Aerodynamics alone does not determine transition success. The flight controller must decide when to reduce hover thrust, when to trust aerodynamic surfaces, and how aggressively to command pitch and acceleration. These decisions depend on sensor quality, filtering, redundancy, and software logic. In practice, transition is an aero-controls problem as much as a pure airframe problem.
Most robust systems monitor airspeed, IMU data, GPS velocity, attitude rates, motor current, and sometimes angle-of-attack estimates. If the aircraft waits for one noisy sensor to cross a threshold, transition can become late or unstable. Mature designs often use multiple conditions, such as minimum airspeed plus stable pitch rate plus acceptable climb or sink rate, before reducing vertical rotor authority.
For operators, this means that flight software version control matters. Two aircraft with identical hardware can behave differently if gains, transition schedules, or fail-safe logic differ. Procurement teams should therefore include software configuration transparency in acceptance reviews, especially for fleets larger than 5 to 20 units where consistency becomes a major cost factor.
Common control risks during transition
- Premature rotor unloading before wing lift is sufficient, causing sink or stall risk.
- Overly conservative transition logic, leading to unnecessary energy burn and reduced endurance.
- Gain settings tuned for one payload but unstable with another payload 10% to 20% heavier.
- Crosswind correction that saturates roll authority during low-speed forward acceleration.
A practical operating checklist
Before field deployment, operators should verify at least four items: center of gravity, payload mounting rigidity, battery state and voltage sag profile, and environmental wind limits. A center-of-gravity shift of only a few percent of mean aerodynamic chord can change pitch trim noticeably. That may not matter in cruise, but it can matter a great deal when the aircraft is trying to transfer lift smoothly.
It is also wise to define operating envelopes in formal documents. For example, a company may allow automatic transition only below 8 m/s steady wind, below 12 m/s gust, and within a temperature band such as -10°C to 40°C. These are not arbitrary limits. They create repeatability, protect hardware life, and reduce mission variation between crews and sites.
From a fleet management perspective, transition-related data logging should include timestamped airspeed, pitch angle, current draw, and altitude change. A 10-second transition event can reveal whether a platform is gradually drifting out of tune. This is especially useful for infrastructure operators who run the same route weekly or monthly and need predictable aircraft behavior over long service cycles.
How to evaluate VTOL transition performance before buying
For many enterprise buyers, the challenge is not understanding aerodynamic theory. It is turning that theory into a repeatable selection process. The most effective approach is to evaluate aircraft in four layers: airframe configuration, transition test data, payload compatibility, and maintenance burden. This avoids overvaluing a single performance headline such as cruise endurance or top speed.
A useful supplier review should include demonstration flights across at least 3 conditions: nominal payload, near-maximum payload, and representative wind. If the mission is pipeline inspection, ask for a profile that includes vertical takeoff, transition, cruise, low-speed waypoint correction, and return transition for landing. Bench data is helpful, but mission-sequence evidence is far more decision-relevant.
The table below can be used as a structured checklist during technical due diligence or competitive comparison.
The key conclusion is that transition quality must be treated as a measurable procurement variable. It should sit beside endurance, payload, and link range in the supplier scorecard. If the aircraft transitions poorly, the rest of the advertised performance becomes far less useful in operational reality.
Typical procurement mistakes
Three mistakes appear often. First, buyers accept cruise data without transition evidence. Second, they evaluate empty-airframe performance rather than mission-payload performance. Third, they overlook training and maintenance requirements tied to transition-critical components. Each mistake can add weeks of qualification delay and significant trial-and-error cost once the platform reaches the field.
A stronger process is to define acceptance criteria before vendor demos. For example: stable automatic transition at full mission payload, no abnormal roll excursion, controlled altitude loss within a preset threshold, and post-flight current and temperature logs within acceptable limits. Clear standards make supplier comparison more objective and reduce decision noise.
FAQ: practical questions from engineers, operators, and decision-makers
How much transition altitude loss is acceptable?
There is no single universal value because aircraft size, loading, and mission profile differ. However, a professional UAV program should define a repeatable allowable band. For some small inspection platforms, a controlled loss under 5 to 15 meters may be acceptable. What matters most is consistency under the same payload and wind condition, not a one-time best result.
Is transition mainly a hardware problem or a software problem?
It is both. Hardware sets the aerodynamic envelope, thrust margin, and structural response. Software decides how to use that envelope in real time. A well-designed airframe with poor tuning can still transition badly, while excellent software cannot fully rescue a layout with severe airflow interference or insufficient thrust-to-weight ratio.
Which metrics should procurement teams request first?
Start with five items: minimum safe transition airspeed, transition duration, altitude change during transition, validated wind envelope, and payload-dependent center-of-gravity limits. These metrics give a practical picture of whether the aircraft can support repeatable field use rather than just test-range demonstrations.
Does a smoother transition always mean a better aircraft?
Not always. A smooth-looking transition may hide conservative control logic that wastes energy and reduces endurance. The better question is whether the aircraft transitions smoothly while keeping energy use, altitude deviation, and control effort within efficient and safe limits. Engineering evaluation should consider all four factors together.
VTOL transition phase aerodynamics is ultimately about controlled lift transfer, clean airflow management, and software logic that respects real hardware limits. For engineers, it defines design maturity. For operators, it affects mission safety and repeatability. For buyers and enterprise decision-makers, it is a critical evaluation point that can shorten qualification cycles and reduce downstream operational risk.
If your team is assessing VTOL UAV platforms for pipeline inspection, corridor mapping, or other demanding industrial missions, focus on measurable transition behavior instead of broad claims. To compare architectures, validate supplier data, or build a more rigorous UAV benchmark framework, contact TechStat Vanguard to get a tailored technical evaluation approach and explore more hard-tech decision support solutions.
Search News
Hot Articles
- Carbon Fiber StructuresHow to Specify Aerospace Carbon Fiber Assemblies for Lightweight, Load-Bearing PartsJul 11, 2026
- Machine VisionXiaomi, Alibaba DAMO Academy Drive Open-Source Robotics Model Ecosystem, Lowering Algorithm Development Barriers for Overseas SMEs Adopting Chinese Robotics SolutionsMar 30, 2026
- Cobots & ArmsShanxi 'AI+' Conference Showcases Embodied Intelligence with Multinational Buyer Engagement: Key Industry ImplicationsMar 30, 2026
Popular Tags
Recommended News
 Jul 11, 2026How to Specify Aerospace Carbon Fiber Assemblies for Lightweight, Load-Bearing PartsAerospace carbon fiber assemblies: learn how to specify laminate design, load data, joining methods, and inspection controls for lighter, reliable load-bearing aerospace parts.Elena Rostova (UAV Systems Researcher)
 Mar 30, 2026Xiaomi, Alibaba DAMO Academy Drive Open-Source Robotics Model Ecosystem, Lowering Algorithm Development Barriers for Overseas SMEs Adopting Chinese Robotics SolutionsXiaomi & Alibaba DAMO Academy's open-source robotics models lower algorithm barriers for global SMEs. Boost efficiency in manufacturing, logistics & smart retail with ROS 2 compatible solutions.TSV Data Lab
 Mar 30, 2026Shanxi 'AI+' Conference Showcases Embodied Intelligence with Multinational Buyer Engagement: Key Industry ImplicationsShanxi 'AI+' Conference highlights embodied intelligence with Tesla, Ubtech & Jiantao showcasing multimodal robotics. 40+ global buyers validated tech on-site, creating new B2B channels for industrial automation & AI solutions.Chen Wei (Automation Lead Engineer)
 Mar 30, 2026Zhongguancun Unveils 6G Integrated Sensing-Computing-Intelligence Platform to Empower Embodied Robots for Global Industrial ApplicationsZhongguancun's new 6G platform revolutionizes industrial robotics with <10ms latency, empowering global automotive, logistics & port automation. Discover how this tech boosts China's smart manufacturing exports.TSV Data Lab
 Mar 30, 2026Mech-Mind Tianjin Embodied Intelligence R&D and Production Base Goes Live, Cutting Delivery Time by 20%–30% for Global Customized AMR+Vision SolutionsMech-Mind's Tianjin AMR+Vision production base cuts delivery time by 20%-30% for欧美 & Latin American markets. Discover how this PLd-certified facility accelerates customized robotics solutions for smart manufacturing and logistics.Chen Wei (Automation Lead Engineer)
 Mar 30, 2026Boao Forum Reveals 'Co-evolution of Big and Small Brains' Trend in Humanoid Robots, China's Embodied Intelligence Accelerates Adaptation to Overseas Manufacturing Service ScenariosDiscover how China's humanoid robots, featuring 'Co-evolution of Big and Small Brains,' are revolutionizing global manufacturing. Learn about Embodied Tian Gong 3.0's ISO compliance and overseas deployment at Boao Forum 2026.Chen Wei (Automation Lead Engineer)
 Mar 30, 2026China Railway Industrial Secures Patent for Embodied Robotics in Material Handling, Boosting High-Precision Delivery Capabilities for Overseas Infrastructure and Manufacturing ProjectsChina Railway Industrial's new patent for embodied robotics in material handling boosts high-precision delivery for global infrastructure & manufacturing. Discover how this innovation enhances logistics accuracy in automotive, rail transit & EPC projects.Chen Wei (Automation Lead Engineer)
 Oct 26, 2026AMAXiMAL Releases Open-Source TopMod 3D v3 With Claude AIExplore AMAXiMAL’s free, open-source TopMod 3D v3 with Claude AI assistance, topology-based modeling and plywood fabrication tools that connect complex designs to physical builds.Dr. Marcus Vance
 Oct 26, 2026Choosing a SCADA System Integrator Company: PLC Compatibility and Long-Term SupportChoose a scada system integrator company with proven PLC compatibility and reliable long-term support. Discover what to test, compare, and require before investing.Victor Lin (Chief Software Architect)
 Oct 25, 2026Hesai Leads Global ADAS Main Lidar Shipments in Yole’s 2026 ReportHesai led global ADAS main lidar shipments with a 43% share in 2025, according to Yole’s 2026 report. Explore what this ranking reveals about its automotive market position.TSV Data Lab
 Oct 25, 2026Choosing an Aerospace Materials Manufacturer: Quality and Traceability ChecksChoosing an aerospace materials manufacturer? Learn how to verify certifications, test reports, and lot traceability to qualify suppliers confidently and reduce costly sourcing risks.Dr. Marcus Vance
 Oct 24, 2026Guotai Haitong: Global Entry-Level 3D Printer Shipments Rose 39% in Q1 2026Entry-level 3D printer shipments rose 39% in Q1 2026, Guotai Haitong reports. Explore how AI, multicolor printing and print farms are shaping market growth.Dr. Marcus Vance
 Oct 24, 2026Choosing an Industrial Vision Inspection Supplier: Acceptance Tests That MatterChoose an industrial vision inspection supplier with confidence. Discover acceptance tests for defect detection, false rejects, production speed, and reliable part rejection before you buy.TSV Data Lab
 Oct 23, 2026US Navy Raises Gecko Robotics Contract Ceiling to $300M for Robotic Fleet MaintenanceUS Navy raises Gecko Robotics’ contract ceiling to $300M for Pacific Fleet robotic inspections. Explore potential opportunities for maintenance suppliers and key procurement considerations.Chen Wei (Automation Lead Engineer)
 Oct 23, 2026Choosing Industrial Sensing Systems for Global Plants: Protocol CompatibilityCompare industrial sensing systems international buyers can trust. Explore protocol compatibility, reduce integration risks, and select proven configurations for reliable global plant deployments.TSV Data Lab
 Oct 22, 2026KUKA Showcases Physical AI and iiQKA.AI Vision at NVIDIA GTC BerlinExplore KUKA’s Physical AI showcase at NVIDIA GTC Berlin and discover how iiQKA.AI Vision aims to simplify robotic vision integration and improve 2D and 3D scene recognition.TSV Data Lab
 Oct 22, 2026Robotic Machining of Advanced Composites: What Tolerances Are Achievable?Explore advanced materials machining robotics: discover what drives achievable composite tolerances and how to validate accuracy before investing in your next machining system.Dr. Marcus Vance
 Oct 21, 2026China’s Industrial Robot Exports Near RMB 10 Billion in First Nine Months of 2026China’s industrial robot exports neared RMB 10 billion in January–September 2026, with value rising faster than volume. Explore the data and what it could mean for suppliers.Chen Wei (Automation Lead Engineer)
 Oct 21, 2026Low-Latency Industrial Data Processing: Pricing and Key Cost DriversExplore industrial data latency price drivers, from edge hardware to integration and support. Learn how to compare quotes, verify performance, and avoid unnecessary costs.TSV Data Lab
 Oct 20, 2026KUKA Launches iiQKA.AI Vision to Simplify Industrial Image ProcessingKUKA iiQKA.AI Vision simplifies industrial image processing with controller-based 2D and 3D vision. Explore drag-and-drop setup for vision-guided automation.TSV Data Lab
 Oct 20, 2026Smart Industrial Edge Devices: Key Criteria for Legacy PLC IntegrationChoose smart industrial edge devices for legacy PLC integration. Discover key criteria for compatibility, data quality, security, and reliable collection without disrupting control.TSV Data Lab
 Oct 19, 2026Choosing a Radar Sensor by Application: Range, Resolution, and Field of ViewSimplify radar sensor application based product selection. Compare range, resolution, and field of view to avoid blind spots and choose with confidence. Explore the guide.TSV Data Lab
 Oct 18, 2026Comparing Material Options for Procurement: Specs, Costs, and Supply RisksExplore procurement oriented technical content on material options, specs, costs, and supply risks. Compare alternatives to cut hidden expenses and make confident sourcing decisions.Dr. Marcus Vance
 Oct 17, 20265-Axis CNC Positioning Accuracy: How to Interpret ISO 230-2 Test ResultsAssess 5 axis CNC machining positioning accuracy with ISO 230-2. Learn to interpret repeatability, reversal error, and test conditions to compare suppliers and make confident acceptance decisions.Dr. Marcus Vance