Reading a LiPo Battery Discharge Rate Curve the Right Way
Publication Date
author
A LiPo battery discharge rate curve can reveal far more than a simple voltage drop—it shows how a pack behaves under load, where usable capacity really ends, and how performance degrades across the cycle. Reading a lipo battery discharge rate curve correctly helps separate measurable electrical behavior from optimistic label claims, making it a practical tool for technical evaluation, system design, and battery comparison across drones, robotics, portable electronics, and edge devices.
In data-driven engineering environments, battery selection should never rely only on nominal voltage, advertised C-rating, or stated capacity. A proper reading of the lipo battery discharge rate curve gives insight into voltage sag, thermal stress, sustained output, and the true performance window under realistic load conditions. That matters when runtime stability, control reliability, and equipment safety all depend on predictable power delivery.
Why the LiPo Battery Discharge Rate Curve Matters More Than the Label
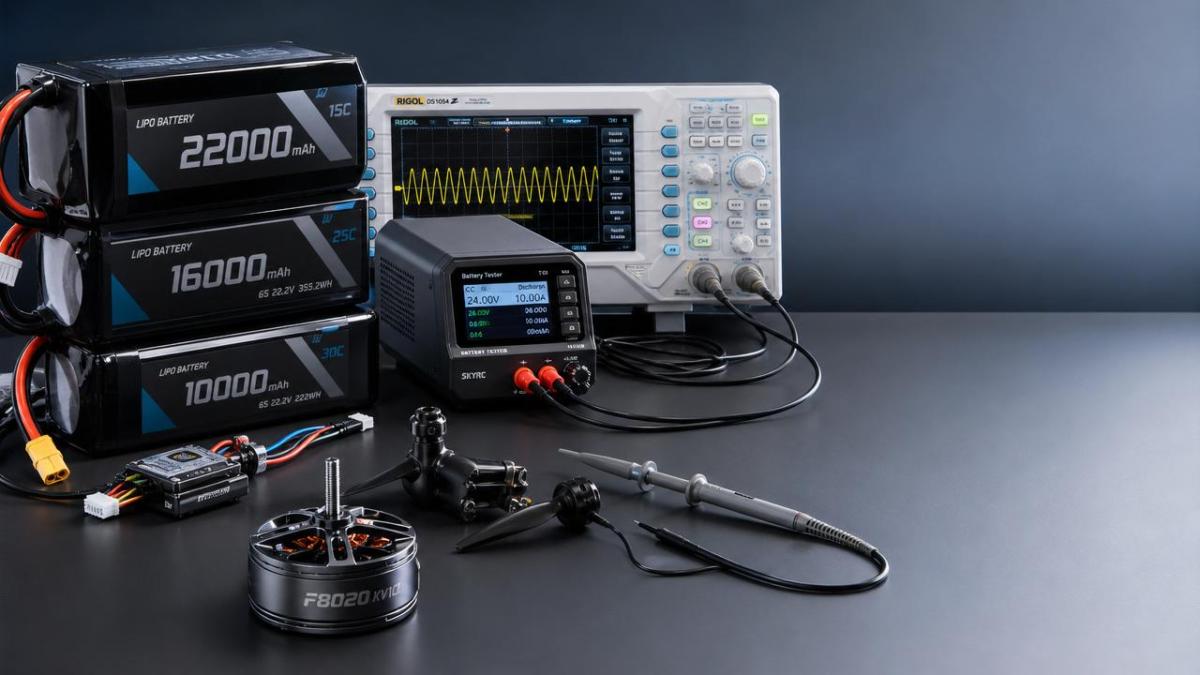
A battery label usually presents three attractive numbers: voltage, capacity, and discharge rating. Yet those values alone do not show how the pack behaves during real discharge. The lipo battery discharge rate curve exposes what happens from full charge to cutoff under a defined current load, making it easier to judge whether a battery can actually support a device without excessive voltage collapse.
For technical benchmarking, this curve is useful because it translates marketing language into observable performance. A pack with a high claimed discharge rate may still show steep early sag, rapid heat buildup, or a shortened flat-voltage region. By contrast, a more conservatively rated pack may deliver a more stable discharge profile and therefore better real-world utility. In other words, the lipo battery discharge rate curve is often a better indicator of engineering quality than the printed C-number.
Core Points to Check When Reading a LiPo Battery Discharge Rate Curve
Use the following points whenever comparing packs, validating supplier data, or reviewing laboratory battery tests. Each point helps turn a graph into a decision-ready assessment.
- Check the starting voltage under load, because immediate drop from full charge reveals internal resistance and shows whether the pack can support high-current startup demands.
- Look for the length of the flat plateau, since a longer stable region usually indicates more usable energy and steadier system performance before cutoff risk rises.
- Measure voltage sag at the intended discharge rate, not just at low current, because the same pack can look excellent at 1C and weak at 10C.
- Identify the knee point where voltage begins to fall rapidly, as this often marks the practical end of safe and stable usable capacity.
- Compare curves at multiple C-rates to understand performance scaling, because a reliable pack should degrade predictably rather than collapsing sharply under higher loads.
- Verify the cutoff voltage used in testing, since different test endpoints can artificially improve or worsen the apparent capacity shown on the discharge graph.
- Review pack temperature during discharge if available, because voltage behavior without thermal context can hide stress that shortens cycle life or creates safety issues.
- Check whether the test is per cell or pack level, since cell imbalance may be hidden in aggregate pack data and affect practical system reliability.
- Compare delivered capacity before the voltage knee rather than total theoretical capacity, because systems often cannot use the last portion without instability.
- Watch for unusually smooth published curves with no testing conditions, as incomplete context can indicate selective presentation rather than transparent engineering data.
How to Interpret the Shape of a LiPo Battery Discharge Rate Curve
Most discharge graphs can be understood in three zones. First is the initial drop, which occurs immediately after load is applied. A small initial drop is normal, but an aggressive plunge suggests elevated internal resistance or overstated discharge capability. Second is the main plateau, where voltage declines gradually. This is the most valuable part of the curve because it represents the stable working region for most applications. Third is the final knee, where voltage falls sharply and remaining energy becomes less usable.
When reading a lipo battery discharge rate curve, the knee matters more than many readers expect. A battery may still contain measurable capacity after this point, but the power system may no longer tolerate it. Motor controllers, avionics, embedded processors, video transmitters, and sensor arrays often require consistent voltage headroom. Once the curve bends downward, intermittent resets, performance drop, and thermal strain become more likely even before absolute cutoff is reached.
Another key interpretation point is curve separation across different loads. If 1C, 5C, and 10C curves remain reasonably close in the plateau region, the chemistry and construction are handling current stress well. If high-rate curves diverge dramatically early in the cycle, the battery may be unsuitable for pulse-heavy or sustained-load applications despite an impressive advertised rating.
Application Notes for Different Use Cases
UAV and Aerospace-Adjacent Systems
In multirotor and fixed-wing platforms, current draw changes rapidly with throttle, payload, and wind response. Here, the lipo battery discharge rate curve should be evaluated with attention to voltage sag and plateau stability at medium-to-high discharge rates. A pack that appears acceptable in static bench testing may still trigger low-voltage alarms early during climb or maneuvering if the curve compresses under dynamic load.
It is also wise to examine the discharge knee conservatively. Flight systems rarely benefit from pushing cells into the steep end zone, because reserve power margin affects control confidence and return-to-home planning. In practice, the most valuable metric is often stable voltage delivery before the knee, not maximum drained capacity.
Robotics and Mobile Automation
Ground robots, AGVs, and portable automation units often experience mixed loading: steady drive current, transient actuator spikes, and compute power for sensors or edge AI. For these systems, a good lipo battery discharge rate curve shows not only sufficient runtime but resistance to sudden voltage dips that could affect motor drivers, communication modules, or onboard control logic.
Look closely at mid-cycle behavior, because many robotic systems spend most of their operating life in the middle state of charge rather than near full charge. A battery that only performs strongly in the opening section of the curve may produce inconsistent field behavior later in the mission.
Portable Electronics, Test Equipment, and Embedded Devices
For lower-current devices, a lipo battery discharge rate curve is still important, but the focus shifts toward usable capacity, voltage regulation margin, and long-cycle consistency. Even when peak current is modest, a narrow plateau can reduce runtime predictability and complicate state-of-charge estimation algorithms.
In these scenarios, compare curves across repeated cycles if possible. Some packs deliver strong early-cycle performance yet show faster degradation over time. The better engineering choice is usually the pack with a more repeatable curve rather than the one with the highest first-test capacity figure.
Commonly Overlooked Risks When Evaluating a LiPo Battery Discharge Rate Curve
Ignoring test conditions. A discharge graph without ambient temperature, current level, cutoff voltage, and rest protocol is incomplete. Since LiPo performance is highly condition-dependent, missing context makes comparison unreliable.
Confusing burst claims with sustained behavior. Some packs tolerate short current pulses but cannot hold voltage over continuous discharge. The lipo battery discharge rate curve should reflect the real duty cycle, not only peak events.
Using total capacity as the main decision metric. A battery can show large measured capacity while spending too much of the cycle in a low-voltage region that the system cannot use effectively.
Overlooking cell balance and pack aging. A clean pack-level curve may hide one weaker cell, and aging can shift the knee earlier even if nominal capacity loss appears modest.
Treating all applications as equivalent. The best curve for a racing drone, mobile robot, backup device, or vision system will not be identical. The correct reading depends on load profile and voltage sensitivity.
Practical Execution Steps for Better Battery Decisions
- Request discharge curves at multiple C-rates, not a single nominal test point.
- Match the evaluation current to the real operating profile of the target system.
- Record the voltage knee position and estimate usable capacity before that region.
- Review temperature rise together with the lipo battery discharge rate curve.
- Compare at least two or three candidate packs under identical test conditions.
- Retest after cycle aging to see whether curve stability remains acceptable.
- Use curve data to set conservative low-voltage thresholds in the final system.
FAQ About the LiPo Battery Discharge Rate Curve
Does a higher C-rating always mean a better discharge curve?
No. A higher printed C-rating does not guarantee a superior lipo battery discharge rate curve. Real quality shows up in lower sag, a stronger plateau, and predictable behavior under the target load.
What is the most useful part of the curve for engineering decisions?
Usually the plateau and knee transition. These reveal how long the battery can deliver stable voltage and where practical usable capacity ends under realistic operating conditions.
Why do two packs with the same capacity behave differently?
Because cell chemistry, internal resistance, construction quality, thermal behavior, and balancing all influence the lipo battery discharge rate curve. Capacity alone does not define power delivery quality.
Conclusion and Next-Step Action
Reading a lipo battery discharge rate curve the right way means looking beyond headline capacity and advertised C-ratings. The meaningful questions are simple: how much voltage is lost at load application, how stable the plateau remains, when the knee appears, and how much usable energy exists before performance becomes risky. These are the factors that support reliable engineering judgment.
For any technical review, build a small comparison sheet using identical test conditions and log the start sag, plateau length, knee position, delivered capacity before the knee, and temperature rise. That process turns the lipo battery discharge rate curve from a marketing graphic into a practical benchmark. In line with TSV’s data-first philosophy, better battery decisions begin when performance is read from measured curves rather than assumed from labels.
Search News
Hot Articles
- Carbon Fiber StructuresHow to Specify Aerospace Carbon Fiber Assemblies for Lightweight, Load-Bearing PartsJul 11, 2026
- Machine VisionXiaomi, Alibaba DAMO Academy Drive Open-Source Robotics Model Ecosystem, Lowering Algorithm Development Barriers for Overseas SMEs Adopting Chinese Robotics SolutionsMar 30, 2026
- Cobots & ArmsShanxi 'AI+' Conference Showcases Embodied Intelligence with Multinational Buyer Engagement: Key Industry ImplicationsMar 30, 2026
Popular Tags
Recommended News
 Jul 11, 2026How to Specify Aerospace Carbon Fiber Assemblies for Lightweight, Load-Bearing PartsAerospace carbon fiber assemblies: learn how to specify laminate design, load data, joining methods, and inspection controls for lighter, reliable load-bearing aerospace parts.Elena Rostova (UAV Systems Researcher)
 Mar 30, 2026Xiaomi, Alibaba DAMO Academy Drive Open-Source Robotics Model Ecosystem, Lowering Algorithm Development Barriers for Overseas SMEs Adopting Chinese Robotics SolutionsXiaomi & Alibaba DAMO Academy's open-source robotics models lower algorithm barriers for global SMEs. Boost efficiency in manufacturing, logistics & smart retail with ROS 2 compatible solutions.TSV Data Lab
 Mar 30, 2026Shanxi 'AI+' Conference Showcases Embodied Intelligence with Multinational Buyer Engagement: Key Industry ImplicationsShanxi 'AI+' Conference highlights embodied intelligence with Tesla, Ubtech & Jiantao showcasing multimodal robotics. 40+ global buyers validated tech on-site, creating new B2B channels for industrial automation & AI solutions.Chen Wei (Automation Lead Engineer)
 Mar 30, 2026Zhongguancun Unveils 6G Integrated Sensing-Computing-Intelligence Platform to Empower Embodied Robots for Global Industrial ApplicationsZhongguancun's new 6G platform revolutionizes industrial robotics with <10ms latency, empowering global automotive, logistics & port automation. Discover how this tech boosts China's smart manufacturing exports.TSV Data Lab
 Mar 30, 2026Mech-Mind Tianjin Embodied Intelligence R&D and Production Base Goes Live, Cutting Delivery Time by 20%–30% for Global Customized AMR+Vision SolutionsMech-Mind's Tianjin AMR+Vision production base cuts delivery time by 20%-30% for欧美 & Latin American markets. Discover how this PLd-certified facility accelerates customized robotics solutions for smart manufacturing and logistics.Chen Wei (Automation Lead Engineer)
 Mar 30, 2026Boao Forum Reveals 'Co-evolution of Big and Small Brains' Trend in Humanoid Robots, China's Embodied Intelligence Accelerates Adaptation to Overseas Manufacturing Service ScenariosDiscover how China's humanoid robots, featuring 'Co-evolution of Big and Small Brains,' are revolutionizing global manufacturing. Learn about Embodied Tian Gong 3.0's ISO compliance and overseas deployment at Boao Forum 2026.Chen Wei (Automation Lead Engineer)
 Mar 30, 2026China Railway Industrial Secures Patent for Embodied Robotics in Material Handling, Boosting High-Precision Delivery Capabilities for Overseas Infrastructure and Manufacturing ProjectsChina Railway Industrial's new patent for embodied robotics in material handling boosts high-precision delivery for global infrastructure & manufacturing. Discover how this innovation enhances logistics accuracy in automotive, rail transit & EPC projects.Chen Wei (Automation Lead Engineer)
 Sep 29, 2026ISO 9283 Repeatability: How to Evaluate Cobot Positioning PerformanceISO 9283 cobot repeatability explained: learn how payload, reach, approach direction, and test conditions affect positioning performance and cell capability.Chen Wei (Automation Lead Engineer)
 Sep 28, 2026Spindle Runout Measurement in Germany: DIN Standards, Methods, and Acceptance LimitsSpindle runout measurement Germany: explore DIN standards, proven methods, acceptance limits, and audit-ready practices for reliable machining quality.Dr. Marcus Vance
 Sep 27, 2026How to Select Wall-Mount Edge Devices for Space-Constrained Factory NetworksWall mount edge devices for space-constrained factories: evaluate workload, thermal design, power resilience, cable access, and network reliability for smarter deployments.TSV Data Lab
 Sep 26, 2026Machining Tolerance Analysis: How to Set Limits That Meet Function and Cost TargetsMachining tolerance analysis: learn how to set functional limits, control tolerance stacks, reduce inspection risk, and balance precision with production cost.Dr. Marcus Vance
 Sep 25, 2026How to Evaluate an Industrial Infrastructure Data Platform for Multi-Site OperationsIndustrial infrastructure data platform evaluation guide for multi-site operations: compare data quality, edge resilience, interoperability, governance, and scalable proof-of-value criteria.Victor Lin (Chief Software Architect)
 Sep 24, 2026How to Select Machine Vision Optics for Accurate Inspection at Different Working DistancesMachine vision optics selection guide for accurate inspection at every working distance. Compare FOV, pixel scale, DOF, distortion, lighting, and telecentric options.TSV Data Lab
 Sep 23, 2026How to Evaluate a Machine Vision System Integrator for High-Speed Inspection LinesChoose a machine vision system integrator with proven expertise in high-speed inspection, reliable reject timing, robust optics, and measurable acceptance criteria.TSV Data Lab
 Sep 28, 2026When is a SCADA API the right choice for connecting plant systems?SCADA API guide: learn when governed plant data integration improves traceability, security, and scalability—without compromising real-time control.Victor Lin (Chief Software Architect)
 Sep 27, 2026How SCADA data integration improves traceability across production linesSCADA data integration connects production-line data to improve traceability, accelerate quality investigations, and strengthen safety decisions.Victor Lin (Chief Software Architect)
 Sep 26, 2026What to define before starting SCADA integration planningSCADA integration planning starts with clear scope, control boundaries, data models, cybersecurity, and testing. Discover the definitions that reduce risk and costly rework.Victor Lin (Chief Software Architect)
 Sep 25, 2026How a smart factory with Industrial IoT reduces production blind spotsDiscover how a smart factory with Industrial IoT turns real-time machine, quality, and workflow data into actionable insights that reduce production blind spots and delivery risks.Victor Lin (Chief Software Architect)
 Sep 24, 2026When does Industrial IoT make smart manufacturing easier to scale?Smart manufacturing Industrial IoT scales when trusted data, interoperable systems, and secure workflows turn connected assets into measurable gains.TSV Data Lab
 Sep 23, 2026What drives ultra-precision machining cost at 1-micron tolerance?Ultra precision machining cost per part at 1 micron tolerance depends on process, material, metrology, and yield. Learn how to compare quotes confidently.Dr. Marcus Vance
 Sep 22, 2026Drone Engine-T550CC Applications: Build the UAV Power System Around the MissionAn application guide for Drone Engine-T550CC integration, covering payload planning, airframe matching, cooling, fuel, vibration, test procedures, documentation, and service preparation.Elena Rostova (UAV Systems Researcher)
 Sep 22, 2026How to Evaluate Industrial Edge Computing Vendors for Factory DeploymentIndustrial edge computing vendor evaluation guide for factories: compare latency, protocol fit, reliability, security, and lifecycle support before deployment.TSV Data Lab
 Sep 21, 2026Drone Payload Integration: Matching Power, Data, and Center of Gravity for Reliable FlightsDrone payload integration made practical: balance power, data, center of gravity, and endurance to build safer, more reliable mission-ready flights.Elena Rostova (UAV Systems Researcher)
 Sep 20, 2026Autonomous Navigation Pricing: Cost Drivers and Budget Benchmarks for AMR ProjectsAutonomous navigation price explained: compare AMR cost drivers, software, sensors, integration, safety, and lifecycle budgets to build a scalable project plan.Chen Wei (Automation Lead Engineer)