
Why edge AI latency jumps after model updates
Publication Date
author
When edge deployments slow down after a model refresh, the root cause is rarely the model alone. From edge ai inference latency industrial issues to mqtt broker payload size limit, opc ua server response time, and real time operating system rtos benchmark constraints, post-update latency spikes often expose hidden bottlenecks across the entire stack. This article breaks down why latency jumps happen, how to verify them with engineering metrics, and what decision-makers, operators, and buyers should check before rolling updates at scale.
For engineering teams, a 15 ms increase may be tolerable in a dashboard application but unacceptable in machine vision sorting, autonomous mobile robotics, or industrial safety monitoring. For procurement teams, an apparently minor update issue can reveal a deeper mismatch between compute headroom, network design, middleware configuration, and supplier transparency. For executives, the main question is simple: how do you prevent a software refresh from becoming an operational risk?
At TechStat Vanguard, the practical answer is to treat latency as a system-level engineering parameter, not a marketing metric. The useful benchmark is not “faster AI,” but end-to-end response time under defined payloads, thermal conditions, protocol loads, and failover states. That is especially true in sensors and edge AI environments, where the model, runtime, gateway, broker, PLC connection, and RTOS scheduler all compete for deterministic performance.
Why latency jumps after a model update are usually system-level failures
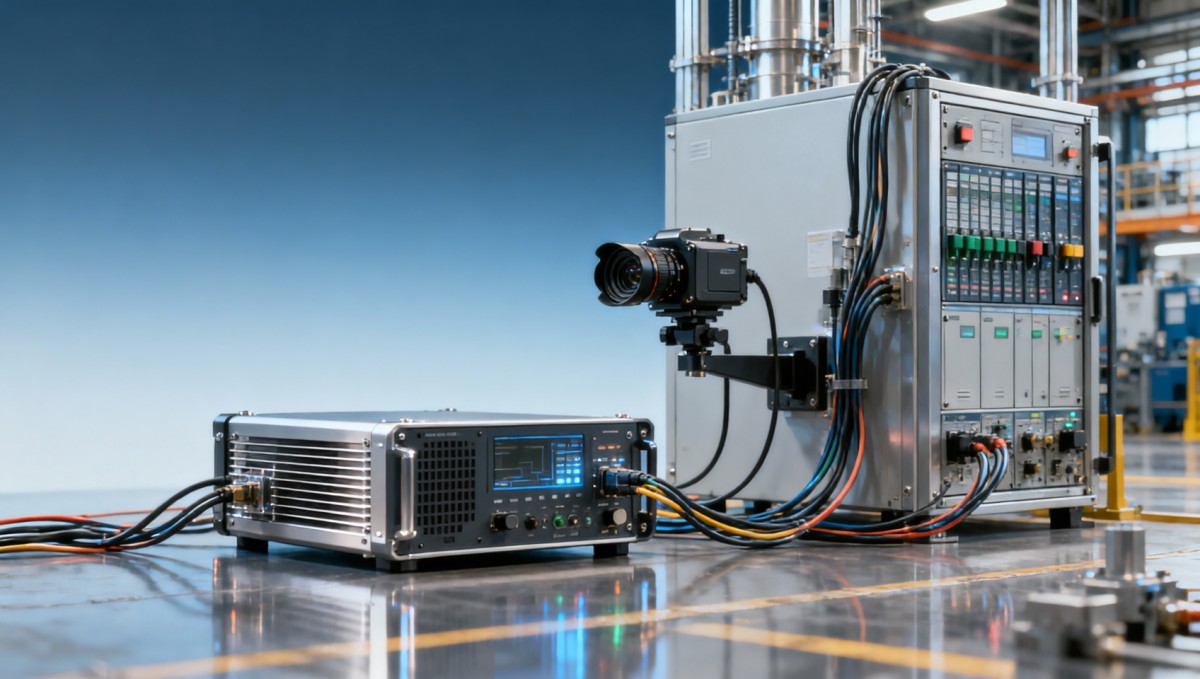
A model refresh often changes more than weights and accuracy. In many edge deployments, the update also changes tensor shape, memory footprint, operator compatibility, batch handling, pre-processing steps, and confidence filtering logic. Even when average inference time rises by only 8% to 12%, the end-to-end latency seen by operators can jump by 25% to 60% because downstream services are already near saturation.
This is why edge AI inference latency industrial troubleshooting cannot stop at the neural network layer. A camera pipeline that previously delivered 30 FPS may drop to 22–24 FPS if image resizing moves from hardware acceleration to CPU fallback. An IIoT gateway that handled 2,000 messages per minute before the update may start queuing if payload size grows from 64 KB to 256 KB and the broker is still tuned for older conditions.
In industrial environments, post-update delays also expose hidden timing dependencies. A model that consumes 1.3 GB of memory instead of 800 MB can trigger more frequent memory copies, cache misses, or storage reads. On fanless hardware operating at 45°C to 60°C enclosure temperature, that may be enough to initiate thermal throttling after 10 to 20 minutes of continuous operation.
The practical problem is that many teams only compare average inference time before and after deployment. That misses the real operational indicators: P95 latency, P99 latency, queue depth, dropped frame rate, and control-loop deadline misses. A system can show only a small average slowdown while still becoming unstable during peak load, protocol bursts, or shift-start traffic spikes.
Typical hidden sources of post-update latency
- Model graph changes that increase operator count, memory transfers, or unsupported layers requiring software fallback.
- Larger message payloads sent through MQTT, OPC UA, or REST interfaces after richer metadata is added.
- Runtime mismatch between updated frameworks and older edge accelerators, drivers, or kernel modules.
- RTOS task-priority conflicts when AI workloads consume CPU time originally reserved for deterministic control tasks.
- Storage or logging overhead caused by new debug flags, audit requirements, or trace collection during rollout.
Why “same hardware” does not mean same latency
Buyers often assume that if the edge box, camera, and network remain unchanged, response time should remain stable. In practice, the usable compute reserve may only be 15% to 20% in a mature deployment. Once a model update consumes that reserve, the system starts amplifying delays across all layers. The hardware is the same, but the operating margin is gone.
The table below shows how apparently small changes at one layer can produce larger end-to-end response shifts in real deployments.
The key conclusion is that latency jumps after model updates are rarely isolated software incidents. They usually signal that the deployment was already close to a threshold, and the update pushed one or more subsystems beyond their deterministic range.
How to verify the real bottleneck with engineering metrics
Verification starts with separating component latency from end-to-end latency. Engineering teams should measure at least five timestamps: sensor capture, pre-processing completion, inference completion, message publication, and application action or PLC acknowledgement. Without those timestamps, teams may misdiagnose an OPC UA server response time issue as a model issue, or blame the broker when the real problem is memory pressure in the edge runtime.
A useful baseline should include P50, P95, and P99 timing, not just mean values. In industrial edge systems, a P95 increase from 40 ms to 68 ms may already be enough to break a sorting conveyor timing window. If P99 rises above 100 ms while the average remains below 50 ms, operators will still experience intermittent misses, retries, and unexplained delays that look random but are actually measurable.
Thermal and load conditions also matter. Benchmarks run for 60 seconds on an open desk do not reflect a sealed cabinet in a plant running 24/7. A proper real time operating system RTOS benchmark should include at least three states: idle, nominal load, and burst load. In many cases, latency remains stable for the first 5 minutes and then degrades once CPU package temperature crosses a threshold such as 78°C or memory bandwidth saturation begins.
Protocol-level verification is equally important. If the update adds confidence maps, raw image snippets, or richer diagnostics, the mqtt broker payload size limit may become a practical bottleneck. Some deployments function well below 128 KB per message but begin showing retries, fragmentation, or queue backlog when message size exceeds 256 KB, especially on constrained links or shared plant networks.
A six-step verification workflow
- Freeze the pre-update baseline for 24 to 72 hours, including P95 latency, dropped frames, CPU load, memory use, and message queue depth.
- Deploy the new model in shadow mode, processing the same inputs without controlling live outputs.
- Compare component timings to isolate whether the delay appears in pre-processing, inference, transport, or control acknowledgement.
- Stress-test the system at 1.2x to 1.5x expected peak load to reveal queue buildup and thermal instability.
- Check protocol settings, including MQTT packet size, OPC UA subscription intervals, keepalive values, and retry policies.
- Repeat tests across 3 operating temperatures or enclosure conditions where possible.
The table below helps teams map symptoms to the most likely subsystem. This reduces the time wasted on model-only tuning when the fault is actually in middleware or control integration.
For procurement and decision teams, the lesson is clear: require benchmark definitions in supplier documentation. “Latency under test conditions” should specify input resolution, batch size, model version, ambient temperature, and protocol stack. Without that, numbers are not comparable and rollout risk remains hidden.
The middleware and protocol layer: MQTT, OPC UA, and message design
In many post-update incidents, the model is only half the story. The second half is message architecture. Once teams add more metadata, confidence history, bounding boxes, or image snippets, message size expands faster than expected. A deployment designed around 50 KB to 100 KB payloads may become unstable when updates push packets beyond 200 KB, especially if the MQTT broker was configured conservatively for embedded reliability rather than bulk transfer.
The mqtt broker payload size limit matters because it influences not just acceptance or rejection, but also queue depth, fragmentation, retransmission behavior, and memory allocation patterns. Even when the broker permits a large packet, the end device, client library, or shared network segment may not handle sustained bursts efficiently. This is why message architecture should be reviewed during every model revision, not only during network commissioning.
OPC UA introduces a different but related problem. An update can increase the number of variables written per event, or shorten the interval between events because detections become more frequent. If the opc ua server response time was already close to the process deadline, adding only a few more fields or subscriptions can create a visible lag in the control layer. In closed-loop environments, that can affect reject timing, robot pick timing, or alarm synchronization.
A robust design separates urgent control data from bulky diagnostic data. The control path should remain compact and deterministic, while audit images, logs, and historical analytics move through a secondary channel. This architecture usually reduces the risk that a useful model enhancement will unintentionally overload the real-time path.
Practical message-design rules
- Keep control messages lean, ideally below 16 KB to 64 KB where deterministic handling is more realistic on constrained edge links.
- Move images, heatmaps, and trace payloads to asynchronous channels or local buffering with scheduled upload.
- Review OPC UA subscription intervals, sampling rates, and write batching after every update, especially if event frequency changes by more than 10%.
- Track queue depth and retry count, not just average transit time, because backlog is often the earliest warning signal.
What buyers should request from vendors
Supplier proposals should include protocol assumptions, maximum validated payload size, tested broker conditions, and control-path latency under defined load. Asking for only a headline “response time” number is not enough. In industrial procurement, the meaningful question is: what was measured, over what period, and with what message structure?
For cross-border sourcing and system integration, this documentation becomes a trust filter. It allows R&D teams to compare competing edge platforms on engineering grounds rather than on abstract performance claims.
RTOS, runtime compatibility, and edge hardware headroom
The real time operating system RTOS benchmark dimension is often underused in edge AI projects. Teams may validate inference speed on Linux user space while ignoring whether the overall scheduler still meets deterministic deadlines. After a model update, that oversight becomes visible. A task that once consumed 20% CPU can rise to 35%, leaving too little headroom for fieldbus polling, safety checks, or vision trigger handling.
Compatibility between model runtime and accelerator stack is another frequent source of degradation. Updated ONNX, TensorRT, OpenVINO, or vendor-specific runtimes may alter kernel selection, precision mode, or memory alignment behavior. If the accelerator driver is one release behind, unsupported paths may silently fall back to CPU. The result is not just slower inference, but also more jitter because general-purpose scheduling replaces deterministic acceleration.
Headroom should be treated as a procurement specification. For many industrial systems, maintaining at least 25% compute reserve and 20% memory reserve under nominal load is a practical starting point. If a deployment operates permanently above 80% CPU or near memory limits, any future model refinement, cybersecurity patch, or logging change can trigger instability. That is not a software quality issue alone; it is a sizing issue.
Thermal design must also be part of the benchmark. Fanless systems, sealed enclosures, and dusty environments often reduce the safe sustained performance window. A platform that performs well for 3 minutes in a lab may not maintain the same clocks over an 8-hour shift in a 50°C cabinet. For buyers comparing hardware, sustained latency under heat is more relevant than peak throughput in a short demo.
Minimum validation items before approving an update
These checks are straightforward, but they are frequently skipped in fast-moving rollouts. For enterprise decision-makers, requiring them in validation plans reduces the probability of costly rollback cycles and emergency site support.
Procurement and rollout checklist for operators, buyers, and decision-makers
A good rollout process does not start with installation day. It starts at specification time. Procurement teams should translate latency risk into contractual validation items, while operators should define acceptable windows in process terms, such as maximum inspection delay, missed-detection tolerance, or control-loop deadline. Without those definitions, suppliers may optimize for demo speed instead of field reliability.
For operators, the most important question is whether the updated system stays predictable across a full shift. For buyers, the question is whether vendor claims include validated conditions and rollback support. For executives, the issue is governance: is there a staged deployment process, or are updates applied globally without site-level evidence?
A practical rollout strategy usually includes pilot deployment on 5% to 10% of devices, 1 to 2 weeks of monitoring, and predefined rollback triggers. Common triggers include P95 latency rising by more than 20%, frame loss exceeding a set threshold, or control acknowledgement time crossing the process limit. These numbers will vary by application, but the logic should be fixed before rollout begins.
This approach aligns with TSV’s engineering-first philosophy: parameters do not lie. The purpose is not to avoid model improvement, but to ensure every update is tested as a supply-chain and operations event, not just as a data science success.
Buyer and deployment checklist
- Request end-to-end latency benchmarks with P50, P95, and P99 values, not only average inference time.
- Verify mqtt broker payload size limit assumptions and tested message sizes under burst traffic.
- Ask for opc ua server response time data under realistic subscription counts and write rates.
- Confirm real time operating system RTOS benchmark or scheduler validation where deterministic behavior matters.
- Require rollback procedure, model version traceability, and a 24-hour to 72-hour post-update monitoring plan.
Final decision criteria
The strongest vendors and integration partners are not the ones promising “no latency impact.” They are the ones able to show timing breakdowns, thermal envelopes, payload assumptions, and control-path limits. That level of transparency reduces trial-and-error cost and speeds supplier qualification, which is exactly what technical decision-makers need in advanced manufacturing and industrial edge AI programs.
If your organization is planning a model refresh across edge devices, do not evaluate the update in isolation. Examine the full stack, define thresholds before rollout, and compare vendors on measurable engineering evidence. To reduce qualification risk and build a deployment plan around real-world latency behavior, contact TechStat Vanguard to discuss your edge AI benchmarking needs, request a tailored evaluation framework, or learn more about practical hard-tech validation strategies.
Search News
Hot Articles
- Carbon Fiber StructuresHow to Specify Aerospace Carbon Fiber Assemblies for Lightweight, Load-Bearing PartsJul 11, 2026
- Machine VisionXiaomi, Alibaba DAMO Academy Drive Open-Source Robotics Model Ecosystem, Lowering Algorithm Development Barriers for Overseas SMEs Adopting Chinese Robotics SolutionsMar 30, 2026
- Cobots & ArmsShanxi 'AI+' Conference Showcases Embodied Intelligence with Multinational Buyer Engagement: Key Industry ImplicationsMar 30, 2026
Popular Tags
Recommended News
 Jul 11, 2026How to Specify Aerospace Carbon Fiber Assemblies for Lightweight, Load-Bearing PartsAerospace carbon fiber assemblies: learn how to specify laminate design, load data, joining methods, and inspection controls for lighter, reliable load-bearing aerospace parts.Elena Rostova (UAV Systems Researcher)
 Mar 30, 2026Xiaomi, Alibaba DAMO Academy Drive Open-Source Robotics Model Ecosystem, Lowering Algorithm Development Barriers for Overseas SMEs Adopting Chinese Robotics SolutionsXiaomi & Alibaba DAMO Academy's open-source robotics models lower algorithm barriers for global SMEs. Boost efficiency in manufacturing, logistics & smart retail with ROS 2 compatible solutions.TSV Data Lab
 Mar 30, 2026Shanxi 'AI+' Conference Showcases Embodied Intelligence with Multinational Buyer Engagement: Key Industry ImplicationsShanxi 'AI+' Conference highlights embodied intelligence with Tesla, Ubtech & Jiantao showcasing multimodal robotics. 40+ global buyers validated tech on-site, creating new B2B channels for industrial automation & AI solutions.Chen Wei (Automation Lead Engineer)
 Mar 30, 2026Zhongguancun Unveils 6G Integrated Sensing-Computing-Intelligence Platform to Empower Embodied Robots for Global Industrial ApplicationsZhongguancun's new 6G platform revolutionizes industrial robotics with <10ms latency, empowering global automotive, logistics & port automation. Discover how this tech boosts China's smart manufacturing exports.TSV Data Lab
 Mar 30, 2026Mech-Mind Tianjin Embodied Intelligence R&D and Production Base Goes Live, Cutting Delivery Time by 20%–30% for Global Customized AMR+Vision SolutionsMech-Mind's Tianjin AMR+Vision production base cuts delivery time by 20%-30% for欧美 & Latin American markets. Discover how this PLd-certified facility accelerates customized robotics solutions for smart manufacturing and logistics.Chen Wei (Automation Lead Engineer)
 Mar 30, 2026Boao Forum Reveals 'Co-evolution of Big and Small Brains' Trend in Humanoid Robots, China's Embodied Intelligence Accelerates Adaptation to Overseas Manufacturing Service ScenariosDiscover how China's humanoid robots, featuring 'Co-evolution of Big and Small Brains,' are revolutionizing global manufacturing. Learn about Embodied Tian Gong 3.0's ISO compliance and overseas deployment at Boao Forum 2026.Chen Wei (Automation Lead Engineer)
 Mar 30, 2026China Railway Industrial Secures Patent for Embodied Robotics in Material Handling, Boosting High-Precision Delivery Capabilities for Overseas Infrastructure and Manufacturing ProjectsChina Railway Industrial's new patent for embodied robotics in material handling boosts high-precision delivery for global infrastructure & manufacturing. Discover how this innovation enhances logistics accuracy in automotive, rail transit & EPC projects.Chen Wei (Automation Lead Engineer)
 Oct 14, 2026Drone Frame Composites: Carbon Fiber vs. Fiberglass for Weight and StiffnessExplore drone structural materials composites: compare carbon fiber and fiberglass for weight, stiffness, cost, and antenna compatibility. Find the right material for your drone frame.Elena Rostova (UAV Systems Researcher)
 Oct 13, 2026Smart Cameras vs. PC-Based Machine Vision: Which Fits High-Speed Inspection?This industrial product comparison for machine vision weighs smart cameras vs. PC-based systems on latency, throughput, and cost. Discover your best fit for high-speed inspection.TSV Data Lab
 Oct 12, 2026How to Verify RoHS Compliance in Industrial Sensing Systems Before DeploymentRoHS compliant sensing systems: learn how to verify materials, supplier declarations, testing, and configuration controls before industrial deployment.TSV Data Lab
 Oct 11, 2026How Procurement-Oriented Content Taxonomy Improves B2B Buying JourneysProcurement-oriented content taxonomy streamlines B2B buying journeys with clearer evidence, supplier comparisons, risk visibility, and faster approvals.TSV Data Lab
 Oct 10, 2026How to Select a Machine Performance Monitoring Platform for OEE and Downtime ReductionMachine performance monitoring platform selection guide: validate machine states, OEE data, downtime reasons, integrations, and scalability to reduce losses with confidence.TSV Data Lab
 Oct 08, 2026How to Machine Inconel 625 Blades Without Heat Cracks or Edge ChippingInconel 625 blade machining guide: prevent heat cracks, edge chipping, chatter, and work hardening with proven tooling, cooling, fixturing, and inspection strategies.Dr. Marcus Vance
 Oct 07, 2026How to Evaluate an HMI Panel Distributor for Industrial Automation ProjectsHMI panel distributor evaluation guide: verify technical compatibility, traceability, supply reliability, lifecycle support, and total cost for automation projects.Victor Lin (Chief Software Architect)
 Oct 06, 2026Navigation Fault Tolerance Standards for AMRs: What Safety Teams Must VerifyNavigation fault tolerance standards: learn what AMR safety teams must verify, from localization loss and sensor faults to stopping distance, safe restart, and site-specific validation.Chen Wei (Automation Lead Engineer)
 Oct 05, 2026Calculating Edge Computing Total Cost of Ownership Across Distributed SitesEdge computing ownership cost explained: calculate deployment, energy, connectivity, security, remote support, and refresh costs across distributed sites.TSV Data Lab
 Oct 04, 2026CAD/CAM Benchmarking in the GCC: What Manufacturers Should Ask a ConsultantCAD CAM benchmark consultant GCC guide: learn the key questions manufacturers should ask to validate post-processors, workflows, machine performance, and production risk.Victor Lin (Chief Software Architect)
 Oct 03, 2026Selecting Automotive Radar Sensor Modules for ADAS Range, Resolution, and IntegrationAutomotive radar sensor module selection guide for ADAS: compare range, resolution, field of view, latency, and integration to build safer, reliable vehicle systems.TSV Data Lab
 Oct 02, 2026How to Qualify Machined Parts Suppliers for Hard Tech ProgramsHard tech supply chain machined parts demand rigorous supplier qualification. Learn how to assess capability, traceability, quality controls, and delivery resilience.Dr. Marcus Vance
 Oct 01, 2026How to Select an Outdoor Security Radar Sensor for Perimeter Detection?Outdoor security radar sensor selection guide: compare range, accuracy, false-alarm control, integration, and field testing for reliable perimeter detection.TSV Data Lab
 Sep 30, 2026How to Evaluate Solid-State LiDAR Hardware for Outdoor Autonomous VehiclesSolid state LiDAR hardware evaluation guide for outdoor autonomous vehicles—compare range, point-cloud quality, environmental resilience, integration, and safety.TSV Data Lab
 Sep 29, 2026ISO 9283 Repeatability: How to Evaluate Cobot Positioning PerformanceISO 9283 cobot repeatability explained: learn how payload, reach, approach direction, and test conditions affect positioning performance and cell capability.Chen Wei (Automation Lead Engineer)
 Oct 14, 2026How tight can micro machining aerospace tolerances be in production?Micro machining aerospace tolerances can reach low-micron levels in production. Learn what controls repeatability, inspection confidence, and flight-critical quality.Dr. Marcus Vance
 Oct 13, 2026How to keep an industrial robotic integration project on scheduleIndustrial robotic integration project management: keep automation on schedule with proven controls for interfaces, suppliers, FAT, commissioning, and change risk.Victor Lin (Chief Software Architect)























