Edge AI inference latency gets worse when camera streams scale up
Publication Date
author
When camera counts rise at the edge, even well-tuned systems can suffer sudden performance loss. This article examines why edge ai inference latency industrial worsens under multi-stream workloads, and how factors like opc ua server response time, mqtt broker payload size limit, 5g industrial router throughput test, and industrial iot dashboard visualization shape real-world deployment risk for engineers, buyers, operators, and decision-makers.
Why does edge AI inference latency rise so quickly when camera streams increase?
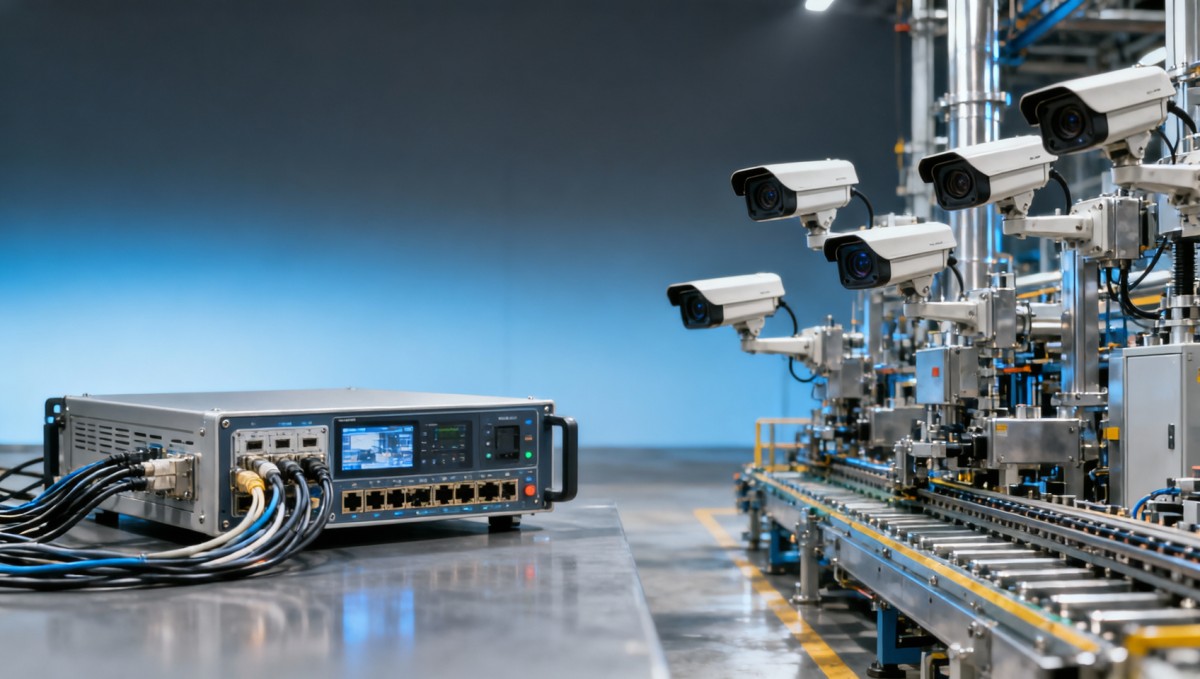
In industrial edge deployments, latency rarely grows in a neat linear curve. A system that runs 2 camera feeds smoothly can degrade sharply at 6, 8, or 12 streams because the bottleneck is not only the inference model. The full path includes image acquisition, decode, preprocessing, memory transfer, scheduling, inference, post-processing, message publishing, and visualization. Once one stage saturates, queue depth expands and end-to-end delay rises fast.
For operators, the problem appears as delayed alarms, missed defects, or unstable frame rates. For procurement teams, it shows up later as underperforming hardware that looked adequate on a spec sheet. For enterprise decision-makers, the risk is larger: a proof of concept may pass at 2–4 streams, while plant rollout at 10–20 streams exposes hidden throughput ceilings in compute, storage, or networking.
TSV’s engineering-centered view is simple: parameters do not lie. The useful question is not whether a device supports edge AI, but under what test conditions it supports it. Was latency measured at batch size 1 or higher? Was the result based on a single 1080p stream, or on 8 simultaneous streams with image logging enabled? Was network traffic isolated, or shared with OPC UA, MQTT, and dashboard traffic?
In practice, industrial users should evaluate latency in three layers: model latency, pipeline latency, and decision latency. Model latency may remain within 15–30 ms, yet pipeline latency can climb beyond 120–300 ms when decode and buffer pressure increase. Decision latency may become even higher if opc ua server response time fluctuates under load or if industrial iot dashboard visualization consumes additional CPU and memory resources on the same edge node.
The main failure points are usually outside the neural network
Many teams optimize the model but ignore system plumbing. In multi-stream environments, decode pipelines, shared memory bandwidth, storage writes, and container orchestration overhead often become the dominant delay source. This is especially true when the device also handles protocol translation, historian uploads, or dashboard rendering on the same hardware.
A practical engineering checklist should examine at least 5 dimensions: camera codec, stream resolution, frames per second, model precision, and outbound data policy. A 720p stream at 10–15 fps behaves very differently from a 1080p or 4MP stream at 25–30 fps. The step from 4 to 8 streams is not just a doubling of camera count; it may multiply decode pressure, memory copy volume, and publish frequency across the entire stack.
- Image decode load increases before inference starts, especially with H.264 and H.265 streams decoded in software rather than dedicated hardware blocks.
- Shared memory contention becomes visible when multiple streams need parallel preprocessing, tensor conversion, and post-processing.
- Protocol and visualization tasks can create bursty interference, particularly when MQTT publishing and dashboards refresh every 1–5 seconds.
Which technical parameters actually matter in multi-stream industrial edge systems?
Spec sheets often overemphasize TOPS while underexplaining the conditions behind sustained throughput. In multi-camera applications, engineers and buyers should inspect balanced system metrics rather than a single accelerator number. Compute matters, but so do memory bandwidth, decode capability, NIC performance, protocol overhead, thermal behavior, and storage write endurance during event recording.
The table below highlights practical metrics that influence edge ai inference latency industrial performance under scaling conditions. These are not vendor-specific promises; they are evaluation dimensions that help separate marketing claims from deployable engineering reality.
This table shows why isolated AI benchmarks can mislead procurement decisions. A device may be sufficient for 4 streams in a clean lab, yet fail when the same box handles event logging, protocol conversion, and remote dashboard access. TSV recommends judging systems by sustained operating windows such as 8-hour, 24-hour, or 7-day stability runs rather than short demo bursts.
How OPC UA, MQTT, 5G routing, and dashboards add hidden delay
In industrial edge nodes, AI does not run in isolation. An inspection gateway may publish events through MQTT, write production status to an OPC UA layer, and send summaries to cloud or remote sites through a 5G industrial router. At the same time, local users may access industrial iot dashboard visualization for status checks, image review, and alarm acknowledgment. Each service looks small alone, but together they can reshape latency behavior.
The key issue is contention. If opc ua server response time rises from tens of milliseconds to several hundred milliseconds during production peaks, the system may queue writes and delay downstream actions. If the mqtt broker payload size limit is too high, users may begin sending oversized JSON packets or image snippets that increase network overhead and memory pressure. If a 5g industrial router throughput test was performed only under ideal RF conditions, the field result may be far lower when cells are congested or antenna placement is poor.
Typical interaction map for a loaded edge node
- Camera ingest: 4–16 streams enter through RTSP or industrial vision interfaces and begin decode plus buffer management.
- Inference pipeline: preprocessing, model execution, and post-processing consume accelerator, CPU, and RAM together.
- Operational messaging: MQTT event packets, OPC UA status updates, and dashboard refreshes compete for NIC and system scheduler time.
- Remote backhaul: 5G, Ethernet, or mixed networking introduces additional packet loss, retransmission, and throughput fluctuation risk.
For this reason, buyers should always request test disclosures that include protocol load and visualization load. If the benchmark excludes these tasks, the published latency number is only partial. In factories, mines, logistics yards, and UAV ground stations, end-to-end timing is what matters, not an isolated inference screenshot.
How should teams compare deployment architectures before purchasing?
A common procurement mistake is assuming that more compute alone solves scaling. In reality, architecture selection determines whether latency remains stable as camera count grows. Some use cases fit a single integrated edge box, while others require a split design with dedicated inference, protocol, and visualization layers. The correct choice depends on stream count, response target, available network, and maintenance model.
The comparison below helps information researchers, operators, and sourcing teams judge which architecture fits different operating conditions. It also clarifies where costs are likely to appear later, especially during expansion from pilot lines to multisite deployment.
The right architecture is usually the one that preserves predictable latency under realistic load, not the one with the most attractive single-unit benchmark. For example, separating dashboard rendering from real-time inference can reduce jitter during operator-heavy shifts. Likewise, routing image thumbnails differently from alarm metadata can keep MQTT traffic lean and reduce payload-related delays.
Procurement questions that expose hidden risk
Before purchase approval, teams should insist on workload disclosure in clear engineering terms. Ask how many simultaneous streams were tested, at what resolution, codec, and fps. Ask whether event storage, protocol translation, and dashboard access were active during the test. Ask how the 5g industrial router throughput test was performed and whether uplink and downlink were both characterized across variable signal conditions.
- Request an end-to-end latency range, not only model latency. A practical answer should separate decode, inference, post-process, and message delivery stages.
- Confirm protocol behavior under load. Ask for opc ua server response time and MQTT publish delay when camera count is at target scale, not pilot scale.
- Check thermal and stability conditions over 8–24 hours. Short tests can hide throttling, queue buildup, or packet retransmission problems.
- Review expansion path from current stream count to the next 50%–100% growth step without replacing the whole stack.
What implementation steps reduce latency risk before full-scale rollout?
Successful projects treat validation as a staged engineering process rather than a one-time demo. A realistic deployment plan usually moves through 3 phases: lab characterization, pilot under production traffic, and controlled scale-up. Each phase should measure not only average delay, but also p95 or worst-case behavior during shift changes, batch transitions, or network bursts.
The first phase should define the operating envelope: number of cameras, stream settings, event rate, logging policy, and control-system integration scope. The second phase should introduce plant traffic, including OPC UA reads and writes, MQTT alarms, dashboard users, and remote backhaul. The third phase should raise stream count by practical steps such as 4 to 8, or 8 to 12, while tracking whether latency remains inside the required action window.
For operators, the most useful KPI is often actionability, not raw milliseconds. If a reject gate, robot pick path, or operator alert requires feedback within 150–250 ms, then the full system must be validated against that threshold. A model result arriving in 20 ms has little value if decode, queueing, and messaging push the final control signal beyond the process tolerance.
TSV’s data-first method supports this kind of deployment discipline. Instead of relying on generic performance claims, technical teams should benchmark the complete path and write procurement criteria directly from measured conditions. That approach reduces R&D trial-and-error cost and shortens supplier qualification cycles because comparison is based on disclosed engineering parameters rather than broad marketing language.
A practical rollout checklist for engineering and sourcing teams
- Define 4 core acceptance items: target camera count, required end-to-end latency, message publish interval, and retention or logging policy.
- Validate network assumptions: Ethernet only, mixed Wi-Fi, or 5G uplink. Each path changes packet stability and retransmission behavior.
- Constrain mqtt broker payload size limit for event traffic so payload growth does not silently erode throughput.
- Separate critical services where possible: inference, dashboard rendering, and heavy historical data sync should not all peak on the same node.
- Document fallback behavior for overload, such as dropping noncritical frames, reducing dashboard refresh frequency, or switching to metadata-only messaging.
FAQ: what do engineers, buyers, and decision-makers ask most often?
The most frequent questions around edge ai inference latency industrial systems usually combine technical uncertainty with procurement pressure. Teams need answers that connect architecture, parameters, deployment risk, and budget impact. The following questions are especially relevant when camera scaling, protocol integration, and remote connectivity all matter at the same time.
How many camera streams can one edge AI device realistically handle?
There is no universal number because capacity depends on resolution, fps, codec, model size, and side services. A box that handles 8 streams at 720p and 10 fps may struggle with 4 streams at higher resolutions plus dashboard and protocol traffic. The right method is to define a target envelope and validate it under realistic conditions for 8–24 hours, not to rely on a single nominal stream count.
Why does opc ua server response time matter if the model is fast?
Because operational action depends on the whole chain. If the model detects a defect but status propagation through OPC UA slows during peak load, the process response can still miss its timing window. In manufacturing and inspection lines, control relevance often depends on final signal delivery, not just on inference completion.
What should buyers check in a 5G industrial router throughput test?
They should ask whether the test covered both uplink and downlink, what signal conditions were present, and whether traffic resembled real workloads such as image snapshots, event bursts, and dashboard access. A useful test should also disclose latency variation, not only peak throughput, because unstable uplink behavior can affect alarm delivery and remote visualization quality.
Can industrial iot dashboard visualization really affect inference latency?
Yes, especially on compact edge nodes. Dashboards consume CPU cycles, memory, storage, and network bandwidth. If refresh intervals are aggressive or if multiple users open image-rich pages at once, contention can appear. Separating dashboard services or reducing refresh frequency from 1 second to 5 seconds can sometimes stabilize overloaded systems without changing the AI model.
Why work with TSV when evaluating edge AI latency, procurement criteria, and deployment readiness?
TechStat Vanguard focuses on engineering truth rather than promotional language. For teams assessing edge AI systems in manufacturing, logistics, UAV support, smart sensing, or industrial automation, that means a stronger basis for specification writing, supplier filtering, and rollout planning. The goal is not to label every product as suitable, but to identify where tolerance, throughput, and latency claims hold under real operating constraints.
If your organization is comparing edge boxes, protocol gateways, camera topologies, or remote connectivity strategies, TSV can help structure the evaluation around measurable items: stream count targets, latency windows, opc ua server response time under load, mqtt broker payload size limit policies, 5g industrial router throughput test conditions, and the overhead created by industrial iot dashboard visualization. This is especially useful when internal teams span R&D, operations, sourcing, and executive approval.
You can consult TSV for parameter confirmation, deployment architecture comparison, supplier shortlist criteria, delivery-cycle planning, custom validation frameworks, and integration risk review. If you are still in early research, TSV can help turn broad requirements into a practical spec sheet. If you are already in procurement, TSV can help you compare proposals using workload-based engineering evidence instead of headline claims.
For teams preparing the next step, the most productive discussion usually starts with 6 items: planned camera count, stream settings, target response window, protocol stack, remote connectivity method, and expected expansion horizon over the next 12–24 months. With those inputs, procurement and technical decisions become clearer, and latency risk becomes something measurable and manageable rather than something discovered after installation.
Search News
Hot Articles
- Carbon Fiber StructuresHow to Specify Aerospace Carbon Fiber Assemblies for Lightweight, Load-Bearing PartsJul 11, 2026
- Machine VisionXiaomi, Alibaba DAMO Academy Drive Open-Source Robotics Model Ecosystem, Lowering Algorithm Development Barriers for Overseas SMEs Adopting Chinese Robotics SolutionsMar 30, 2026
- Cobots & ArmsShanxi 'AI+' Conference Showcases Embodied Intelligence with Multinational Buyer Engagement: Key Industry ImplicationsMar 30, 2026
Popular Tags
Recommended News
 Jul 11, 2026How to Specify Aerospace Carbon Fiber Assemblies for Lightweight, Load-Bearing PartsAerospace carbon fiber assemblies: learn how to specify laminate design, load data, joining methods, and inspection controls for lighter, reliable load-bearing aerospace parts.Elena Rostova (UAV Systems Researcher)
 Mar 30, 2026Xiaomi, Alibaba DAMO Academy Drive Open-Source Robotics Model Ecosystem, Lowering Algorithm Development Barriers for Overseas SMEs Adopting Chinese Robotics SolutionsXiaomi & Alibaba DAMO Academy's open-source robotics models lower algorithm barriers for global SMEs. Boost efficiency in manufacturing, logistics & smart retail with ROS 2 compatible solutions.TSV Data Lab
 Mar 30, 2026Shanxi 'AI+' Conference Showcases Embodied Intelligence with Multinational Buyer Engagement: Key Industry ImplicationsShanxi 'AI+' Conference highlights embodied intelligence with Tesla, Ubtech & Jiantao showcasing multimodal robotics. 40+ global buyers validated tech on-site, creating new B2B channels for industrial automation & AI solutions.Chen Wei (Automation Lead Engineer)
 Mar 30, 2026Zhongguancun Unveils 6G Integrated Sensing-Computing-Intelligence Platform to Empower Embodied Robots for Global Industrial ApplicationsZhongguancun's new 6G platform revolutionizes industrial robotics with <10ms latency, empowering global automotive, logistics & port automation. Discover how this tech boosts China's smart manufacturing exports.TSV Data Lab
 Mar 30, 2026Mech-Mind Tianjin Embodied Intelligence R&D and Production Base Goes Live, Cutting Delivery Time by 20%–30% for Global Customized AMR+Vision SolutionsMech-Mind's Tianjin AMR+Vision production base cuts delivery time by 20%-30% for欧美 & Latin American markets. Discover how this PLd-certified facility accelerates customized robotics solutions for smart manufacturing and logistics.Chen Wei (Automation Lead Engineer)
 Mar 30, 2026Boao Forum Reveals 'Co-evolution of Big and Small Brains' Trend in Humanoid Robots, China's Embodied Intelligence Accelerates Adaptation to Overseas Manufacturing Service ScenariosDiscover how China's humanoid robots, featuring 'Co-evolution of Big and Small Brains,' are revolutionizing global manufacturing. Learn about Embodied Tian Gong 3.0's ISO compliance and overseas deployment at Boao Forum 2026.Chen Wei (Automation Lead Engineer)
 Mar 30, 2026China Railway Industrial Secures Patent for Embodied Robotics in Material Handling, Boosting High-Precision Delivery Capabilities for Overseas Infrastructure and Manufacturing ProjectsChina Railway Industrial's new patent for embodied robotics in material handling boosts high-precision delivery for global infrastructure & manufacturing. Discover how this innovation enhances logistics accuracy in automotive, rail transit & EPC projects.Chen Wei (Automation Lead Engineer)
 Oct 13, 2026Smart Cameras vs. PC-Based Machine Vision: Which Fits High-Speed Inspection?This industrial product comparison for machine vision weighs smart cameras vs. PC-based systems on latency, throughput, and cost. Discover your best fit for high-speed inspection.TSV Data Lab
 Oct 12, 2026How to Verify RoHS Compliance in Industrial Sensing Systems Before DeploymentRoHS compliant sensing systems: learn how to verify materials, supplier declarations, testing, and configuration controls before industrial deployment.TSV Data Lab
 Oct 11, 2026How Procurement-Oriented Content Taxonomy Improves B2B Buying JourneysProcurement-oriented content taxonomy streamlines B2B buying journeys with clearer evidence, supplier comparisons, risk visibility, and faster approvals.TSV Data Lab
 Oct 10, 2026How to Select a Machine Performance Monitoring Platform for OEE and Downtime ReductionMachine performance monitoring platform selection guide: validate machine states, OEE data, downtime reasons, integrations, and scalability to reduce losses with confidence.TSV Data Lab
 Oct 08, 2026How to Machine Inconel 625 Blades Without Heat Cracks or Edge ChippingInconel 625 blade machining guide: prevent heat cracks, edge chipping, chatter, and work hardening with proven tooling, cooling, fixturing, and inspection strategies.Dr. Marcus Vance
 Oct 07, 2026How to Evaluate an HMI Panel Distributor for Industrial Automation ProjectsHMI panel distributor evaluation guide: verify technical compatibility, traceability, supply reliability, lifecycle support, and total cost for automation projects.Victor Lin (Chief Software Architect)
 Oct 06, 2026Navigation Fault Tolerance Standards for AMRs: What Safety Teams Must VerifyNavigation fault tolerance standards: learn what AMR safety teams must verify, from localization loss and sensor faults to stopping distance, safe restart, and site-specific validation.Chen Wei (Automation Lead Engineer)
 Oct 05, 2026Calculating Edge Computing Total Cost of Ownership Across Distributed SitesEdge computing ownership cost explained: calculate deployment, energy, connectivity, security, remote support, and refresh costs across distributed sites.TSV Data Lab
 Oct 04, 2026CAD/CAM Benchmarking in the GCC: What Manufacturers Should Ask a ConsultantCAD CAM benchmark consultant GCC guide: learn the key questions manufacturers should ask to validate post-processors, workflows, machine performance, and production risk.Victor Lin (Chief Software Architect)
 Oct 03, 2026Selecting Automotive Radar Sensor Modules for ADAS Range, Resolution, and IntegrationAutomotive radar sensor module selection guide for ADAS: compare range, resolution, field of view, latency, and integration to build safer, reliable vehicle systems.TSV Data Lab
 Oct 02, 2026How to Qualify Machined Parts Suppliers for Hard Tech ProgramsHard tech supply chain machined parts demand rigorous supplier qualification. Learn how to assess capability, traceability, quality controls, and delivery resilience.Dr. Marcus Vance
 Oct 01, 2026How to Select an Outdoor Security Radar Sensor for Perimeter Detection?Outdoor security radar sensor selection guide: compare range, accuracy, false-alarm control, integration, and field testing for reliable perimeter detection.TSV Data Lab
 Sep 30, 2026How to Evaluate Solid-State LiDAR Hardware for Outdoor Autonomous VehiclesSolid state LiDAR hardware evaluation guide for outdoor autonomous vehicles—compare range, point-cloud quality, environmental resilience, integration, and safety.TSV Data Lab
 Sep 29, 2026ISO 9283 Repeatability: How to Evaluate Cobot Positioning PerformanceISO 9283 cobot repeatability explained: learn how payload, reach, approach direction, and test conditions affect positioning performance and cell capability.Chen Wei (Automation Lead Engineer)
 Oct 13, 2026How to keep an industrial robotic integration project on scheduleIndustrial robotic integration project management: keep automation on schedule with proven controls for interfaces, suppliers, FAT, commissioning, and change risk.Victor Lin (Chief Software Architect)
 Oct 12, 2026What should be included in predictive maintenance pricing for factories?Predictive maintenance pricing for factories: compare sensors, software, integration, support, and total cost to secure measurable uptime gains and avoid hidden expenses.TSV Data Lab
 Oct 11, 2026How payload and reach change the cost of an industrial robotCost of industrial robot systems depends heavily on payload and reach. Learn how sizing, torque, tooling, safety, and lifecycle factors shape smarter automation investments.Chen Wei (Automation Lead Engineer)