What a CODESYS latency test should include in 2026
Publication Date
author
In 2026, a credible CODESYS latency test must go beyond simple cycle timing and examine real-world bottlenecks across edge control, networking, and visualization. From codesys runtime latency test and opc ua server response time to ethercat cycle time benchmark, mqtt broker payload size limit, and edge ai inference latency industrial, engineers and buyers need measurable data—not claims—to evaluate deterministic performance, integration risk, and long-term scalability.
That shift matters across modern manufacturing, robotics, process automation, and edge-connected machine fleets. A single latency number taken from an idle lab bench says little about how a controller behaves when 200 tags are published through OPC UA, an HMI is refreshing every 250 ms, and an EtherCAT segment is running near its practical device count. For operators, this is a usability issue. For procurement teams, it is a qualification issue. For CTOs, it is a system architecture risk.
At TechStat Vanguard, the useful question is not whether a platform can deliver low latency in theory. The question is whether the test method exposes where latency starts to drift, how jitter accumulates under load, and which interface becomes the limiting factor first. A 2026-ready CODESYS latency test should therefore be structured as an engineering benchmark, not a marketing demo.
Why a 2026 CODESYS latency test must reflect full-stack operating conditions
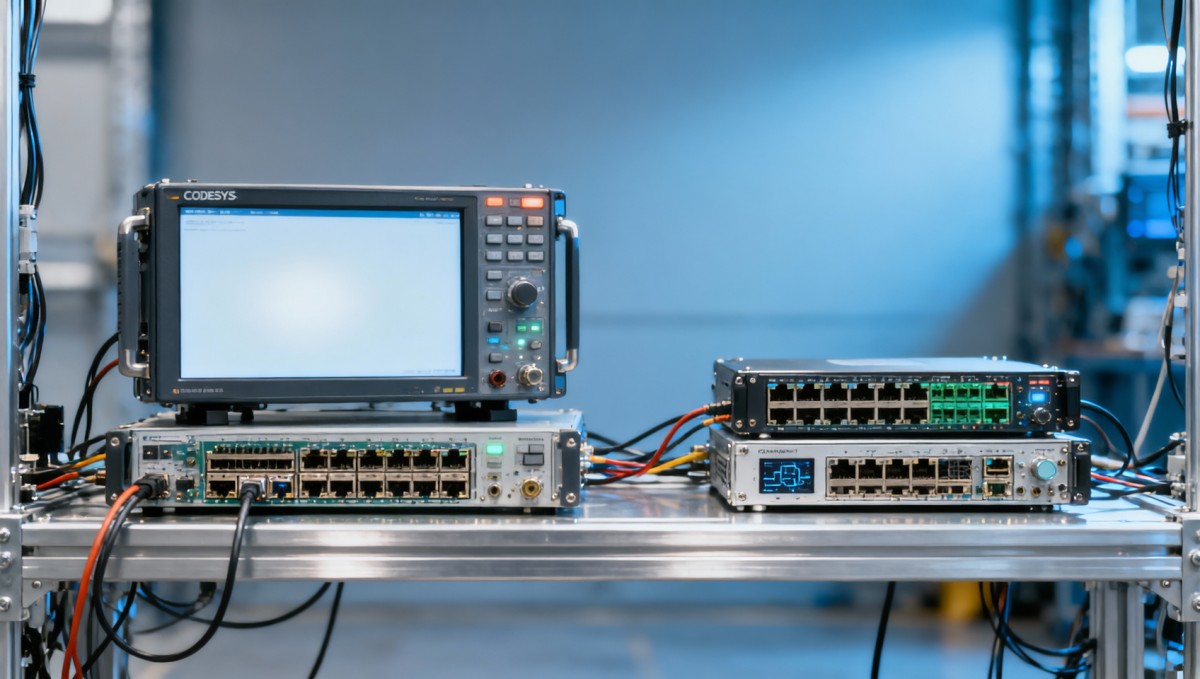
In many industrial projects, latency is no longer confined to PLC scan time. The control layer now interacts with edge IPCs, industrial Ethernet, protocol gateways, vision pipelines, and cloud-adjacent telemetry brokers. If a benchmark only measures a bare codesys runtime latency test on an unloaded controller, it ignores the reality that deterministic performance is shaped by multiple stacked services. In 2026, the relevant benchmark window is often 250 µs to 20 ms depending on motion, sequencing, analytics, and visualization demands.
For machine builders, the biggest blind spot is often load coupling. A runtime that holds a 1 ms task in isolation may show rising jitter once OPC UA subscriptions exceed 100 to 300 variables, or when MQTT publishes are triggered at 10 Hz to 50 Hz with structured payloads. That does not automatically make the platform unsuitable, but it changes sizing decisions, network design, and the acceptable HMI refresh budget.
For plant operators, latency drift often appears first as inconsistent response rather than total failure. An alarm may arrive 400 ms later than expected, a trend view may skip samples, or an edge AI result may miss the next actuation window. These are practical symptoms that should be reproduced inside the test design. A strong benchmark should include baseline, loaded, and stress phases over at least 30 to 60 minutes each rather than a single short run.
For buyers comparing vendors or hardware platforms, a useful benchmark also separates average latency from worst-case events. A controller showing 1.2 ms average latency but 18 ms spikes every few minutes may be more risky than a system holding 2.5 ms consistently. Determinism is about repeatability under realistic contention, not only headline speed.
Core conditions the test environment should simulate
- At least 3 workload states: idle, nominal production load, and overload or burst traffic.
- Task classes at multiple cycles, such as 500 µs, 1 ms, 4 ms, and 10 ms, to reveal where scheduling begins to degrade.
- Mixed communication traffic including OPC UA, fieldbus, and publish-subscribe messaging rather than one protocol alone.
- A minimum 24-hour soak option for systems intended for continuous operation in packaging, material handling, or process cells.
What stakeholders want from the same benchmark
The key takeaway is simple: a 2026 CODESYS latency test should produce evidence that different functions can coexist without destabilizing each other. That means the benchmark must expose control, communications, and visualization together, because that is how industrial systems are actually deployed.
The minimum technical scope: from runtime timing to protocol and bus behavior
A modern benchmark should start with the codesys runtime latency test, but it cannot end there. The runtime layer should be measured for task execution time, jitter, missed deadlines, and scheduler stability at several cycle classes. In practical acceptance work, engineers often look for a 99th percentile figure in addition to average values. A system that stays within 1.5x of target cycle time at the 99th percentile is usually easier to qualify than one with occasional 5x outliers.
The next required layer is opc ua server response time. This should be tested with different node counts, subscription intervals, and client concurrency. For example, response behavior with 50 variables and 1 client is not representative if the intended deployment uses 500 variables, 4 clients, historical buffering, and certificate-based security. Engineers should document latency at update intervals such as 100 ms, 250 ms, and 1000 ms, because the acceptable threshold varies sharply by use case.
An ethercat cycle time benchmark is equally important where motion, synchronized I/O, or distributed drives are involved. Here, the test must state the number of nodes, topology, cabling quality, and cycle target. A benchmark at 250 µs with 8 devices tells a different story from 1 ms with 40 devices. The useful result is not just whether the bus starts, but how much timing headroom remains once the application, diagnostics, and communications layers are active.
MQTT also deserves a formal place in the benchmark because many edge deployments now publish machine status, alarms, and compact analytics upstream. A credible test should evaluate mqtt broker payload size limit in practice, not only by specification. Small 1 KB payloads at 20 Hz behave very differently from 64 KB JSON bursts every 2 seconds. Both bandwidth consumption and CPU overhead should be recorded, especially if TLS is enabled.
Recommended latency dimensions to measure
This scope gives teams a benchmark map rather than a single score. That is essential for procurement and design reviews, because the weak point may not be the PLC runtime itself. In many projects, the first constraint appears in protocol handling, tag serialization, or overloaded bus timing rather than raw controller execution.
A useful acceptance threshold mindset
Instead of asking for one “best” number, buyers should request threshold bands. For example: sub-2 ms control jitter under nominal load, sub-150 ms OPC UA read response for 250 tags, and no deadline misses over a 24-hour soak at declared configuration. These thresholds are far more actionable than generic latency claims because they align with deployment conditions and acceptance criteria.
How to test edge AI, visualization, and message load without distorting results
By 2026, many CODESYS-based architectures will sit beside machine vision, anomaly detection, or compact inference services at the edge. That means edge ai inference latency industrial can directly affect whether a result is useful for closed-loop or supervisory action. A benchmark should therefore define where AI sits in the chain: on the same IPC, on a companion edge computer, or behind a gateway. Each location changes CPU contention, memory pressure, and network delay.
Visualization is another frequently underestimated source of load. When an HMI or web dashboard polls aggressively, refreshes trends every 250 ms, and pushes alarm histories, the system can experience measurable latency inflation. A credible test should include at least two visualization profiles: an operator panel profile and an engineering or diagnostics profile. The first may involve 100 to 300 tags, while the second may exceed 800 tags with trend retrieval and device diagnostics active.
The benchmark also needs to avoid self-inflicted distortion. If measurement tools consume significant CPU or share the same core allocation as the runtime, the results become less trustworthy. Time synchronization, logging granularity, and trace overhead should be declared up front. In strong test plans, instrumentation overhead is checked first, then held constant across all scenarios so comparisons remain valid.
For procurement teams, this matters because scalability decisions often depend on whether one box can safely host runtime, OPC UA, MQTT, and lightweight inference together. If the test shows latency rising sharply once inference occupies 25% to 35% CPU, that finding can justify a split architecture before commissioning delays appear on site.
Practical workload design for a realistic benchmark
- Start with a clean baseline using runtime plus local I/O only for 30 minutes.
- Add OPC UA subscriptions in staged blocks such as 100, 250, and 500 tags.
- Enable MQTT publishing at fixed intervals, for example 1 Hz, 10 Hz, and burst mode every 2 seconds.
- Introduce visualization refresh and historian or trend queries.
- Add edge inference with declared model size, input frequency, and CPU or accelerator usage.
Example of what should be documented in the report
The interpretation should focus on interaction effects. If inference latency remains stable but PLC jitter doubles during dashboard polling, the true limitation may be shared memory bandwidth or thread scheduling, not AI alone. This is exactly why a layered test plan is more useful than isolated component benchmarking.
Common testing mistakes, procurement red flags, and selection criteria
One of the most common mistakes is accepting vendor latency numbers without context. A figure such as “sub-millisecond” is nearly meaningless unless the hardware class, task count, network load, and protocol services are declared. Buyers should ask whether the number reflects average or maximum latency, whether the run lasted 5 minutes or 24 hours, and whether communication stacks were active. Without those details, comparisons across suppliers are weak.
Another mistake is testing only best-case Ethernet conditions. In real factories, switch queues, VLAN policy, EMI exposure, and mixed traffic can affect behavior. Even if the benchmark stays inside a lab, it should include at least one constrained network scenario, such as shared uplink traffic or increased packet rate. This does not replace field validation, but it reduces the risk of qualifying a design on unrealistic assumptions.
Procurement teams also need to separate technical fit from overbuying. Some applications need strict 250 µs to 1 ms determinism, especially in coordinated motion or time-sensitive I/O. Others are comfortable with 10 ms to 50 ms supervisory timing. If a benchmark does not classify workloads by application tier, buyers may spend significantly more on performance they do not use or, worse, underspecify a controller for future integration demands.
A better selection process is to request evidence against a declared growth path. For example, ask how the platform behaves today at 150 I/O points, 1 HMI, and 1 OPC UA client, then at a 24-month target of 400 I/O points, 3 clients, MQTT publishing, and optional edge analytics. Scalability under planned expansion is often a better buying metric than raw initial speed.
Red flags in benchmark presentations
- No declaration of hardware CPU class, memory, or operating environment.
- Only average latency shown, with no max, jitter, or percentile distribution.
- No mention of tag count, client concurrency, or message payload size.
- EtherCAT results presented without node count, topology, or cycle target.
- No soak test longer than 30 minutes for systems intended to run 24/7.
A buyer-oriented decision matrix
In practice, the best procurement outcome comes from aligning benchmark evidence with the intended production envelope. The goal is not to buy the fastest system on paper, but the most predictable platform for the required workload, support model, and future integration path.
A reporting framework engineers and decision-makers can actually use
A useful CODESYS latency report should be structured so that engineering, operations, and purchasing can all make decisions from the same document. That means the first page should summarize hardware, software version, operating mode, task classes, network architecture, and test duration. It should also state whether the benchmark is for bare control, mixed communication, or edge-enabled deployment. Without this context, even accurate raw numbers are hard to compare.
The technical body should then present results in progressive layers: runtime, bus, OPC UA, MQTT, visualization, and optional edge AI. Each layer should include both declared load and observed impact on the others. This cross-effect view is essential because buyers are rarely purchasing one isolated feature. They are purchasing a system that must remain stable while multiple services run together for years, often with changing software loads after commissioning.
From an implementation perspective, the report should also specify recommended operating limits. For example, it may state that a given platform is well suited for 1 ms control tasks with up to 250 OPC UA variables and light MQTT telemetry, but should use a split architecture for heavier analytics or high-frequency visualization. These recommendations make the benchmark actionable instead of merely descriptive.
Finally, the report should translate technical findings into decision language. That includes likely commissioning effort, expected tuning needs, and expansion headroom over the next 12 to 36 months. This is where engineering truth becomes commercially useful: measurable parameters guide both system design and supplier selection.
FAQ: What teams often ask before approving a platform
How long should a serious latency benchmark run?
For screening, 30 to 60 minutes per scenario is acceptable. For procurement approval of 24/7 production systems, a 24-hour soak is a stronger minimum. If the application includes batch changes, shift transitions, or scheduled data uploads, a 48-hour window can reveal issues that a short run misses.
Is average latency enough for selection?
No. Teams should review average, maximum, and percentile-based results, especially the 95th and 99th percentile. In deterministic control, rare spikes often matter more than the mean because they drive alarms, missed timing windows, and unstable operator experience.
When should edge AI be tested in the same benchmark?
If inference will run on the same industrial PC or share the same network path for actionable outputs, it should be part of the benchmark from the start. If AI is remote and non-critical, a separate performance test may be enough, but the control-side communication impact should still be measured.
Which metrics matter most for buyers who are not controls specialists?
Four metrics usually clarify the decision fastest: deadline miss count, worst-case runtime latency, opc ua server response time under declared tag load, and throughput or delay impact from MQTT plus visualization activity. Together, these indicate stability, interoperability, and room for future expansion.
A credible 2026 CODESYS latency test should therefore measure more than fast control loops. It should show how runtime timing, EtherCAT behavior, OPC UA responsiveness, MQTT payload handling, HMI refresh, and edge AI workloads interact under realistic operating conditions. That is the level of evidence engineers need for design confidence and the level of detail buyers need for responsible qualification.
If your team is comparing automation platforms, validating supplier claims, or building a benchmark specification for an upcoming project, TechStat Vanguard can help frame the test around measurable engineering thresholds rather than marketing language. Contact us to discuss a tailored evaluation matrix, review your target workload, or explore a more rigorous benchmarking approach for your next control and edge deployment.
Search News
Hot Articles
- Carbon Fiber StructuresHow to Specify Aerospace Carbon Fiber Assemblies for Lightweight, Load-Bearing PartsJul 11, 2026
- Machine VisionXiaomi, Alibaba DAMO Academy Drive Open-Source Robotics Model Ecosystem, Lowering Algorithm Development Barriers for Overseas SMEs Adopting Chinese Robotics SolutionsMar 30, 2026
- Cobots & ArmsShanxi 'AI+' Conference Showcases Embodied Intelligence with Multinational Buyer Engagement: Key Industry ImplicationsMar 30, 2026
Popular Tags
Recommended News
 Jul 11, 2026How to Specify Aerospace Carbon Fiber Assemblies for Lightweight, Load-Bearing PartsAerospace carbon fiber assemblies: learn how to specify laminate design, load data, joining methods, and inspection controls for lighter, reliable load-bearing aerospace parts.Elena Rostova (UAV Systems Researcher)
 Mar 30, 2026Xiaomi, Alibaba DAMO Academy Drive Open-Source Robotics Model Ecosystem, Lowering Algorithm Development Barriers for Overseas SMEs Adopting Chinese Robotics SolutionsXiaomi & Alibaba DAMO Academy's open-source robotics models lower algorithm barriers for global SMEs. Boost efficiency in manufacturing, logistics & smart retail with ROS 2 compatible solutions.TSV Data Lab
 Mar 30, 2026Shanxi 'AI+' Conference Showcases Embodied Intelligence with Multinational Buyer Engagement: Key Industry ImplicationsShanxi 'AI+' Conference highlights embodied intelligence with Tesla, Ubtech & Jiantao showcasing multimodal robotics. 40+ global buyers validated tech on-site, creating new B2B channels for industrial automation & AI solutions.Chen Wei (Automation Lead Engineer)
 Mar 30, 2026Zhongguancun Unveils 6G Integrated Sensing-Computing-Intelligence Platform to Empower Embodied Robots for Global Industrial ApplicationsZhongguancun's new 6G platform revolutionizes industrial robotics with <10ms latency, empowering global automotive, logistics & port automation. Discover how this tech boosts China's smart manufacturing exports.TSV Data Lab
 Mar 30, 2026Mech-Mind Tianjin Embodied Intelligence R&D and Production Base Goes Live, Cutting Delivery Time by 20%–30% for Global Customized AMR+Vision SolutionsMech-Mind's Tianjin AMR+Vision production base cuts delivery time by 20%-30% for欧美 & Latin American markets. Discover how this PLd-certified facility accelerates customized robotics solutions for smart manufacturing and logistics.Chen Wei (Automation Lead Engineer)
 Mar 30, 2026Boao Forum Reveals 'Co-evolution of Big and Small Brains' Trend in Humanoid Robots, China's Embodied Intelligence Accelerates Adaptation to Overseas Manufacturing Service ScenariosDiscover how China's humanoid robots, featuring 'Co-evolution of Big and Small Brains,' are revolutionizing global manufacturing. Learn about Embodied Tian Gong 3.0's ISO compliance and overseas deployment at Boao Forum 2026.Chen Wei (Automation Lead Engineer)
 Mar 30, 2026China Railway Industrial Secures Patent for Embodied Robotics in Material Handling, Boosting High-Precision Delivery Capabilities for Overseas Infrastructure and Manufacturing ProjectsChina Railway Industrial's new patent for embodied robotics in material handling boosts high-precision delivery for global infrastructure & manufacturing. Discover how this innovation enhances logistics accuracy in automotive, rail transit & EPC projects.Chen Wei (Automation Lead Engineer)
 Oct 15, 2026R&D Cost Reduction Services: How to Evaluate Fees, Savings, and ROIEvaluate R&D cost reduction services with confidence. Compare fees, verify savings, and calculate ROI without compromising performance. Discover how to choose a provider that delivers real value.Chen Wei (Automation Lead Engineer)
 Oct 15, 2026How Should You Compare TechStat Vanguard 5-Axis CNC Tolerances?TechStat Vanguard 5-axis CNC tolerance comparison: learn how to verify part accuracy, assess inspection evidence, and choose suppliers that reliably meet your drawing requirements.Dr. Marcus Vance
 Oct 14, 2026Drone Frame Composites: Carbon Fiber vs. Fiberglass for Weight and StiffnessExplore drone structural materials composites: compare carbon fiber and fiberglass for weight, stiffness, cost, and antenna compatibility. Find the right material for your drone frame.Elena Rostova (UAV Systems Researcher)
 Oct 13, 2026Smart Cameras vs. PC-Based Machine Vision: Which Fits High-Speed Inspection?This industrial product comparison for machine vision weighs smart cameras vs. PC-based systems on latency, throughput, and cost. Discover your best fit for high-speed inspection.TSV Data Lab
 Oct 12, 2026How to Verify RoHS Compliance in Industrial Sensing Systems Before DeploymentRoHS compliant sensing systems: learn how to verify materials, supplier declarations, testing, and configuration controls before industrial deployment.TSV Data Lab
 Oct 11, 2026How Procurement-Oriented Content Taxonomy Improves B2B Buying JourneysProcurement-oriented content taxonomy streamlines B2B buying journeys with clearer evidence, supplier comparisons, risk visibility, and faster approvals.TSV Data Lab
 Oct 10, 2026How to Select a Machine Performance Monitoring Platform for OEE and Downtime ReductionMachine performance monitoring platform selection guide: validate machine states, OEE data, downtime reasons, integrations, and scalability to reduce losses with confidence.TSV Data Lab
 Oct 08, 2026How to Machine Inconel 625 Blades Without Heat Cracks or Edge ChippingInconel 625 blade machining guide: prevent heat cracks, edge chipping, chatter, and work hardening with proven tooling, cooling, fixturing, and inspection strategies.Dr. Marcus Vance
 Oct 07, 2026How to Evaluate an HMI Panel Distributor for Industrial Automation ProjectsHMI panel distributor evaluation guide: verify technical compatibility, traceability, supply reliability, lifecycle support, and total cost for automation projects.Victor Lin (Chief Software Architect)
 Oct 06, 2026Navigation Fault Tolerance Standards for AMRs: What Safety Teams Must VerifyNavigation fault tolerance standards: learn what AMR safety teams must verify, from localization loss and sensor faults to stopping distance, safe restart, and site-specific validation.Chen Wei (Automation Lead Engineer)
 Oct 05, 2026Calculating Edge Computing Total Cost of Ownership Across Distributed SitesEdge computing ownership cost explained: calculate deployment, energy, connectivity, security, remote support, and refresh costs across distributed sites.TSV Data Lab
 Oct 04, 2026CAD/CAM Benchmarking in the GCC: What Manufacturers Should Ask a ConsultantCAD CAM benchmark consultant GCC guide: learn the key questions manufacturers should ask to validate post-processors, workflows, machine performance, and production risk.Victor Lin (Chief Software Architect)
 Oct 03, 2026Selecting Automotive Radar Sensor Modules for ADAS Range, Resolution, and IntegrationAutomotive radar sensor module selection guide for ADAS: compare range, resolution, field of view, latency, and integration to build safer, reliable vehicle systems.TSV Data Lab
 Oct 02, 2026How to Qualify Machined Parts Suppliers for Hard Tech ProgramsHard tech supply chain machined parts demand rigorous supplier qualification. Learn how to assess capability, traceability, quality controls, and delivery resilience.Dr. Marcus Vance
 Oct 01, 2026How to Select an Outdoor Security Radar Sensor for Perimeter Detection?Outdoor security radar sensor selection guide: compare range, accuracy, false-alarm control, integration, and field testing for reliable perimeter detection.TSV Data Lab
 Sep 30, 2026How to Evaluate Solid-State LiDAR Hardware for Outdoor Autonomous VehiclesSolid state LiDAR hardware evaluation guide for outdoor autonomous vehicles—compare range, point-cloud quality, environmental resilience, integration, and safety.TSV Data Lab
 Sep 29, 2026ISO 9283 Repeatability: How to Evaluate Cobot Positioning PerformanceISO 9283 cobot repeatability explained: learn how payload, reach, approach direction, and test conditions affect positioning performance and cell capability.Chen Wei (Automation Lead Engineer)