How to read OPC UA server response time without false confidence
Publication Date
author
When teams evaluate OPC UA server response time, the biggest risk is not slow data—it is false confidence created by incomplete tests, unstable loads, and misleading averages. For engineers, operators, buyers, and decision-makers, understanding what response time really means is essential to judging system reliability, scalability, and integration readiness in modern industrial environments.
Why does OPC UA server response time get misread so often?
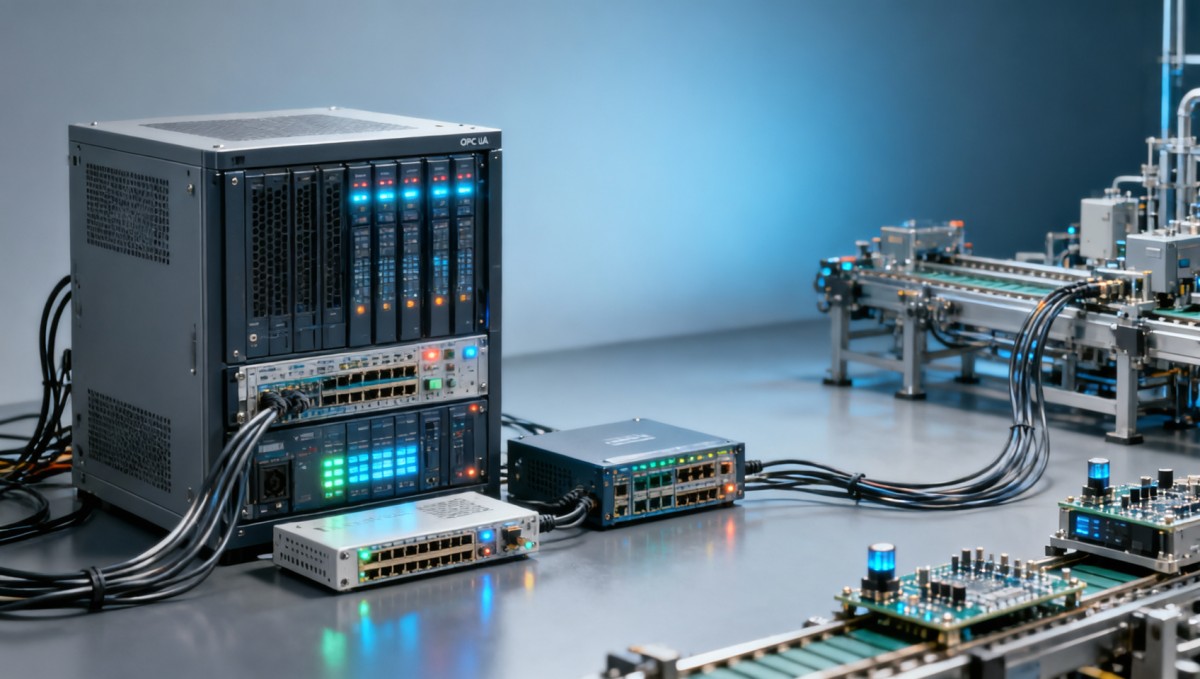
In industrial networks, response time is often treated as a single number, but in practice it is a chain of delays. A client request, server processing, device access path, network transit, security overhead, and client-side rendering all influence the observed result. If a team only sees one average value collected during a 10-minute light-load test, that number can look reassuring while hiding instability that appears after 4–8 hours of production traffic.
This matters across robotics, edge AI, CNC, UAV ground systems, and plant-wide automation because OPC UA often sits between data producers and the systems making operational or procurement decisions. A server that returns 40 ms during a demo can behave very differently at 250 monitored items, 1,000 tags, or 20 concurrent sessions. For information researchers, the danger is trusting vendor language that does not describe the test method. For operators, the danger is believing the HMI delay reflects the server alone.
False confidence usually starts with incomplete scope. Teams may measure only round-trip time from one client on the same subnet, ignore certificate-based security mode, skip historical access requests, or test with a warm cache but not cold startup conditions. In B2B purchasing, these omissions can distort supplier comparison and lead to expensive redesigns during FAT, SAT, or full-scale rollout.
TechStat Vanguard approaches this problem from a data-first benchmarking perspective. Instead of accepting broad claims such as “fast response” or “real-time ready,” TSV focuses on parameter discipline: request pattern, sampling interval, publish interval, session count, node count, packet path, and observation window. Parameters do not lie; unqualified averages do.
What response time really includes
A useful interpretation begins by separating three layers: application latency, protocol latency, and underlying system latency. Application latency includes what an operator sees on the HMI or SCADA screen. Protocol latency covers OPC UA request, publish, subscription handling, and security processing. Underlying system latency comes from PLC scan cycles, database reads, gateway translation, and network congestion. Without separating these layers, root-cause analysis becomes guesswork.
- Client-to-server request latency: useful for read or browse operations and ad hoc engineering access.
- Subscription update latency: more relevant for monitoring dashboards, alarms, and trend views.
- End-to-end control visibility delay: the combined delay from field event to operator screen or analytics engine.
When stakeholders discuss OPC UA server response time, they should specify which of these three they mean. A procurement sheet that asks only for “response time under normal conditions” is too vague for meaningful comparison.
Which metrics reduce false confidence better than a single average?
The first correction is simple: stop relying on average latency alone. In industrial environments, the median, 95th percentile, 99th percentile, jitter range, timeout rate, and stale data frequency often reveal more operational risk than the mean. Two servers can both report a 50 ms average while one stays within 45–60 ms and the other swings from 15 ms to 400 ms. For operators and decision-makers, the second server is far riskier even though the mean looks similar.
The second correction is to observe latency over meaningful durations. A 5–15 minute test can confirm connectivity, but it cannot validate production behavior. For a more realistic view, teams usually need at least three windows: short validation at 15–30 minutes, shift-level observation at 4–8 hours, and soak testing at 24–72 hours when the server supports critical lines, remote assets, or mixed historian and dashboard traffic.
The third correction is to report operating context together with the metric. A response time value without session count, security policy, item count, and update interval is incomplete. This is especially important in hard-tech procurement where engineering teams must compare gateways, embedded servers, edge devices, or software stacks from different suppliers under common test boundaries.
The table below summarizes a practical metric set for reading OPC UA server response time without false confidence.
This metric mix gives a more trustworthy basis for supplier evaluation. In many projects, a low average with a poor 99th percentile is worse than a slightly higher average with stable tails, because operations depend on predictability more than marketing-friendly peak numbers.
A practical interpretation model
For general industrial use, teams can think in three operational bands rather than one universal target. Sub-100 ms visibility can support many dashboard and status-monitoring tasks on well-designed local networks. Roughly 100–500 ms may still be acceptable for supervisory functions, reporting, and non-time-critical data exchange. Delays above that range may remain usable for historian collection or enterprise integration, but they need careful fit-for-purpose review.
These ranges are not guarantees and should never replace project-specific validation. A CNC cell, LiDAR edge pipeline, or aerospace test bench may have stricter timing expectations than a utility dashboard or maintenance portal. The point is not to force a single threshold, but to connect measured response time to the real application consequence.
How should you test OPC UA server response time in realistic operating conditions?
A trustworthy test design starts with controlled scenarios. Instead of one all-purpose benchmark, build at least three test profiles: baseline load, expected production load, and stress load. Baseline may involve 1–2 clients and 100–300 monitored items. Expected production might rise to 5–10 clients, 1,000–5,000 items, and mixed browsing plus subscriptions. Stress testing goes beyond planned operation to identify failure margins before commissioning.
The next step is to align sampling interval, publishing interval, and queue settings with actual use. If operators expect fresh status every 250 ms but the test runs at 1-second publishing, the result cannot validate the operator experience. If procurement plans future scaling to multiple production cells, the test should include growth factors rather than today’s minimum footprint only.
Security configuration must also be included. OPC UA security modes, encryption, certificate validation, and user authentication can alter throughput and response time. A benchmark done in unsecured lab mode may produce optimistic numbers that disappear in regulated or enterprise-segmented networks. This is one of the most common causes of false confidence during transition from pilot to deployment.
Finally, collect logs at multiple points. Server-side timestamps, client-side timestamps, switch counters, CPU and memory trends, and backend device cycle data help isolate whether the delay comes from the OPC UA stack, the host, the device interface, or the network. Without this, teams often replace the wrong component and still fail to solve the response problem.
A 4-step validation workflow
- Define the use case. Separate HMI monitoring, historian collection, MES integration, remote diagnostics, and engineering browse/read operations.
- Fix the test envelope. Record client count, item count, publish interval, security policy, network segment, and observation duration.
- Measure multiple indicators. Capture median, 95th percentile, timeout rate, and resource usage at 15 minutes, 8 hours, and 24 hours if the application is critical.
- Map results to consequences. Decide whether delays affect safety visibility, operator trust, production quality, or reporting freshness.
This workflow is especially useful for mixed environments where one server may feed dashboards, analytics, and procurement-driven proof-of-capability reviews at the same time.
Common test distortions to avoid
- Testing on the same machine or same switch while production will traverse VLANs, firewalls, or WAN links.
- Comparing read latency and subscription latency as if they were the same behavior.
- Ignoring CPU saturation, memory pressure, or storage bottlenecks in historians and gateway appliances.
- Using a tiny node set that does not resemble the production namespace.
What should buyers and decision-makers compare before selecting a server or supplier?
From a procurement standpoint, the goal is not merely to buy a server with a fast demo value. The goal is to select a solution that can maintain credible performance across its expected lifecycle: pilot, scale-up, maintenance, and integration with adjacent systems. That means comparing not just latency claims but also test transparency, scalability method, security overhead disclosure, and support for troubleshooting.
This is where many teams overpay or under-specify. A low-cost option may appear attractive if the quote lists only node capacity and protocol support, but if there is no clear statement on concurrent sessions, sustained polling behavior, or diagnostic visibility, qualification risk increases. Conversely, a higher-priced option may be justified if it reduces engineering trial-and-error, shortens FAT cycles by 2–4 weeks, or avoids unplanned edge gateway replacement later.
For enterprise decision-makers, comparison must be tied to business exposure. Ask what happens if 99th percentile latency spikes during a production shift. Does it create operator confusion, delayed alarms, missed event correlation, or poor confidence in machine data? In advanced manufacturing, the cost of ambiguity can exceed the visible cost of hardware or licensing.
The following procurement matrix helps separate marketing language from engineering reality.
A disciplined comparison like this is aligned with TSV’s engineering-benchmarking philosophy. Instead of buying confidence from adjectives, buyers can buy confidence from traceable test conditions and measurable limits.
Three procurement signals that deserve extra attention
First, look for explicit test boundaries. If a supplier cannot state the node count, update interval, or observation period behind the quoted response time, that value should not be used for selection. Second, review behavior under mixed workloads, not single-purpose tests. Third, assess whether the supplier can support a staged validation plan from proof of concept to site acceptance within realistic timelines such as 2–6 weeks depending on system complexity.
These signals matter in integrated hard-tech ecosystems where one weak data layer can affect automation, edge inference, maintenance analytics, or quality reporting across multiple teams.
Which misconceptions cause the most expensive mistakes?
The first misconception is that faster is always better. For many industrial applications, stable and fit-for-purpose response is more valuable than the lowest possible latency. Chasing unrealistically low numbers can push teams toward unnecessary complexity or cost without improving outcomes. The right question is whether the server response time supports the task, not whether it wins a simplified benchmark.
The second misconception is that OPC UA server response time alone proves system readiness. It does not. Namespace design, backend device cycles, historian write behavior, network quality, and client implementation all matter. A poor client visualization layer can make a healthy server look slow; a cached server path can make a weak backend look fast for a short period.
The third misconception is that one lab test is enough for procurement sign-off. In reality, a serious industrial purchase often needs phased confirmation: bench test, pilot line validation, and site acceptance under realistic traffic. Even a compact project should include at least 3 categories of checks: performance, stability, and maintainability.
The fourth misconception is that standards compliance automatically guarantees good response time. OPC UA compatibility and security support are important, but they do not by themselves define latency behavior under load. Standards establish interoperability expectations; performance still requires scenario-based verification.
FAQ for engineers, operators, buyers, and executives
How long should an OPC UA response time test run?
For quick screening, 15–30 minutes can expose obvious configuration errors. For operational confidence, 4–8 hours is more meaningful because it captures shift-level behavior. For critical systems or mixed workloads, 24–72 hours provides better evidence of stability, retries, and resource drift.
What is more important: low average latency or low jitter?
In many plant and edge scenarios, low jitter is more valuable than a low average. Operators and analytics pipelines trust data streams that are predictable. A system averaging 70 ms with narrow variation may be more useful than one averaging 40 ms but regularly spiking to several hundred milliseconds.
Should procurement teams request percentile metrics in quotations?
Yes. Asking for median, 95th percentile, observation duration, session count, and security mode improves bid comparability. It also discourages vague claims and helps procurement teams align technical validation with acceptance criteria before contract finalization.
Can cloud or remote access make a good server look bad?
Absolutely. WAN latency, VPN overhead, firewall inspection, and packet loss can increase visible delay even when the local OPC UA server is healthy. That is why local measurement points and remote measurement points should be logged separately when the project includes cross-site access.
Why choose a data-driven evaluation partner before you commit?
In high-value industrial sourcing, the real cost is often not the software license or gateway appliance. The real cost comes from wrong assumptions: repeated test cycles, delayed qualification, unstable commissioning, and supplier comparisons built on non-equivalent numbers. TSV exists to reduce exactly that kind of noise by turning broad performance claims into engineering-grade evaluation criteria.
Our approach is suited to research teams building benchmark frameworks, operators trying to understand field behavior, procurement teams drafting stronger specification sheets, and enterprise leaders evaluating integration risk across automation, edge AI, sensors, aerospace data chains, and precision manufacturing systems. We focus on verifiable parameters, test transparency, and scenario-fit analysis rather than generic praise.
If you are reviewing OPC UA server response time claims, you can consult TSV on practical topics such as parameter confirmation, test-plan design, node and session sizing, security-mode impact, delivery-stage validation, supplier comparison logic, and integration readiness for your actual architecture. That includes support for pilot criteria, acceptance checkpoints, and risk identification before procurement is locked in.
Contact TechStat Vanguard when you need a clearer basis for product selection, benchmark interpretation, deployment planning, quotation review, or custom evaluation workflows. In environments where one misleading average can distort a multi-team decision, engineering truth through data is not a slogan. It is the most practical way to buy, build, and scale with confidence.
Search News
Hot Articles
- Carbon Fiber StructuresHow to Specify Aerospace Carbon Fiber Assemblies for Lightweight, Load-Bearing PartsJul 11, 2026
- Machine VisionXiaomi, Alibaba DAMO Academy Drive Open-Source Robotics Model Ecosystem, Lowering Algorithm Development Barriers for Overseas SMEs Adopting Chinese Robotics SolutionsMar 30, 2026
- Cobots & ArmsShanxi 'AI+' Conference Showcases Embodied Intelligence with Multinational Buyer Engagement: Key Industry ImplicationsMar 30, 2026
Popular Tags
Recommended News
 Jul 11, 2026How to Specify Aerospace Carbon Fiber Assemblies for Lightweight, Load-Bearing PartsAerospace carbon fiber assemblies: learn how to specify laminate design, load data, joining methods, and inspection controls for lighter, reliable load-bearing aerospace parts.Elena Rostova (UAV Systems Researcher)
 Mar 30, 2026Xiaomi, Alibaba DAMO Academy Drive Open-Source Robotics Model Ecosystem, Lowering Algorithm Development Barriers for Overseas SMEs Adopting Chinese Robotics SolutionsXiaomi & Alibaba DAMO Academy's open-source robotics models lower algorithm barriers for global SMEs. Boost efficiency in manufacturing, logistics & smart retail with ROS 2 compatible solutions.TSV Data Lab
 Mar 30, 2026Shanxi 'AI+' Conference Showcases Embodied Intelligence with Multinational Buyer Engagement: Key Industry ImplicationsShanxi 'AI+' Conference highlights embodied intelligence with Tesla, Ubtech & Jiantao showcasing multimodal robotics. 40+ global buyers validated tech on-site, creating new B2B channels for industrial automation & AI solutions.Chen Wei (Automation Lead Engineer)
 Mar 30, 2026Zhongguancun Unveils 6G Integrated Sensing-Computing-Intelligence Platform to Empower Embodied Robots for Global Industrial ApplicationsZhongguancun's new 6G platform revolutionizes industrial robotics with <10ms latency, empowering global automotive, logistics & port automation. Discover how this tech boosts China's smart manufacturing exports.TSV Data Lab
 Mar 30, 2026Mech-Mind Tianjin Embodied Intelligence R&D and Production Base Goes Live, Cutting Delivery Time by 20%–30% for Global Customized AMR+Vision SolutionsMech-Mind's Tianjin AMR+Vision production base cuts delivery time by 20%-30% for欧美 & Latin American markets. Discover how this PLd-certified facility accelerates customized robotics solutions for smart manufacturing and logistics.Chen Wei (Automation Lead Engineer)
 Mar 30, 2026Boao Forum Reveals 'Co-evolution of Big and Small Brains' Trend in Humanoid Robots, China's Embodied Intelligence Accelerates Adaptation to Overseas Manufacturing Service ScenariosDiscover how China's humanoid robots, featuring 'Co-evolution of Big and Small Brains,' are revolutionizing global manufacturing. Learn about Embodied Tian Gong 3.0's ISO compliance and overseas deployment at Boao Forum 2026.Chen Wei (Automation Lead Engineer)
 Mar 30, 2026China Railway Industrial Secures Patent for Embodied Robotics in Material Handling, Boosting High-Precision Delivery Capabilities for Overseas Infrastructure and Manufacturing ProjectsChina Railway Industrial's new patent for embodied robotics in material handling boosts high-precision delivery for global infrastructure & manufacturing. Discover how this innovation enhances logistics accuracy in automotive, rail transit & EPC projects.Chen Wei (Automation Lead Engineer)
 Oct 13, 2026Smart Cameras vs. PC-Based Machine Vision: Which Fits High-Speed Inspection?This industrial product comparison for machine vision weighs smart cameras vs. PC-based systems on latency, throughput, and cost. Discover your best fit for high-speed inspection.TSV Data Lab
 Oct 12, 2026How to Verify RoHS Compliance in Industrial Sensing Systems Before DeploymentRoHS compliant sensing systems: learn how to verify materials, supplier declarations, testing, and configuration controls before industrial deployment.TSV Data Lab
 Oct 11, 2026How Procurement-Oriented Content Taxonomy Improves B2B Buying JourneysProcurement-oriented content taxonomy streamlines B2B buying journeys with clearer evidence, supplier comparisons, risk visibility, and faster approvals.TSV Data Lab
 Oct 10, 2026How to Select a Machine Performance Monitoring Platform for OEE and Downtime ReductionMachine performance monitoring platform selection guide: validate machine states, OEE data, downtime reasons, integrations, and scalability to reduce losses with confidence.TSV Data Lab
 Oct 08, 2026How to Machine Inconel 625 Blades Without Heat Cracks or Edge ChippingInconel 625 blade machining guide: prevent heat cracks, edge chipping, chatter, and work hardening with proven tooling, cooling, fixturing, and inspection strategies.Dr. Marcus Vance
 Oct 07, 2026How to Evaluate an HMI Panel Distributor for Industrial Automation ProjectsHMI panel distributor evaluation guide: verify technical compatibility, traceability, supply reliability, lifecycle support, and total cost for automation projects.Victor Lin (Chief Software Architect)
 Oct 06, 2026Navigation Fault Tolerance Standards for AMRs: What Safety Teams Must VerifyNavigation fault tolerance standards: learn what AMR safety teams must verify, from localization loss and sensor faults to stopping distance, safe restart, and site-specific validation.Chen Wei (Automation Lead Engineer)
 Oct 05, 2026Calculating Edge Computing Total Cost of Ownership Across Distributed SitesEdge computing ownership cost explained: calculate deployment, energy, connectivity, security, remote support, and refresh costs across distributed sites.TSV Data Lab
 Oct 04, 2026CAD/CAM Benchmarking in the GCC: What Manufacturers Should Ask a ConsultantCAD CAM benchmark consultant GCC guide: learn the key questions manufacturers should ask to validate post-processors, workflows, machine performance, and production risk.Victor Lin (Chief Software Architect)
 Oct 03, 2026Selecting Automotive Radar Sensor Modules for ADAS Range, Resolution, and IntegrationAutomotive radar sensor module selection guide for ADAS: compare range, resolution, field of view, latency, and integration to build safer, reliable vehicle systems.TSV Data Lab
 Oct 02, 2026How to Qualify Machined Parts Suppliers for Hard Tech ProgramsHard tech supply chain machined parts demand rigorous supplier qualification. Learn how to assess capability, traceability, quality controls, and delivery resilience.Dr. Marcus Vance
 Oct 01, 2026How to Select an Outdoor Security Radar Sensor for Perimeter Detection?Outdoor security radar sensor selection guide: compare range, accuracy, false-alarm control, integration, and field testing for reliable perimeter detection.TSV Data Lab
 Sep 30, 2026How to Evaluate Solid-State LiDAR Hardware for Outdoor Autonomous VehiclesSolid state LiDAR hardware evaluation guide for outdoor autonomous vehicles—compare range, point-cloud quality, environmental resilience, integration, and safety.TSV Data Lab
 Sep 29, 2026ISO 9283 Repeatability: How to Evaluate Cobot Positioning PerformanceISO 9283 cobot repeatability explained: learn how payload, reach, approach direction, and test conditions affect positioning performance and cell capability.Chen Wei (Automation Lead Engineer)
 Oct 13, 2026How to keep an industrial robotic integration project on scheduleIndustrial robotic integration project management: keep automation on schedule with proven controls for interfaces, suppliers, FAT, commissioning, and change risk.Victor Lin (Chief Software Architect)
 Oct 12, 2026What should be included in predictive maintenance pricing for factories?Predictive maintenance pricing for factories: compare sensors, software, integration, support, and total cost to secure measurable uptime gains and avoid hidden expenses.TSV Data Lab
 Oct 11, 2026How payload and reach change the cost of an industrial robotCost of industrial robot systems depends heavily on payload and reach. Learn how sizing, torque, tooling, safety, and lifecycle factors shape smarter automation investments.Chen Wei (Automation Lead Engineer)