Solid-State LiDAR for Robotics Navigation: What Fails First?
Publication Date
author
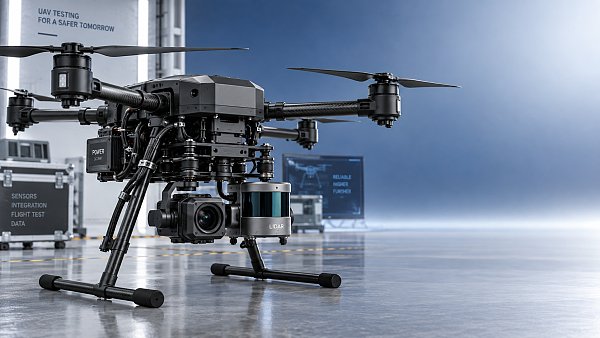
When solid-state LiDAR for robotics navigation starts drifting, dropping points, or misreading reflective surfaces, the first visible problem is rarely the root cause.
Field failures usually begin with small degradations. Heat cycling, window contamination, connector wear, and calibration shift quietly accumulate before navigation faults appear.
This guide explains what fails first in solid-state LiDAR for robotics navigation, how those failures surface, and what practical checks reduce downtime and misdiagnosis.
What usually fails first in solid-state LiDAR for robotics navigation?
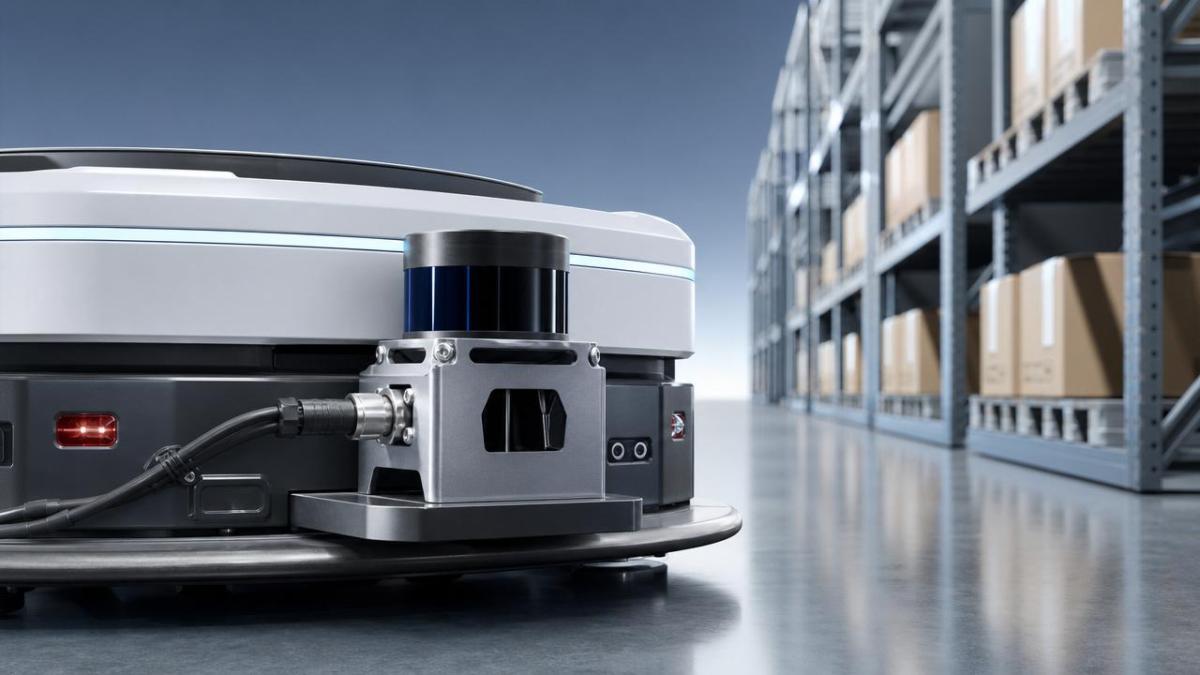
The first failure is often not the laser emitter. It is usually the interface between the sensor and the environment.
For solid-state LiDAR for robotics navigation, early weakness commonly appears in five areas:
- Optical window contamination from dust, oil mist, or cleaning residue
- Thermal drift affecting ranging accuracy and point cloud stability
- Connector fatigue causing intermittent power or data loss
- Mounting vibration loosening alignment over time
- Firmware or timing synchronization errors after updates
These failure points matter because robotics navigation depends on consistency, not only peak lab performance.
A sensor can still output data while already degrading. That is why navigation errors often appear before hard sensor alarms.
Why contamination appears earlier than component burnout
Most indoor and mixed-use robots operate near forklifts, conveyors, packaging dust, coolant mist, or warehouse exhaust.
Even a thin film on the optical window can reduce return intensity and distort edge detection.
That makes solid-state LiDAR for robotics navigation vulnerable to false obstacles, shorter detection range, and unstable localization.
How do early failures show up in robot behavior?
The sensor rarely announces failure in a dramatic way. Robot behavior changes first.
Typical symptoms include path wobble, repeated replanning, unexplained slowdowns, and emergency stops near reflective objects.
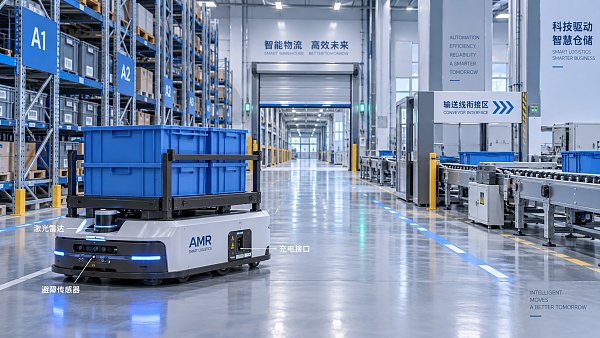
In AMRs, degraded solid-state LiDAR for robotics navigation can also create map mismatch after normal route updates.
Symptom patterns that point to likely causes
These patterns help isolate whether the issue sits in optics, mechanics, electronics, or software timing.
Which environments stress solid-state LiDAR for robotics navigation the most?
Not all deployments age the sensor equally. Environmental stress determines the first weak link.
High-risk conditions include rapid temperature swings, high particulate air, reflective metal aisles, and frequent washdown cleaning.
Outdoor mobile robots add sunlight saturation, rain residue, and vibration from uneven surfaces.
Field conditions that accelerate failure
- Cold start to hot operation within short cycles
- Dust mixed with oil, creating a sticky optical film
- Repeated vibration from ramps, joints, or rough concrete
- EMI exposure near motors, inverters, or switching supplies
- Improper cleaning chemicals attacking seals or coatings
For solid-state LiDAR for robotics navigation, the danger is cumulative degradation rather than a single catastrophic event.
That is why maintenance history and environmental logs are as important as fault codes.
How can teams distinguish calibration drift from hardware failure?
This is one of the most common diagnostic mistakes. Drift often looks like hardware death, but the fixes differ greatly.
Calibration drift usually develops gradually. Hardware failure tends to be abrupt, intermittent, or complete.
Practical separation method
- Capture baseline point clouds during cold start.
- Repeat after thermal stabilization.
- Check for consistent geometric offset or angle bias.
- Review packet integrity and power stability logs.
- Inspect mount position against mechanical reference marks.
If geometry shifts smoothly with temperature, calibration drift is more likely than dead hardware.
If data loss appears in bursts, suspect cable strain, connector oxidation, or internal electronics instability.
For solid-state LiDAR for robotics navigation, poor synchronization with IMU or wheel odometry can also mimic sensor failure.
What checks should happen before replacing a sensor?
Blind replacement is expensive and often misses the true cause.
Before declaring solid-state LiDAR for robotics navigation defective, run a short structured checklist.
Pre-replacement checklist
- Clean the optical window using approved materials only
- Inspect sealing surfaces and look for micro-cracks
- Verify supply voltage under load and during motion
- Check Ethernet, CAN, or serial error counts
- Retorque brackets and inspect vibration isolators
- Confirm firmware version compatibility across the stack
- Compare output against a known-good unit in the same environment
Many apparent sensor failures are actually installation or integration failures.
This is especially true where robots were retrofitted, relocated, or updated without full validation.
What service strategy extends the life of solid-state LiDAR for robotics navigation?
A durable service strategy focuses on trend monitoring, not just reactive replacement.
The best programs track return intensity, false positive rate, thermal behavior, and communication stability over time.
Recommended maintenance rhythm
This approach supports more reliable solid-state LiDAR for robotics navigation across warehousing, industrial automation, delivery robots, and mixed indoor-outdoor fleets.
It also aligns with TSV’s engineering-first principle: parameters, tolerances, and trend data matter more than marketing labels.
FAQ summary: what should be remembered first?
Solid-state LiDAR for robotics navigation rarely fails in a single obvious step.
The earliest losses appear in optics, thermal stability, connectors, mounts, and timing alignment.
A disciplined diagnostic flow prevents unnecessary replacements and improves fleet uptime.
For the next step, build a baseline dataset from healthy units, define pass-fail thresholds, and tie service decisions to measured drift instead of assumptions.
Search News
Hot Articles
- Carbon Fiber StructuresHow to Specify Aerospace Carbon Fiber Assemblies for Lightweight, Load-Bearing PartsJul 11, 2026
- Machine VisionXiaomi, Alibaba DAMO Academy Drive Open-Source Robotics Model Ecosystem, Lowering Algorithm Development Barriers for Overseas SMEs Adopting Chinese Robotics SolutionsMar 30, 2026
- Cobots & ArmsShanxi 'AI+' Conference Showcases Embodied Intelligence with Multinational Buyer Engagement: Key Industry ImplicationsMar 30, 2026
Popular Tags
Recommended News
 Jul 11, 2026How to Specify Aerospace Carbon Fiber Assemblies for Lightweight, Load-Bearing PartsAerospace carbon fiber assemblies: learn how to specify laminate design, load data, joining methods, and inspection controls for lighter, reliable load-bearing aerospace parts.Elena Rostova (UAV Systems Researcher)
 Mar 30, 2026Xiaomi, Alibaba DAMO Academy Drive Open-Source Robotics Model Ecosystem, Lowering Algorithm Development Barriers for Overseas SMEs Adopting Chinese Robotics SolutionsXiaomi & Alibaba DAMO Academy's open-source robotics models lower algorithm barriers for global SMEs. Boost efficiency in manufacturing, logistics & smart retail with ROS 2 compatible solutions.TSV Data Lab
 Mar 30, 2026Shanxi 'AI+' Conference Showcases Embodied Intelligence with Multinational Buyer Engagement: Key Industry ImplicationsShanxi 'AI+' Conference highlights embodied intelligence with Tesla, Ubtech & Jiantao showcasing multimodal robotics. 40+ global buyers validated tech on-site, creating new B2B channels for industrial automation & AI solutions.Chen Wei (Automation Lead Engineer)
 Mar 30, 2026Zhongguancun Unveils 6G Integrated Sensing-Computing-Intelligence Platform to Empower Embodied Robots for Global Industrial ApplicationsZhongguancun's new 6G platform revolutionizes industrial robotics with <10ms latency, empowering global automotive, logistics & port automation. Discover how this tech boosts China's smart manufacturing exports.TSV Data Lab
 Mar 30, 2026Mech-Mind Tianjin Embodied Intelligence R&D and Production Base Goes Live, Cutting Delivery Time by 20%–30% for Global Customized AMR+Vision SolutionsMech-Mind's Tianjin AMR+Vision production base cuts delivery time by 20%-30% for欧美 & Latin American markets. Discover how this PLd-certified facility accelerates customized robotics solutions for smart manufacturing and logistics.Chen Wei (Automation Lead Engineer)
 Mar 30, 2026Boao Forum Reveals 'Co-evolution of Big and Small Brains' Trend in Humanoid Robots, China's Embodied Intelligence Accelerates Adaptation to Overseas Manufacturing Service ScenariosDiscover how China's humanoid robots, featuring 'Co-evolution of Big and Small Brains,' are revolutionizing global manufacturing. Learn about Embodied Tian Gong 3.0's ISO compliance and overseas deployment at Boao Forum 2026.Chen Wei (Automation Lead Engineer)
 Mar 30, 2026China Railway Industrial Secures Patent for Embodied Robotics in Material Handling, Boosting High-Precision Delivery Capabilities for Overseas Infrastructure and Manufacturing ProjectsChina Railway Industrial's new patent for embodied robotics in material handling boosts high-precision delivery for global infrastructure & manufacturing. Discover how this innovation enhances logistics accuracy in automotive, rail transit & EPC projects.Chen Wei (Automation Lead Engineer)
 Sep 28, 2026Spindle Runout Measurement in Germany: DIN Standards, Methods, and Acceptance LimitsSpindle runout measurement Germany: explore DIN standards, proven methods, acceptance limits, and audit-ready practices for reliable machining quality.Dr. Marcus Vance
 Sep 27, 2026How to Select Wall-Mount Edge Devices for Space-Constrained Factory NetworksWall mount edge devices for space-constrained factories: evaluate workload, thermal design, power resilience, cable access, and network reliability for smarter deployments.TSV Data Lab
 Sep 26, 2026Machining Tolerance Analysis: How to Set Limits That Meet Function and Cost TargetsMachining tolerance analysis: learn how to set functional limits, control tolerance stacks, reduce inspection risk, and balance precision with production cost.Dr. Marcus Vance
 Sep 25, 2026How to Evaluate an Industrial Infrastructure Data Platform for Multi-Site OperationsIndustrial infrastructure data platform evaluation guide for multi-site operations: compare data quality, edge resilience, interoperability, governance, and scalable proof-of-value criteria.Victor Lin (Chief Software Architect)
 Sep 24, 2026How to Select Machine Vision Optics for Accurate Inspection at Different Working DistancesMachine vision optics selection guide for accurate inspection at every working distance. Compare FOV, pixel scale, DOF, distortion, lighting, and telecentric options.TSV Data Lab
 Sep 23, 2026How to Evaluate a Machine Vision System Integrator for High-Speed Inspection LinesChoose a machine vision system integrator with proven expertise in high-speed inspection, reliable reject timing, robust optics, and measurable acceptance criteria.TSV Data Lab
 Sep 28, 2026When is a SCADA API the right choice for connecting plant systems?SCADA API guide: learn when governed plant data integration improves traceability, security, and scalability—without compromising real-time control.Victor Lin (Chief Software Architect)
 Sep 27, 2026How SCADA data integration improves traceability across production linesSCADA data integration connects production-line data to improve traceability, accelerate quality investigations, and strengthen safety decisions.Victor Lin (Chief Software Architect)
 Sep 26, 2026What to define before starting SCADA integration planningSCADA integration planning starts with clear scope, control boundaries, data models, cybersecurity, and testing. Discover the definitions that reduce risk and costly rework.Victor Lin (Chief Software Architect)
 Sep 25, 2026How a smart factory with Industrial IoT reduces production blind spotsDiscover how a smart factory with Industrial IoT turns real-time machine, quality, and workflow data into actionable insights that reduce production blind spots and delivery risks.Victor Lin (Chief Software Architect)
 Sep 24, 2026When does Industrial IoT make smart manufacturing easier to scale?Smart manufacturing Industrial IoT scales when trusted data, interoperable systems, and secure workflows turn connected assets into measurable gains.TSV Data Lab
 Sep 23, 2026What drives ultra-precision machining cost at 1-micron tolerance?Ultra precision machining cost per part at 1 micron tolerance depends on process, material, metrology, and yield. Learn how to compare quotes confidently.Dr. Marcus Vance
 Sep 22, 2026Drone Engine-T550CC Applications: Build the UAV Power System Around the MissionAn application guide for Drone Engine-T550CC integration, covering payload planning, airframe matching, cooling, fuel, vibration, test procedures, documentation, and service preparation.Elena Rostova (UAV Systems Researcher)
 Sep 22, 2026How to Evaluate Industrial Edge Computing Vendors for Factory DeploymentIndustrial edge computing vendor evaluation guide for factories: compare latency, protocol fit, reliability, security, and lifecycle support before deployment.TSV Data Lab
 Sep 21, 2026Drone Payload Integration: Matching Power, Data, and Center of Gravity for Reliable FlightsDrone payload integration made practical: balance power, data, center of gravity, and endurance to build safer, more reliable mission-ready flights.Elena Rostova (UAV Systems Researcher)
 Sep 20, 2026Autonomous Navigation Pricing: Cost Drivers and Budget Benchmarks for AMR ProjectsAutonomous navigation price explained: compare AMR cost drivers, software, sensors, integration, safety, and lifecycle budgets to build a scalable project plan.Chen Wei (Automation Lead Engineer)
 Sep 19, 2026How to Scope Automation Integration Services for Multi-System Factory ProjectsAutomation integration services: learn how to scope multi-system factory projects with clear workflows, interface contracts, safety boundaries, and acceptance criteria.Victor Lin (Chief Software Architect)