How lidar for agv obstacle avoidance reduces downtime
Publication Date
author
For technical evaluators, downtime is rarely caused by a single navigation failure—it is the cumulative result of missed detections, unstable sensing, and slow recovery logic. This is where lidar for agv obstacle avoidance becomes a measurable engineering variable rather than a marketing feature. By analyzing detection range, angular resolution, latency, point-cloud stability, and integration with safety controllers, teams can determine how LiDAR-enabled AGVs reduce stoppages, protect workflows, and improve fleet availability in real industrial environments.
Why downtime analysis should start with sensing reliability
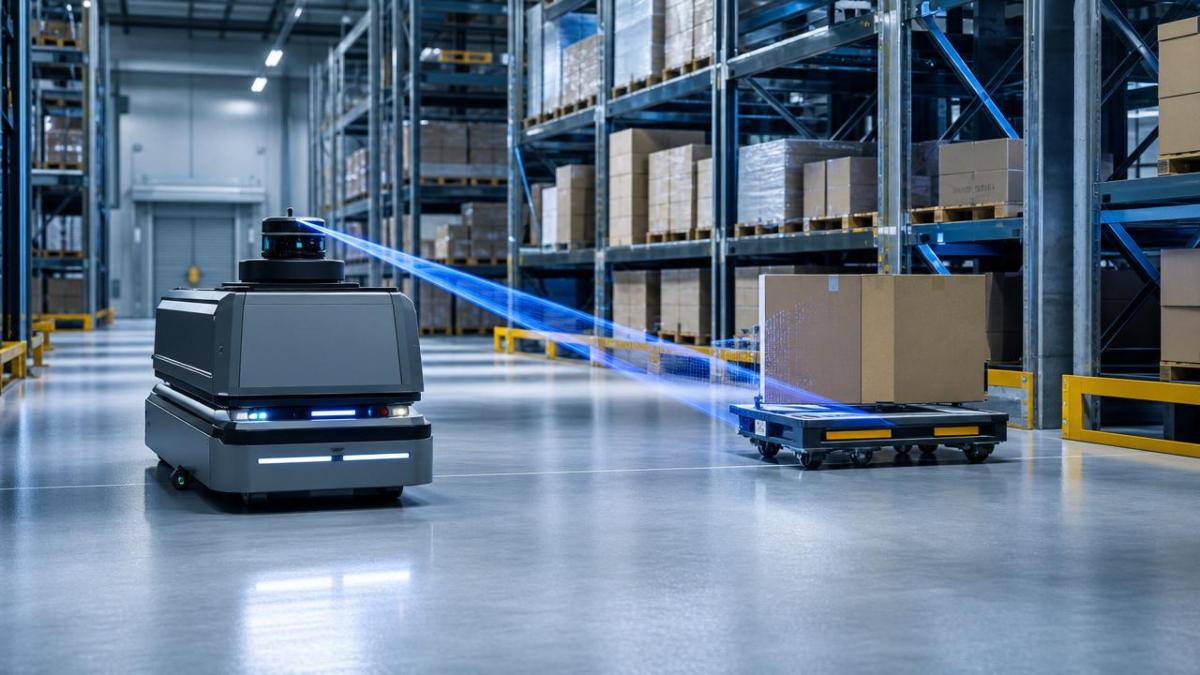
In factories, warehouses, ports, and electronics plants, AGV downtime often appears as an operations issue. The vehicle stops, blocks an aisle, waits for manual reset, or triggers a conservative safety response.
For technical evaluators, the deeper question is not whether the AGV stopped. The useful question is why the perception stack failed to maintain a stable, actionable view of the environment.
Lidar for agv obstacle avoidance helps reduce downtime because it converts surrounding geometry into structured distance data. Unlike a simple bumper or single-point sensor, LiDAR supports early detection, trajectory adjustment, and controlled deceleration.
However, not every LiDAR installation improves availability. A poorly selected sensor may produce blind zones, reflective-surface errors, or excessive false stops. The downtime benefit depends on parameter fit.
Downtime sources that LiDAR can influence
- Unplanned stops caused by late obstacle recognition in mixed human-machine traffic zones.
- Repeated manual interventions after the AGV misclassifies pallets, forklift forks, carts, or temporary barriers.
- Route congestion caused by slow recovery logic after a vehicle enters emergency stop mode.
- Production interruptions caused by inconsistent detection under dust, glare, vibration, or high-reflectivity packaging.
TechStat Vanguard evaluates these issues from an engineering benchmark perspective. The focus is not promotional language, but measured tolerance: what the AGV sees, when it sees it, and how reliably it reacts.
Which parameters matter most in lidar for agv obstacle avoidance?
A useful specification review begins by separating navigation convenience from safety-relevant sensing. Lidar for agv obstacle avoidance must be assessed through range, resolution, response time, field of view, and environmental stability.
The table below outlines practical parameters technical evaluators should request from vendors before pilot deployment. Values should be verified under representative floor conditions, not only in a clean laboratory.
This parameter view prevents overspending on irrelevant features while avoiding under-specification. In practice, the best LiDAR choice is the one that matches AGV speed, load mass, aisle geometry, and recovery strategy.
How LiDAR reduces stoppages across industrial scenarios
The value of lidar for agv obstacle avoidance changes by site type. A clean electronics plant, a cold-chain warehouse, and a metal fabrication shop expose sensors to different risk patterns.
Technical evaluators should therefore test the obstacle avoidance system against the real operating envelope. A supplier demo route rarely represents shift-change traffic, forklift crossings, or temporary storage deviations.
Scenario-based evaluation matrix
The following matrix helps map common industrial scenarios to the downtime mechanisms that LiDAR can reduce. It is also useful when drafting a vendor test protocol.
A scenario matrix also exposes hidden costs. If lidar for agv obstacle avoidance performs well only in open aisles, it may fail where downtime is most expensive: intersections, docking, and shared work cells.
LiDAR versus alternative obstacle detection technologies
LiDAR is not the only technology used for AGV obstacle detection. Ultrasonic sensors, safety laser scanners, cameras, radar, and mechanical bumpers all appear in industrial automation projects.
The engineering task is not to declare one technology universally superior. It is to define which sensing combination reduces stoppages without adding integration complexity or excessive false alarms.
Decision comparison for technical evaluators
This comparison highlights where lidar for agv obstacle avoidance provides measurable advantages and where complementary sensors may still be required.
In many AGV projects, the strongest architecture combines LiDAR distance sensing with safety-rated controllers, wheel odometry, inertial data, and site-specific traffic logic. Redundancy must be designed, not improvised.
Procurement checklist: what to verify before approving a LiDAR-equipped AGV
Procurement teams often receive polished datasheets that do not explain recovery behavior. For technical evaluators, the critical evidence is how lidar for agv obstacle avoidance performs under operating constraints.
Evidence to request from vendors
- Ask for detection performance at multiple object heights, including pallet edges, dangling straps, low carts, and narrow posts.
- Request latency measurements from sensor capture to AGV control response, not only sensor scan rate.
- Require a false-stop log from pilot testing, including time, location, detected object type, and recovery action.
- Review mounting drawings to confirm field-of-view coverage at turns, intersections, docking stations, and reverse paths.
- Validate cleaning intervals and contamination tolerance in facilities with dust, mist, fibers, or packaging debris.
A strong procurement specification should include acceptance criteria, not only product descriptions. For example, define allowable false stops per shift, recovery time targets, and minimum detection distance at defined AGV speeds.
TechStat Vanguard’s data-driven methodology is useful here because it translates supplier claims into testable engineering checkpoints. Parameters do not eliminate judgment, but they make procurement discussions accountable.
Implementation factors that decide whether LiDAR actually improves uptime
Lidar for agv obstacle avoidance is not a plug-in cure. Downtime reduction depends on physical installation, control logic, fleet software, maintenance routines, and operator interaction rules.
A technically sound implementation begins with route risk mapping. Mark high-interaction areas, blind corners, transfer points, mixed pedestrian zones, and locations where temporary storage commonly appears.
Controls and integration checkpoints
- Set separate protective zones for slow maneuvering, normal travel, turning, docking, and reverse movement.
- Tune deceleration profiles so the AGV slows progressively instead of entering unnecessary emergency stop states.
- Connect LiDAR events to the fleet management system, allowing route rerouting rather than repeated queue formation.
- Define maintenance checks for lens contamination, sensor alignment, cable strain, vibration loosening, and firmware revisions.
For safety-related functions, teams should consult applicable machinery and functional safety standards, such as ISO 3691-4 for driverless industrial trucks and IEC 61508 concepts where relevant.
Compliance does not replace engineering validation. It provides a framework for risk reduction, documentation, and responsibility allocation between AGV vendors, integrators, and site operators.
Common misconceptions that create false confidence
Many AGV downtime problems come from overconfidence in generic sensor labels. The phrase lidar for agv obstacle avoidance sounds precise, but the implementation details decide the result.
Misconception one: longer range always means lower downtime
Long range is useful only when it is paired with sufficient resolution, stable returns, and timely control action. An AGV that detects far away but reacts late still blocks the workflow.
Misconception two: a clean demo route proves factory readiness
Demo routes often avoid reflective packaging, operator crossings, temporary carts, and vibration. Pilot testing should include abnormal but realistic scenarios that usually cause stoppages.
Misconception three: false stops are only software issues
False stops can originate from sensor noise, mounting angle, floor reflection, dirty optics, insufficient filtering, or overly conservative safety zones. Root-cause logs are essential.
FAQ for technical evaluators
How do I know whether lidar for agv obstacle avoidance is worth the investment?
Start by quantifying current downtime: stop frequency, average recovery time, affected routes, and labor intervention. If stoppages relate to unpredictable obstacles, LiDAR can deliver measurable value.
The business case should include avoided manual resets, improved route availability, fewer queue events, and lower risk of workflow interruption. Avoid evaluating only sensor purchase price.
Is 2D LiDAR enough, or should we consider 3D LiDAR?
2D LiDAR can be effective for many floor-level obstacles and route protection zones. 3D LiDAR may be justified when obstacles vary in height, shape, or vertical position.
For example, overhanging loads, tilted racks, or irregular warehouse items may require richer spatial data. The choice should be based on obstacle geometry, not trend-driven purchasing.
What should be measured during a pilot test?
Measure detection consistency, false-stop rate, missed-object events, recovery time, route rerouting success, and maintenance burden. Include both normal production and peak traffic periods.
A pilot should also test degraded conditions, such as lens contamination, reflective surfaces, temporary aisle blockage, and low-height obstacles. These cases reveal real downtime risk.
Can LiDAR eliminate all AGV downtime?
No responsible evaluator should expect that. Lidar for agv obstacle avoidance reduces specific downtime mechanisms, especially perception-related stops and delayed reactions.
Mechanical failures, traffic planning errors, battery constraints, poor Wi-Fi coverage, and weak maintenance routines can still reduce fleet availability. LiDAR is one critical layer.
Why choose TechStat Vanguard for LiDAR and AGV evaluation support?
TechStat Vanguard supports engineering teams that need to cut through ambiguous supplier claims and define testable specifications. Our position is simple: data should govern sourcing decisions.
For lidar for agv obstacle avoidance, TSV can help evaluators structure parameter checklists, compare supplier claims, review pilot-test plans, and identify hidden downtime risks before procurement approval.
Engage TSV when you need support on detection-range confirmation, angular-resolution review, latency benchmarking, safety-controller integration questions, certification requirements, or custom evaluation matrices.
You can also consult TSV for quotation comparison logic, sample testing priorities, delivery-cycle risk review, and specification drafting for multi-site AGV deployments.
In hard-tech procurement, the strongest decision is not the loudest claim. It is the one supported by repeatable measurements, documented tolerances, and a clear path from sensor data to reduced downtime.
Search News
Hot Articles
- Carbon Fiber StructuresHow to Specify Aerospace Carbon Fiber Assemblies for Lightweight, Load-Bearing PartsJul 11, 2026
- Machine VisionXiaomi, Alibaba DAMO Academy Drive Open-Source Robotics Model Ecosystem, Lowering Algorithm Development Barriers for Overseas SMEs Adopting Chinese Robotics SolutionsMar 30, 2026
- Cobots & ArmsShanxi 'AI+' Conference Showcases Embodied Intelligence with Multinational Buyer Engagement: Key Industry ImplicationsMar 30, 2026
Popular Tags
Recommended News
 Jul 11, 2026How to Specify Aerospace Carbon Fiber Assemblies for Lightweight, Load-Bearing PartsAerospace carbon fiber assemblies: learn how to specify laminate design, load data, joining methods, and inspection controls for lighter, reliable load-bearing aerospace parts.Elena Rostova (UAV Systems Researcher)
 Mar 30, 2026Xiaomi, Alibaba DAMO Academy Drive Open-Source Robotics Model Ecosystem, Lowering Algorithm Development Barriers for Overseas SMEs Adopting Chinese Robotics SolutionsXiaomi & Alibaba DAMO Academy's open-source robotics models lower algorithm barriers for global SMEs. Boost efficiency in manufacturing, logistics & smart retail with ROS 2 compatible solutions.TSV Data Lab
 Mar 30, 2026Shanxi 'AI+' Conference Showcases Embodied Intelligence with Multinational Buyer Engagement: Key Industry ImplicationsShanxi 'AI+' Conference highlights embodied intelligence with Tesla, Ubtech & Jiantao showcasing multimodal robotics. 40+ global buyers validated tech on-site, creating new B2B channels for industrial automation & AI solutions.Chen Wei (Automation Lead Engineer)
 Mar 30, 2026Zhongguancun Unveils 6G Integrated Sensing-Computing-Intelligence Platform to Empower Embodied Robots for Global Industrial ApplicationsZhongguancun's new 6G platform revolutionizes industrial robotics with <10ms latency, empowering global automotive, logistics & port automation. Discover how this tech boosts China's smart manufacturing exports.TSV Data Lab
 Mar 30, 2026Mech-Mind Tianjin Embodied Intelligence R&D and Production Base Goes Live, Cutting Delivery Time by 20%–30% for Global Customized AMR+Vision SolutionsMech-Mind's Tianjin AMR+Vision production base cuts delivery time by 20%-30% for欧美 & Latin American markets. Discover how this PLd-certified facility accelerates customized robotics solutions for smart manufacturing and logistics.Chen Wei (Automation Lead Engineer)
 Mar 30, 2026Boao Forum Reveals 'Co-evolution of Big and Small Brains' Trend in Humanoid Robots, China's Embodied Intelligence Accelerates Adaptation to Overseas Manufacturing Service ScenariosDiscover how China's humanoid robots, featuring 'Co-evolution of Big and Small Brains,' are revolutionizing global manufacturing. Learn about Embodied Tian Gong 3.0's ISO compliance and overseas deployment at Boao Forum 2026.Chen Wei (Automation Lead Engineer)
 Mar 30, 2026China Railway Industrial Secures Patent for Embodied Robotics in Material Handling, Boosting High-Precision Delivery Capabilities for Overseas Infrastructure and Manufacturing ProjectsChina Railway Industrial's new patent for embodied robotics in material handling boosts high-precision delivery for global infrastructure & manufacturing. Discover how this innovation enhances logistics accuracy in automotive, rail transit & EPC projects.Chen Wei (Automation Lead Engineer)
 Oct 13, 2026Smart Cameras vs. PC-Based Machine Vision: Which Fits High-Speed Inspection?This industrial product comparison for machine vision weighs smart cameras vs. PC-based systems on latency, throughput, and cost. Discover your best fit for high-speed inspection.TSV Data Lab
 Oct 12, 2026How to Verify RoHS Compliance in Industrial Sensing Systems Before DeploymentRoHS compliant sensing systems: learn how to verify materials, supplier declarations, testing, and configuration controls before industrial deployment.TSV Data Lab
 Oct 11, 2026How Procurement-Oriented Content Taxonomy Improves B2B Buying JourneysProcurement-oriented content taxonomy streamlines B2B buying journeys with clearer evidence, supplier comparisons, risk visibility, and faster approvals.TSV Data Lab
 Oct 10, 2026How to Select a Machine Performance Monitoring Platform for OEE and Downtime ReductionMachine performance monitoring platform selection guide: validate machine states, OEE data, downtime reasons, integrations, and scalability to reduce losses with confidence.TSV Data Lab
 Oct 08, 2026How to Machine Inconel 625 Blades Without Heat Cracks or Edge ChippingInconel 625 blade machining guide: prevent heat cracks, edge chipping, chatter, and work hardening with proven tooling, cooling, fixturing, and inspection strategies.Dr. Marcus Vance
 Oct 07, 2026How to Evaluate an HMI Panel Distributor for Industrial Automation ProjectsHMI panel distributor evaluation guide: verify technical compatibility, traceability, supply reliability, lifecycle support, and total cost for automation projects.Victor Lin (Chief Software Architect)
 Oct 06, 2026Navigation Fault Tolerance Standards for AMRs: What Safety Teams Must VerifyNavigation fault tolerance standards: learn what AMR safety teams must verify, from localization loss and sensor faults to stopping distance, safe restart, and site-specific validation.Chen Wei (Automation Lead Engineer)
 Oct 05, 2026Calculating Edge Computing Total Cost of Ownership Across Distributed SitesEdge computing ownership cost explained: calculate deployment, energy, connectivity, security, remote support, and refresh costs across distributed sites.TSV Data Lab
 Oct 04, 2026CAD/CAM Benchmarking in the GCC: What Manufacturers Should Ask a ConsultantCAD CAM benchmark consultant GCC guide: learn the key questions manufacturers should ask to validate post-processors, workflows, machine performance, and production risk.Victor Lin (Chief Software Architect)
 Oct 03, 2026Selecting Automotive Radar Sensor Modules for ADAS Range, Resolution, and IntegrationAutomotive radar sensor module selection guide for ADAS: compare range, resolution, field of view, latency, and integration to build safer, reliable vehicle systems.TSV Data Lab
 Oct 02, 2026How to Qualify Machined Parts Suppliers for Hard Tech ProgramsHard tech supply chain machined parts demand rigorous supplier qualification. Learn how to assess capability, traceability, quality controls, and delivery resilience.Dr. Marcus Vance
 Oct 01, 2026How to Select an Outdoor Security Radar Sensor for Perimeter Detection?Outdoor security radar sensor selection guide: compare range, accuracy, false-alarm control, integration, and field testing for reliable perimeter detection.TSV Data Lab
 Sep 30, 2026How to Evaluate Solid-State LiDAR Hardware for Outdoor Autonomous VehiclesSolid state LiDAR hardware evaluation guide for outdoor autonomous vehicles—compare range, point-cloud quality, environmental resilience, integration, and safety.TSV Data Lab
 Sep 29, 2026ISO 9283 Repeatability: How to Evaluate Cobot Positioning PerformanceISO 9283 cobot repeatability explained: learn how payload, reach, approach direction, and test conditions affect positioning performance and cell capability.Chen Wei (Automation Lead Engineer)
 Oct 13, 2026How to keep an industrial robotic integration project on scheduleIndustrial robotic integration project management: keep automation on schedule with proven controls for interfaces, suppliers, FAT, commissioning, and change risk.Victor Lin (Chief Software Architect)
 Oct 12, 2026What should be included in predictive maintenance pricing for factories?Predictive maintenance pricing for factories: compare sensors, software, integration, support, and total cost to secure measurable uptime gains and avoid hidden expenses.TSV Data Lab
 Oct 11, 2026How payload and reach change the cost of an industrial robotCost of industrial robot systems depends heavily on payload and reach. Learn how sizing, torque, tooling, safety, and lifecycle factors shape smarter automation investments.Chen Wei (Automation Lead Engineer)