Why throughput bottlenecks hide inside industrial IoT architectures
Publication Date
author
In industrial environments, throughput failures rarely begin at the machine level—they emerge quietly across gateways, edge nodes, protocol layers, and analytics pipelines. This article uses industrial IoT data throughput analysis to show project leaders where hidden architectural friction slows decisions, disrupts scaling, and inflates operational risk. For engineering-driven teams, identifying these bottlenecks early is essential to building reliable, high-performance IoT systems.
When project managers investigate poor industrial IoT performance, they often start with the wrong suspect. They look at device speed, network bandwidth, or cloud compute pricing in isolation. In practice, the real bottleneck is usually architectural. Data moves through too many translation layers, buffering points, message brokers, security checks, and storage stages before anyone can use it. Each layer looks acceptable on its own, yet the full path behaves like a constrained system.
The core search intent behind industrial IoT data throughput analysis is not academic. Readers want to know why an apparently well-funded, technically modern architecture still delivers delayed dashboards, unstable alerts, inconsistent analytics, or painful scaling costs. They need a practical way to identify where throughput is actually being lost, how to prioritize fixes, and what design choices reduce operational risk before rollout expands.
For project leaders, the most important conclusion is simple: industrial IoT throughput problems are rarely caused by a single component hitting maximum capacity. They are caused by hidden friction between components that were never performance-tested as one system. That is why many pilots work and many production deployments struggle.
Why project leaders miss the real source of industrial IoT bottlenecks
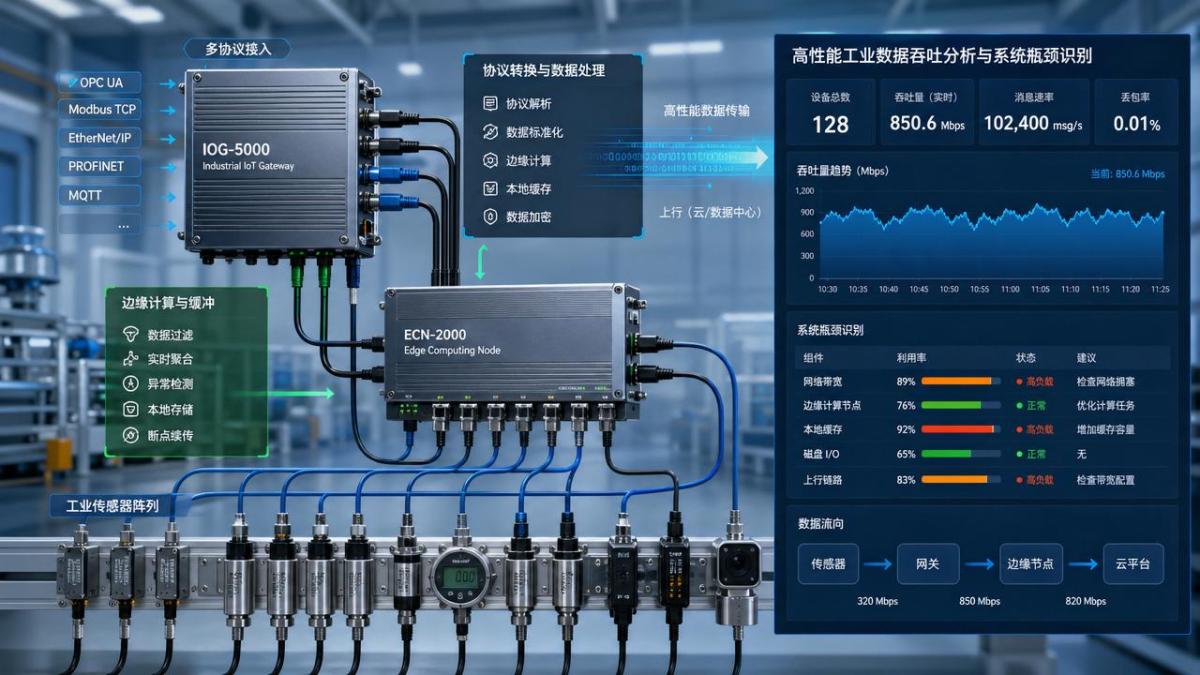
Most industrial IoT programs are built by multiple teams with different priorities. Operations cares about uptime. OT engineers care about deterministic machine communication. IT teams focus on cybersecurity and integration standards. Data teams want clean, queryable streams. Vendors optimize their own subsystem metrics. The result is a stack that appears compliant and scalable on paper, but whose end-to-end throughput behavior was never modeled with production loads.
This is where hidden bottlenecks begin. A gateway may support the advertised number of connected devices, but only under limited payload sizes and event rates. A broker may process high message counts, but latency spikes when quality-of-service settings increase. A cloud ingestion service may autoscale, but downstream transformation jobs can still create backlog. In other words, throughput is not one number. It is the sustained, usable flow of data across the entire decision path.
Project managers should also recognize a common governance problem. During procurement and design review, specifications often emphasize compatibility, protocol support, and peak performance. They rarely require proof of sustained throughput under realistic edge conditions: burst traffic, mixed protocol conversion, encrypted transmission, local buffering, packet retries, and analytics ingestion running simultaneously. That gap allows performance risk to hide until deployment complexity rises.
This is why industrial IoT data throughput analysis matters at the architecture level. It helps teams move beyond vendor datasheets and ask a more useful question: where does the system stop behaving predictably when data volume, device count, and event frequency all increase together?
Where throughput bottlenecks usually hide inside industrial IoT architectures
Hidden bottlenecks tend to cluster in five places. The first is protocol translation. Industrial environments rarely operate on a single clean standard. Data may move from Modbus, OPC UA, CAN, PROFINET, or proprietary machine formats into MQTT, HTTP, Kafka, or custom APIs. Every translation step adds parsing overhead, metadata mapping, and sometimes polling inefficiency. This consumes compute and introduces queuing that teams often underestimate.
The second is edge aggregation. Edge nodes are frequently designed as convenience layers, collecting sensor streams, normalizing data, and forwarding it upstream. But once filtering rules, local inference, anomaly detection, compression, and security services are added, the edge box becomes a miniature data center with limited thermal and compute headroom. Under peak conditions, this is often where throughput collapses first.
The third is gateway buffering behavior. Many gateways can absorb short-term bursts, which makes them appear healthy during standard tests. The issue appears when burst patterns become normal production behavior. Buffers fill, retries increase, data gets prioritized unevenly, and delays cascade downstream. Teams often see this only as “random latency” when it is actually a predictable queueing problem.
The fourth is message orchestration. Brokers, middleware, and event pipelines are essential for decoupling systems, but they also introduce serialization, acknowledgement logic, topic partitioning constraints, and persistence overhead. A messaging layer that is stable for telemetry may struggle when image data, high-frequency machine states, and command-response traffic coexist.
The fifth is analytics and storage ingestion. Many organizations assume that once data reaches the cloud or data platform, the hard part is over. In reality, ingestion throttles, schema enforcement, ETL delays, and dashboard query design can become the final throughput limiter. If analysis is delayed, business decisions are delayed, even if device-to-cloud transmission technically succeeded.
How hidden throughput friction turns into business risk
For engineering project leaders, throughput is not just a technical KPI. It directly affects decision speed, scaling confidence, and cost control. If architecture-induced latency delays anomaly detection by minutes instead of seconds, maintenance teams may miss the intervention window. If event streams become inconsistent under peak production load, quality analytics become unreliable. If each additional production line increases data handling cost nonlinearly, the business case for scaling weakens.
These risks are especially serious in mixed-criticality environments where machine health monitoring, vision inspection, traceability logs, and production optimization all share the same architecture. A design that handles average load may still fail the business if it cannot preserve priority traffic during spikes. Throughput bottlenecks become a governance issue because they force tradeoffs that were never clearly discussed during planning.
Another overlooked cost is organizational. When throughput issues are not visible in architectural terms, teams start blaming one another. OT blames cloud latency. IT blames legacy protocols. Vendors blame implementation. Analysts blame poor data quality. Projects lose time because the problem is framed as isolated underperformance rather than a system-level flow constraint.
This is why project managers need an end-to-end view. The question is not “Is the network fast?” It is “Can the architecture sustain the required flow of trusted, usable data at the moment operations need it?” That reframing changes investment priorities.
What industrial IoT data throughput analysis should actually measure
Effective industrial IoT data throughput analysis must go beyond headline bandwidth. A useful review measures sustained throughput, not peak throughput. It measures latency distribution, not just average latency. It tracks packet loss, retry rates, queue depth, serialization overhead, CPU load on edge devices, storage commit delays, and the effect of encryption or compression under load.
Project leaders should require measurements across realistic operating scenarios. These include normal production, startup surges, shift changes, maintenance windows, firmware updates, and exception events. In many factories, the most damaging failures happen during transition states rather than steady-state operation. If testing ignores those patterns, the architecture may pass validation but fail in real use.
Another critical metric is data usefulness at destination. A stream that arrives late, arrives incomplete, or arrives after excessive transformation delay should be treated as degraded throughput. From a business perspective, throughput only matters if decision systems receive data in time and in context.
It is also important to measure performance by data class. High-frequency vibration data, machine-state telemetry, machine vision outputs, and audit logs do not behave the same way. Aggregating them into one average throughput number masks where the real architectural pressure lies. Project teams should segment load profiles and test priority behavior explicitly.
How to identify bottlenecks before they become scale failures
The most effective approach is to map the full data journey from sensor or controller to business action. This should include acquisition, protocol conversion, edge preprocessing, transport, broker handling, persistence, transformation, analytics consumption, and visualization. Once that map exists, teams can assign measurable throughput budgets to each stage instead of assuming all delays are acceptable.
Next, run staged load testing that reflects the future production state, not the pilot state. Many deployments fail because a pilot with 30 devices is used to justify an architecture for 3,000 devices. Scale is not linear when middleware, security, and transformation layers are involved. Test with bursty traffic, mixed payload sizes, simultaneous software services, and realistic retry conditions.
Project managers should also insist on observability at every layer. If a gateway, broker, edge node, or ingestion service cannot expose queue depth, processing delay, drop rate, and resource utilization, it becomes difficult to isolate root cause. Black-box infrastructure is especially dangerous in industrial settings because intermittent lag may remain hidden until production impact is already visible.
A useful governance tool is the bottleneck review checkpoint. Before expanding to another site, line, or application type, teams should review where latency accumulates, where buffers spike, and which components show non-linear cost or performance behavior. This creates a decision gate based on engineering evidence rather than rollout optimism.
Design choices that reduce hidden throughput constraints
The first design principle is selective data movement. Not every raw signal needs to travel upstream at full resolution and full frequency. Intelligent filtering, event-based transmission, and application-specific aggregation can significantly reduce architectural stress without harming decision quality. The goal is not less data for its own sake, but higher-value data flow.
The second is protocol discipline. Every extra conversion layer adds performance and failure overhead. Standardizing data models and minimizing unnecessary translation paths reduces hidden friction. In environments where multiple protocols are unavoidable, teams should identify which conversions are mission-critical and benchmark them under realistic traffic patterns.
The third is workload separation. If deterministic control-adjacent telemetry, batch reporting, video streams, and AI inference outputs all share the same pathway, contention is inevitable. Segmenting flows by criticality and behavior improves resilience and makes throughput analysis more meaningful. Not all data deserves equal transport treatment.
The fourth is edge role clarity. Edge systems should not become accidental catch-all platforms. If they must host filtering, local analytics, security functions, and storage buffering, their compute and thermal margins must be sized for worst-case sustained load, not average expectations. Many “network problems” are actually edge saturation problems in disguise.
The fifth is benchmark-based procurement. Instead of asking whether a gateway or platform “supports industrial scale,” buyers should request proof of sustained throughput under the exact workload profile they expect: number of devices, protocol mix, payload size, encryption settings, burst rate, and required latency window. Parameters do not lie, and architecture decisions should be grounded in those parameters.
What a practical decision framework looks like for project managers
For project leaders, the right decision framework is not deeply theoretical. It is operational. Start by defining the business decision that the data must support, and the latest time that decision remains useful. Then work backward through the architecture to determine the maximum acceptable delay, loss, and transformation overhead at each stage.
From there, classify risks into three buckets. The first is throughput insufficiency, where the system simply cannot sustain the volume required. The second is throughput instability, where it performs under average load but degrades under burst or mixed-workload conditions. The third is throughput opacity, where the architecture may be under stress but lacks observability to prove where and why.
This framework helps prioritize investment. If the main issue is insufficiency, redesign or capacity expansion may be necessary. If instability is the problem, workload segmentation, buffering strategy changes, or protocol simplification may resolve it. If opacity is the issue, better instrumentation may deliver the highest return before any large infrastructure spend.
Most importantly, this approach keeps industrial IoT discussions tied to business outcomes. Faster throughput is not the goal by itself. Reliable, timely, and scalable operational intelligence is the goal. Throughput is simply the engineering condition required to achieve it.
Conclusion: the bottleneck is usually in the architecture, not the headline specification
Industrial IoT systems fail quietly when throughput is evaluated as a collection of component claims rather than as a complete operational flow. The hidden bottlenecks are usually found in protocol translation, edge processing, buffering, orchestration, and analytics ingestion. They stay hidden because each layer seems acceptable in isolation.
For project managers and engineering leaders, the practical takeaway is clear. Use industrial IoT data throughput analysis to test the full architecture under realistic conditions, measure usable end-to-end performance, and review scale readiness before rollout expands. The teams that do this early avoid delayed decisions, unstable deployments, and unnecessary procurement cycles.
In complex industrial environments, reliable throughput is not a feature you buy once. It is a system property you verify continuously. When teams treat it that way, they build IoT architectures that support growth instead of quietly constraining it.
Search News
Hot Articles
- Carbon Fiber StructuresHow to Specify Aerospace Carbon Fiber Assemblies for Lightweight, Load-Bearing PartsJul 11, 2026
- Machine VisionXiaomi, Alibaba DAMO Academy Drive Open-Source Robotics Model Ecosystem, Lowering Algorithm Development Barriers for Overseas SMEs Adopting Chinese Robotics SolutionsMar 30, 2026
- Cobots & ArmsShanxi 'AI+' Conference Showcases Embodied Intelligence with Multinational Buyer Engagement: Key Industry ImplicationsMar 30, 2026
Popular Tags
Recommended News
 Jul 11, 2026How to Specify Aerospace Carbon Fiber Assemblies for Lightweight, Load-Bearing PartsAerospace carbon fiber assemblies: learn how to specify laminate design, load data, joining methods, and inspection controls for lighter, reliable load-bearing aerospace parts.Elena Rostova (UAV Systems Researcher)
 Mar 30, 2026Xiaomi, Alibaba DAMO Academy Drive Open-Source Robotics Model Ecosystem, Lowering Algorithm Development Barriers for Overseas SMEs Adopting Chinese Robotics SolutionsXiaomi & Alibaba DAMO Academy's open-source robotics models lower algorithm barriers for global SMEs. Boost efficiency in manufacturing, logistics & smart retail with ROS 2 compatible solutions.TSV Data Lab
 Mar 30, 2026Shanxi 'AI+' Conference Showcases Embodied Intelligence with Multinational Buyer Engagement: Key Industry ImplicationsShanxi 'AI+' Conference highlights embodied intelligence with Tesla, Ubtech & Jiantao showcasing multimodal robotics. 40+ global buyers validated tech on-site, creating new B2B channels for industrial automation & AI solutions.Chen Wei (Automation Lead Engineer)
 Mar 30, 2026Zhongguancun Unveils 6G Integrated Sensing-Computing-Intelligence Platform to Empower Embodied Robots for Global Industrial ApplicationsZhongguancun's new 6G platform revolutionizes industrial robotics with <10ms latency, empowering global automotive, logistics & port automation. Discover how this tech boosts China's smart manufacturing exports.TSV Data Lab
 Mar 30, 2026Mech-Mind Tianjin Embodied Intelligence R&D and Production Base Goes Live, Cutting Delivery Time by 20%–30% for Global Customized AMR+Vision SolutionsMech-Mind's Tianjin AMR+Vision production base cuts delivery time by 20%-30% for欧美 & Latin American markets. Discover how this PLd-certified facility accelerates customized robotics solutions for smart manufacturing and logistics.Chen Wei (Automation Lead Engineer)
 Mar 30, 2026Boao Forum Reveals 'Co-evolution of Big and Small Brains' Trend in Humanoid Robots, China's Embodied Intelligence Accelerates Adaptation to Overseas Manufacturing Service ScenariosDiscover how China's humanoid robots, featuring 'Co-evolution of Big and Small Brains,' are revolutionizing global manufacturing. Learn about Embodied Tian Gong 3.0's ISO compliance and overseas deployment at Boao Forum 2026.Chen Wei (Automation Lead Engineer)
 Mar 30, 2026China Railway Industrial Secures Patent for Embodied Robotics in Material Handling, Boosting High-Precision Delivery Capabilities for Overseas Infrastructure and Manufacturing ProjectsChina Railway Industrial's new patent for embodied robotics in material handling boosts high-precision delivery for global infrastructure & manufacturing. Discover how this innovation enhances logistics accuracy in automotive, rail transit & EPC projects.Chen Wei (Automation Lead Engineer)
 Sep 28, 2026Spindle Runout Measurement in Germany: DIN Standards, Methods, and Acceptance LimitsSpindle runout measurement Germany: explore DIN standards, proven methods, acceptance limits, and audit-ready practices for reliable machining quality.Dr. Marcus Vance
 Sep 27, 2026How to Select Wall-Mount Edge Devices for Space-Constrained Factory NetworksWall mount edge devices for space-constrained factories: evaluate workload, thermal design, power resilience, cable access, and network reliability for smarter deployments.TSV Data Lab
 Sep 26, 2026Machining Tolerance Analysis: How to Set Limits That Meet Function and Cost TargetsMachining tolerance analysis: learn how to set functional limits, control tolerance stacks, reduce inspection risk, and balance precision with production cost.Dr. Marcus Vance
 Sep 25, 2026How to Evaluate an Industrial Infrastructure Data Platform for Multi-Site OperationsIndustrial infrastructure data platform evaluation guide for multi-site operations: compare data quality, edge resilience, interoperability, governance, and scalable proof-of-value criteria.Victor Lin (Chief Software Architect)
 Sep 24, 2026How to Select Machine Vision Optics for Accurate Inspection at Different Working DistancesMachine vision optics selection guide for accurate inspection at every working distance. Compare FOV, pixel scale, DOF, distortion, lighting, and telecentric options.TSV Data Lab
 Sep 23, 2026How to Evaluate a Machine Vision System Integrator for High-Speed Inspection LinesChoose a machine vision system integrator with proven expertise in high-speed inspection, reliable reject timing, robust optics, and measurable acceptance criteria.TSV Data Lab
 Sep 28, 2026When is a SCADA API the right choice for connecting plant systems?SCADA API guide: learn when governed plant data integration improves traceability, security, and scalability—without compromising real-time control.Victor Lin (Chief Software Architect)
 Sep 27, 2026How SCADA data integration improves traceability across production linesSCADA data integration connects production-line data to improve traceability, accelerate quality investigations, and strengthen safety decisions.Victor Lin (Chief Software Architect)
 Sep 26, 2026What to define before starting SCADA integration planningSCADA integration planning starts with clear scope, control boundaries, data models, cybersecurity, and testing. Discover the definitions that reduce risk and costly rework.Victor Lin (Chief Software Architect)
 Sep 25, 2026How a smart factory with Industrial IoT reduces production blind spotsDiscover how a smart factory with Industrial IoT turns real-time machine, quality, and workflow data into actionable insights that reduce production blind spots and delivery risks.Victor Lin (Chief Software Architect)
 Sep 24, 2026When does Industrial IoT make smart manufacturing easier to scale?Smart manufacturing Industrial IoT scales when trusted data, interoperable systems, and secure workflows turn connected assets into measurable gains.TSV Data Lab
 Sep 23, 2026What drives ultra-precision machining cost at 1-micron tolerance?Ultra precision machining cost per part at 1 micron tolerance depends on process, material, metrology, and yield. Learn how to compare quotes confidently.Dr. Marcus Vance
 Sep 22, 2026Drone Engine-T550CC Applications: Build the UAV Power System Around the MissionAn application guide for Drone Engine-T550CC integration, covering payload planning, airframe matching, cooling, fuel, vibration, test procedures, documentation, and service preparation.Elena Rostova (UAV Systems Researcher)
 Sep 22, 2026How to Evaluate Industrial Edge Computing Vendors for Factory DeploymentIndustrial edge computing vendor evaluation guide for factories: compare latency, protocol fit, reliability, security, and lifecycle support before deployment.TSV Data Lab
 Sep 21, 2026Drone Payload Integration: Matching Power, Data, and Center of Gravity for Reliable FlightsDrone payload integration made practical: balance power, data, center of gravity, and endurance to build safer, more reliable mission-ready flights.Elena Rostova (UAV Systems Researcher)
 Sep 20, 2026Autonomous Navigation Pricing: Cost Drivers and Budget Benchmarks for AMR ProjectsAutonomous navigation price explained: compare AMR cost drivers, software, sensors, integration, safety, and lifecycle budgets to build a scalable project plan.Chen Wei (Automation Lead Engineer)
 Sep 19, 2026How to Scope Automation Integration Services for Multi-System Factory ProjectsAutomation integration services: learn how to scope multi-system factory projects with clear workflows, interface contracts, safety boundaries, and acceptance criteria.Victor Lin (Chief Software Architect)