Can a Wind Resistance Rating Predict Stable Hovering on Site?
Publication Date
author
Can a uav wind resistance rating truly predict stable hovering on site, or does real-world performance depend more on flight controller latency benchmark results, uav center of gravity calculation, and drone propeller thrust efficiency? For engineers, operators, buyers, and decision-makers, this article cuts through marketing claims to examine the data that actually determines hover stability in construction, mining, and industrial UAV deployments.
In industrial UAV selection, the published wind resistance rating is often treated as a shortcut for reliability. A platform labeled as resistant to Level 6 wind may appear suitable for mapping, inspection, or corridor monitoring. Yet stable hovering on site is rarely determined by one headline specification alone. Hover quality depends on how the airframe, propulsion system, control loop, payload mass, and environmental turbulence interact over milliseconds, not just on a brochure claim.
This matters in B2B procurement because unstable hovering affects more than pilot comfort. It changes image sharpness, LiDAR point cloud consistency, thermal inspection accuracy, and battery reserve planning. In sectors such as mining, construction, and industrial asset management, a 10% to 20% loss in hover stability can create reflight costs, scheduling delays, and weaker data confidence across the entire project cycle.
For teams following a data-first evaluation model, the right question is not whether the wind resistance rating matters, but how much it predicts under real operational conditions. A more useful benchmark combines rated wind tolerance with controller latency, thrust margin, center of gravity discipline, payload integration quality, and the actual turbulence profile of the site.
Why Wind Resistance Rating Is Useful but Incomplete
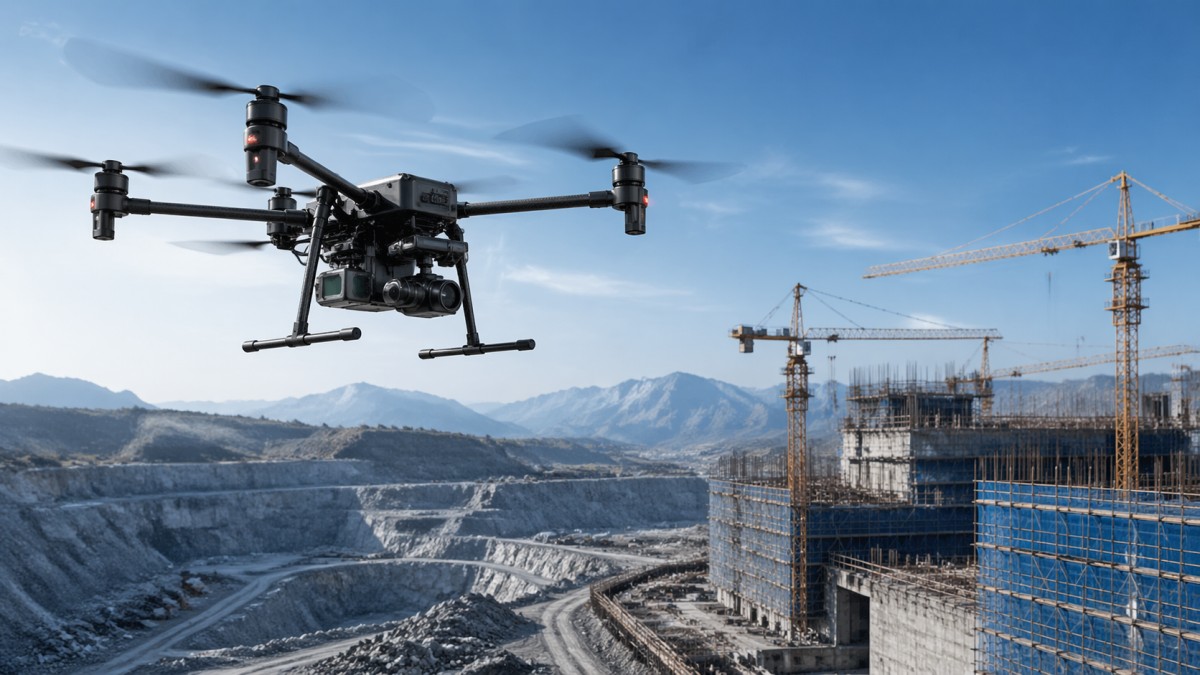
A wind resistance rating is a useful starting metric because it gives operators and buyers a standardized idea of the external disturbance a UAV can counter in controlled conditions. In most commercial specifications, this is expressed in meters per second, such as 10 m/s, 12 m/s, or 15 m/s. Some vendors also translate it into the Beaufort scale, but that translation can oversimplify engineering reality.
The first limitation is that wind speed alone does not describe turbulence intensity. A site with an average horizontal wind of 8 m/s may still generate localized gusts above 12 m/s near cranes, pit edges, facades, conveyors, or rotating machinery. For multirotor UAVs, these short-duration disturbances can create positional oscillation even if the aircraft remains technically within its rated limit.
The second limitation is test methodology. A published wind resistance rating may be based on hover tests with an empty payload bay, nominal battery state, and ideal controller tuning. Once a camera gimbal, LiDAR payload, multispectral sensor, or third-party communication module is added, the drag profile changes. A platform that holds position within ±0.3 m in the factory may drift to ±0.8 m or more in the field when the payload geometry alters the airframe balance.
The third limitation is that stable hovering is a quality metric, not just a survivability metric. A UAV may stay airborne in 12 m/s wind yet still fail the mission if image overlap drops below mapping requirements, if inspection footage becomes unusable, or if the battery margin shrinks below a safe return threshold of 20% to 25%.
What the rating can tell you
- Whether the UAV can resist a defined range of steady external airflow.
- Whether the propulsion and control system likely have basic disturbance rejection capacity.
- Whether the aircraft may be suitable for preliminary screening in open-field applications.
What the rating cannot tell you
- How the UAV will respond to gust frequency, recirculating airflow, or rotor wash interaction near structures.
- How much hover error increases when payload mass rises by 0.5 kg to 2 kg.
- How flight controller latency and motor response affect correction quality over repeated micro-adjustments.
For procurement teams, the practical takeaway is straightforward: a wind resistance rating should be treated as one input in a broader stability benchmark, not as a stand-alone purchase decision.
The Metrics That Predict Real Hover Stability Better
When site performance matters, three engineering indicators usually predict stable hovering more reliably than the headline wind rating alone: flight controller latency, center of gravity alignment, and propeller thrust efficiency. These factors shape how quickly and how cleanly the aircraft converts sensor feedback into corrective motion.
Flight controller latency refers to the total delay between disturbance detection and actuator response. In practical benchmarking, lower latency generally supports tighter hover correction. For industrial multirotors, control response in the low tens of milliseconds is often preferable to slower loops, especially when the aircraft is carrying optical or scanning payloads that amplify vibration sensitivity.
Center of gravity calculation is equally important. A UAV with a poorly distributed payload may still lift off normally, yet it will require constant asymmetric motor compensation. That increases current draw, creates uneven thermal loading across motors, and reduces positional stability in crosswinds. Even a 10 mm to 20 mm offset from the intended center can materially affect hover smoothness on some compact platforms.
Propeller thrust efficiency determines how much corrective authority the aircraft retains once wind loads rise. If the propulsion system operates too close to saturation during nominal hover, there is little thrust reserve left for gust rejection. This is one reason two UAVs with the same rated wind resistance can perform very differently on a live site.
Key stability metrics to verify during evaluation
The table below shows a practical screening framework for engineering teams comparing platforms for stable hovering rather than just spec-sheet survivability.
The main conclusion is that hover stability is a systems problem. Teams that validate at least 4 metrics instead of 1 usually reduce the risk of selecting an aircraft that looks strong on paper but underperforms near real infrastructure.
A practical engineering checklist
- Measure hover current draw with the actual payload, not a dummy mass alone.
- Check center of gravity after every camera, gimbal, or sensor integration change.
- Review control loop tuning under 3 wind bands, such as 0–5 m/s, 5–8 m/s, and 8–12 m/s.
- Observe whether position hold remains within the mission tolerance required by your data product.
How Site Conditions Distort Hover Performance in Construction, Mining, and Industry
On-site hover stability depends heavily on the airflow environment, and that environment varies dramatically across industrial settings. Construction sites often create turbulent pockets around unfinished facades, tower cranes, scaffolding, and open shafts. Mining sites introduce pit-wall recirculation, haul-road dust plumes, and thermal gradients during midday operations. Industrial plants add stack emissions, rotating equipment airflow, and metallic structures that can complicate sensor performance.
These conditions matter because a UAV can be fully compliant with its rated wind resistance and still show unstable micro-movements that affect data quality. In mapping, repeated drift may reduce sidelap or frontlap if hover pauses are required. In thermal inspection, the angle variation from repeated correction cycles can change the apparent signature of hotspots. In LiDAR scanning, even modest attitude instability can degrade point cloud uniformity.
Another field factor is battery state. As the battery drops from 100% toward 30%, available voltage headroom and power delivery characteristics change. On some missions, hover stability in 9 m/s wind may be acceptable in the first 8 minutes but degrade in the final third of the flight. Procurement decisions should therefore consider not only maximum wind claims but also stability consistency across the whole discharge curve.
Operators should also distinguish between open-area hover and structure-adjacent hover. A UAV that performs well 30 meters above open ground may behave differently when hovering 3 to 5 meters from a vertical wall or directly above a conveyor corridor. This is why site-specific validation flights are more valuable than generic demo days in calm weather.
Common hover risks by application environment
The following comparison helps project teams translate environmental risk into test priorities before purchase or deployment.
The key lesson is that site turbulence is not abstract. It is specific, repeatable, and measurable. Teams that benchmark hover quality in the exact operating environment can avoid expensive false confidence from broad wind resistance marketing.
A Better Procurement Framework for Buyers and Technical Decision-Makers
For buyers, the most effective purchasing model is a weighted evaluation framework rather than a spec-sheet comparison based on one or two headline numbers. In practice, procurement teams can score hover stability across at least 5 dimensions: environmental fit, payload integration, control response, propulsion margin, and field maintainability.
This approach is especially useful when several vendors list similar wind resistance ratings, such as 12 m/s or 15 m/s. At that point, the real difference often appears in secondary engineering performance: how quickly the aircraft settles after a gust, how much extra battery it consumes while holding position, and whether the payload remains within its own vibration tolerance.
A rigorous sourcing process should include at least 3 validation stages. Stage 1 is documentation review, including payload compatibility, center of gravity limits, and nominal hover power draw. Stage 2 is controlled flight testing, ideally in 2 to 3 wind conditions. Stage 3 is site-representative verification under the actual mission profile, including hover duration, battery reserve, and data quality checks.
For enterprise decision-makers, this method does more than improve technical selection. It shortens trial-and-error cycles, improves cross-functional alignment between pilots and procurement, and reduces the risk of buying an aircraft that requires retrofits after deployment.
Suggested procurement decision matrix
The matrix below can be adapted into a supplier comparison sheet for internal approval, RFQ review, or pilot project acceptance.
Teams that convert these questions into scored procurement criteria typically make stronger decisions than teams relying on marketing labels alone. The goal is not to dismiss wind resistance ratings, but to place them inside a traceable engineering selection model.
Minimum buying checklist for industrial UAV hover stability
- Confirm the aircraft was tested with the intended payload class and not only with a baseline configuration.
- Request hover performance evidence in at least 2 realistic wind bands.
- Review center of gravity limits, mounting guidance, and any counterweight requirements.
- Check whether stable hovering remains acceptable with battery state below 40%.
- Validate spare part and maintenance availability over a 12-month to 24-month operating horizon.
Implementation, Testing, and Operational Best Practices
After purchase, hover stability still depends on implementation discipline. Even a strong platform can lose performance if payload mounting is inconsistent, propellers are worn, firmware parameters are mismatched, or battery health drifts across the fleet. Stable hovering should therefore be treated as an operational KPI, not just a launch-day specification.
A practical commissioning process usually includes 4 steps. First, verify mechanical balance and center of gravity using the exact field payload. Second, run short hover tests at low altitude to identify drift, motor asymmetry, or vibration signatures. Third, test in progressively harsher airflow conditions. Fourth, validate mission output quality, such as image sharpness, thermal repeatability, or point cloud consistency.
Maintenance also matters. Propeller edge wear, motor bearing friction, arm rigidity loss, and loose mounting hardware all reduce correction precision over time. For high-utilization fleets, visual inspection before each shift and deeper inspection every 25 to 50 flight hours can help preserve hover reliability. Exact intervals depend on mission severity, dust exposure, and payload weight.
For operations managers, the most valuable practice is to track trend data rather than waiting for failure. If the same UAV starts using 8% more power to hold a standard hover profile, or if positional variance rises noticeably under the same wind band, the fleet may be signaling a maintenance issue or a configuration drift that should be corrected before it affects mission output.
FAQ for engineers, operators, and buyers
Does a higher wind resistance rating always mean better hover stability?
No. A higher rating indicates stronger disturbance tolerance in test conditions, but stable hovering also depends on controller response, thrust reserve, payload drag, and center of gravity accuracy. Two UAVs rated at 12 m/s can still perform very differently on a mining or construction site.
What is the most overlooked cause of unstable hover after payload integration?
Poor center of gravity management is one of the most common issues. Even small offsets can force continuous motor compensation, increasing current draw and reducing correction smoothness. This often appears after camera swaps, bracket changes, or third-party sensor additions.
How should buyers test hover stability before final approval?
Use a 3-stage approach: document review, controlled field trial, and site-representative mission test. Measure hover behavior with the real payload, in at least 2 wind bands, and during different battery states. The acceptance standard should be linked to the required data output, not only to pilot perception.
How often should an industrial UAV be checked for hover-related performance drift?
For frequent commercial use, pre-flight checks should happen every mission day, while deeper inspection is often appropriate every 25 to 50 flight hours. Fleets operating in dusty mines, high-temperature plants, or coastal sites may need shorter intervals.
A wind resistance rating can help narrow the shortlist, but it cannot by itself predict stable hovering on site. Real stability is defined by a combination of control latency, center of gravity discipline, propeller thrust efficiency, payload integration, and site-specific turbulence. For technical teams and procurement leaders, the safest path is to replace marketing shortcuts with measurable engineering benchmarks.
TechStat Vanguard supports a data-driven approach to hard-tech evaluation by focusing on parameters that change field outcomes, not just brochure language. If your team is comparing industrial UAV platforms for mapping, inspection, or infrastructure operations, now is the right time to build a more rigorous hover stability benchmark. Contact us to discuss your application profile, request a tailored evaluation framework, or explore deeper technical benchmarking for UAV sourcing decisions.
Search News
Hot Articles
- Carbon Fiber StructuresHow to Specify Aerospace Carbon Fiber Assemblies for Lightweight, Load-Bearing PartsJul 11, 2026
- Machine VisionXiaomi, Alibaba DAMO Academy Drive Open-Source Robotics Model Ecosystem, Lowering Algorithm Development Barriers for Overseas SMEs Adopting Chinese Robotics SolutionsMar 30, 2026
- Cobots & ArmsShanxi 'AI+' Conference Showcases Embodied Intelligence with Multinational Buyer Engagement: Key Industry ImplicationsMar 30, 2026
Popular Tags
Recommended News
 Jul 11, 2026How to Specify Aerospace Carbon Fiber Assemblies for Lightweight, Load-Bearing PartsAerospace carbon fiber assemblies: learn how to specify laminate design, load data, joining methods, and inspection controls for lighter, reliable load-bearing aerospace parts.Elena Rostova (UAV Systems Researcher)
 Mar 30, 2026Xiaomi, Alibaba DAMO Academy Drive Open-Source Robotics Model Ecosystem, Lowering Algorithm Development Barriers for Overseas SMEs Adopting Chinese Robotics SolutionsXiaomi & Alibaba DAMO Academy's open-source robotics models lower algorithm barriers for global SMEs. Boost efficiency in manufacturing, logistics & smart retail with ROS 2 compatible solutions.TSV Data Lab
 Mar 30, 2026Shanxi 'AI+' Conference Showcases Embodied Intelligence with Multinational Buyer Engagement: Key Industry ImplicationsShanxi 'AI+' Conference highlights embodied intelligence with Tesla, Ubtech & Jiantao showcasing multimodal robotics. 40+ global buyers validated tech on-site, creating new B2B channels for industrial automation & AI solutions.Chen Wei (Automation Lead Engineer)
 Mar 30, 2026Zhongguancun Unveils 6G Integrated Sensing-Computing-Intelligence Platform to Empower Embodied Robots for Global Industrial ApplicationsZhongguancun's new 6G platform revolutionizes industrial robotics with <10ms latency, empowering global automotive, logistics & port automation. Discover how this tech boosts China's smart manufacturing exports.TSV Data Lab
 Mar 30, 2026Mech-Mind Tianjin Embodied Intelligence R&D and Production Base Goes Live, Cutting Delivery Time by 20%–30% for Global Customized AMR+Vision SolutionsMech-Mind's Tianjin AMR+Vision production base cuts delivery time by 20%-30% for欧美 & Latin American markets. Discover how this PLd-certified facility accelerates customized robotics solutions for smart manufacturing and logistics.Chen Wei (Automation Lead Engineer)
 Mar 30, 2026Boao Forum Reveals 'Co-evolution of Big and Small Brains' Trend in Humanoid Robots, China's Embodied Intelligence Accelerates Adaptation to Overseas Manufacturing Service ScenariosDiscover how China's humanoid robots, featuring 'Co-evolution of Big and Small Brains,' are revolutionizing global manufacturing. Learn about Embodied Tian Gong 3.0's ISO compliance and overseas deployment at Boao Forum 2026.Chen Wei (Automation Lead Engineer)
 Mar 30, 2026China Railway Industrial Secures Patent for Embodied Robotics in Material Handling, Boosting High-Precision Delivery Capabilities for Overseas Infrastructure and Manufacturing ProjectsChina Railway Industrial's new patent for embodied robotics in material handling boosts high-precision delivery for global infrastructure & manufacturing. Discover how this innovation enhances logistics accuracy in automotive, rail transit & EPC projects.Chen Wei (Automation Lead Engineer)
 Oct 22, 2026KUKA Showcases Physical AI and iiQKA.AI Vision at NVIDIA GTC BerlinExplore KUKA’s Physical AI showcase at NVIDIA GTC Berlin and discover how iiQKA.AI Vision aims to simplify robotic vision integration and improve 2D and 3D scene recognition.TSV Data Lab
 Oct 22, 2026Robotic Machining of Advanced Composites: What Tolerances Are Achievable?Explore advanced materials machining robotics: discover what drives achievable composite tolerances and how to validate accuracy before investing in your next machining system.Dr. Marcus Vance
 Oct 21, 2026China’s Industrial Robot Exports Near RMB 10 Billion in First Nine Months of 2026China’s industrial robot exports neared RMB 10 billion in January–September 2026, with value rising faster than volume. Explore the data and what it could mean for suppliers.Chen Wei (Automation Lead Engineer)
 Oct 21, 2026Low-Latency Industrial Data Processing: Pricing and Key Cost DriversExplore industrial data latency price drivers, from edge hardware to integration and support. Learn how to compare quotes, verify performance, and avoid unnecessary costs.TSV Data Lab
 Oct 20, 2026KUKA Launches iiQKA.AI Vision to Simplify Industrial Image ProcessingKUKA iiQKA.AI Vision simplifies industrial image processing with controller-based 2D and 3D vision. Explore drag-and-drop setup for vision-guided automation.TSV Data Lab
 Oct 20, 2026Smart Industrial Edge Devices: Key Criteria for Legacy PLC IntegrationChoose smart industrial edge devices for legacy PLC integration. Discover key criteria for compatibility, data quality, security, and reliable collection without disrupting control.TSV Data Lab
 Oct 19, 2026Choosing a Radar Sensor by Application: Range, Resolution, and Field of ViewSimplify radar sensor application based product selection. Compare range, resolution, and field of view to avoid blind spots and choose with confidence. Explore the guide.TSV Data Lab
 Oct 18, 2026Comparing Material Options for Procurement: Specs, Costs, and Supply RisksExplore procurement oriented technical content on material options, specs, costs, and supply risks. Compare alternatives to cut hidden expenses and make confident sourcing decisions.Dr. Marcus Vance
 Oct 17, 20265-Axis CNC Positioning Accuracy: How to Interpret ISO 230-2 Test ResultsAssess 5 axis CNC machining positioning accuracy with ISO 230-2. Learn to interpret repeatability, reversal error, and test conditions to compare suppliers and make confident acceptance decisions.Dr. Marcus Vance
 Oct 16, 2026Choosing a Rugged Edge AI Box Supplier: Thermal Tests and Lifecycle SupportChoose a rugged edge AI box supplier with proven thermal performance and reliable lifecycle support. Discover the tests and commitments to verify before you buy.TSV Data Lab
 Oct 15, 2026R&D Cost Reduction Services: How to Evaluate Fees, Savings, and ROIEvaluate R&D cost reduction services with confidence. Compare fees, verify savings, and calculate ROI without compromising performance. Discover how to choose a provider that delivers real value.Chen Wei (Automation Lead Engineer)
 Oct 22, 2026How Do You Test AMR Navigation Accuracy in a Warehouse?Test AMR navigation accuracy in warehouses with practical methods for localization, path tracking, and docking. Learn to set tolerances and compare robots before deployment.Chen Wei (Automation Lead Engineer)
 Oct 21, 2026How Should You Balance Cobot Payload Against Reach?Explore cobot payload versus reach to choose the right robot. Learn how tooling, load limits, workspace, and cycle time affect performance—and avoid costly selection mistakes.Chen Wei (Automation Lead Engineer)
 Oct 20, 2026How Do You Measure Industrial IoT Gateway Latency Under Load?Measure industrial IoT gateway latency under load with reliable timestamps, realistic traffic, and tail-latency analysis. Discover how to expose bottlenecks and choose the right gateway.TSV Data Lab
 Oct 19, 2026How Do You Verify That Precision Machined Parts Meet Tolerances?Master precision machining tolerance verification with the right tools, datum setups, and acceptance rules. Learn how to validate parts confidently and reduce costly inspection errors.Dr. Marcus Vance
 Oct 18, 2026What Should an AS9100 Machining Supplier Checklist Include?Build an AS9100 machining supplier checklist that verifies capability, traceability, inspection, and outsourced processes. Discover what to check before approving your next aerospace supplier.Dr. Marcus Vance
 Oct 17, 2026How Should You Interpret Industrial Robot Repeatability Specs?Decode industrial robot repeatability specifications, understand ISO 9283 test conditions, and avoid costly selection mistakes. Learn how to verify performance for your process.Chen Wei (Automation Lead Engineer)