What an industrial robot payload vs reach chart really shows
Publication Date
author
An industrial robot payload vs reach chart is more than a brochure graphic—it reveals the real performance trade-offs that determine cell design, tooling feasibility, and cycle stability. For technical evaluators, reading this chart correctly helps separate usable engineering data from simplified marketing claims, reducing selection risk before detailed simulation, integration, and supplier qualification begin.
In general industry applications, this chart affects welding, palletizing, machine tending, dispensing, assembly, and inspection decisions. It translates robot geometry into practical limits that shape end-effector mass, acceleration, fixture spacing, and safe working envelopes.
TechStat Vanguard approaches the industrial robot payload vs reach chart as engineering evidence. The chart is useful only when interpreted with inertia, mounting posture, wrist torque, and duty cycle, not payload alone.
Why the industrial robot payload vs reach chart matters before layout freezes
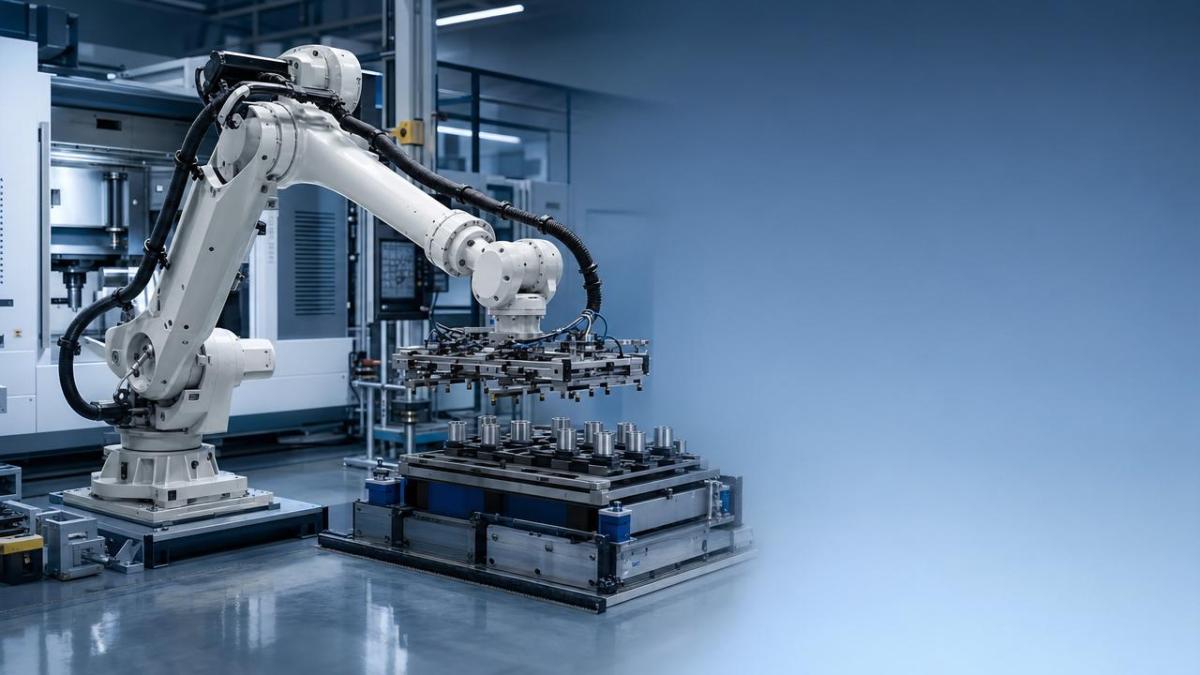
A robot can often carry its rated payload only at a limited distance. As reach extends, usable load capacity, stiffness, and dynamic stability may decrease.
That is why an industrial robot payload vs reach chart should be read early, before gripper design, pedestal height, and part presentation are fixed.
In many projects, selection errors start with one assumption: rated payload equals real application payload. The chart shows that this assumption is usually incomplete.
It also reveals whether the robot works near its envelope edge. Edge operation can affect repeatability, vibration response, cable routing stress, and cycle-time consistency.
Scenario background: different production tasks read the chart differently
The same industrial robot payload vs reach chart means different things in different cells. A pick-and-place line values speed. A machining cell values stiffness. A palletizing station values vertical stack access.
Because of that, chart interpretation should begin with application physics. Reach is not only distance. It is distance combined with tool orientation, acceleration, and center-of-gravity behavior.
A short cycle with light parts may still fail if the tool has high moment load. A heavier part may still work if the center of gravity is close and motion is gentle.
Scenario 1: machine tending needs more than nominal payload
Machine tending often looks simple on paper. The part weight may seem well below the robot rating. The industrial robot payload vs reach chart often tells a different story.
Door clearance, chuck depth, and fixture intrusion can force the wrist far forward. That increases moment load and reduces stable acceleration during insertion and extraction.
Core judgment points
- Tool length from wrist flange to part center
- Part weight plus gripper, sensors, and adapters
- Approach angle inside the machine envelope
- Required acceleration during transfer and seating
If the chart shows strong payload drop at long reach, pedestal repositioning may solve more than buying a larger robot. Layout changes can recover stiffness and cycle time.
Scenario 2: palletizing and depalletizing depend on stack geometry
Palletizing cells often focus on maximum reach first. Yet the industrial robot payload vs reach chart matters equally because top-layer access and far-corner picks create the worst-case geometry.
A carton may be light, but vacuum tooling, multi-pick frames, and long offsets add leverage. Vertical motion at extended reach can also reduce smoothness near full stack height.
Core judgment points
- Farthest pallet corner distance
- Highest stack layer and wrist orientation
- Tooling weight growth from future SKU changes
- Dynamic vacuum loss risk during fast moves
The chart becomes especially important when one robot serves two pallet positions. A longer reach may reduce available load margin at the exact point where the pattern is most difficult.
Scenario 3: welding and dispensing require stability across the path
In arc welding, adhesive dispensing, and sealing, payload is usually not the main limit. The industrial robot payload vs reach chart still matters because long reach affects stiffness and path stability.
A torch or dispensing head may be light, but extended arm posture can increase deflection and reduce contour accuracy during curved or multi-axis paths.
Core judgment points
- Path segments executed near maximum reach
- Orientation changes at the wrist
- Cable package effects on motion resistance
- Tolerance sensitivity of bead width or seam tracking
For these processes, the chart should be paired with repeatability data, path tests, and controller tuning limits. Reach alone cannot predict process quality.
Scenario 4: assembly and inspection care about inertia, not only mass
Assembly and vision inspection tools are often lightweight. Even so, the industrial robot payload vs reach chart remains relevant because elongated fixtures can create high inertia with low mass.
A camera mast, probing frame, or dual-gripper arrangement may fall within payload rating yet exceed practical dynamic limits at longer reach.
Core judgment points
- Center-of-gravity offset from the wrist flange
- Required settling time before measurement
- Sensitivity to vibration and overshoot
- Multi-tool changeover plans
How scenario requirements differ when reading one chart
Practical adaptation advice for interpreting an industrial robot payload vs reach chart
Use the chart as the starting screen, not the final decision. A robust review combines chart limits with geometry, speed targets, and process tolerance requirements.
- Calculate total carried mass, including gripper, brackets, hoses, dress pack, and part.
- Measure center-of-gravity distance from the wrist flange, not from the tool body.
- Map the farthest working points and the orientation needed at those points.
- Check acceleration demands against process needs, especially for short cycle applications.
- Review mounting condition, because floor, wall, and inverted mounting can change practical behavior.
- Request wrist moment and inertia limits, not only payload and reach values.
- Validate with offline simulation, then confirm using a physical trial or reference installation data.
Common misreads and overlooked points
One common mistake is treating the chart as a universal guarantee. In reality, an industrial robot payload vs reach chart usually reflects defined conditions and simplified assumptions.
Another mistake is ignoring duty cycle. A robot that can complete one motion may still run hot, unstable, or slow during continuous production.
Cable routing is also underestimated. Dress packs can add resistance, change balance, and reduce path quality near difficult postures.
Future product variation matters too. If the chart leaves little margin today, tooling upgrades or larger parts can force a redesign later.
The best engineering practice is to read the industrial robot payload vs reach chart together with reach envelope drawings, inertia limits, repeatability data, and application-specific motion tests.
Next-step actions for lower-risk robot selection
Build a simple decision sheet before comparing robot models. Include worst-case reach point, total tool mass, center-of-gravity offset, orientation, target cycle, and expected future variation.
Then compare each industrial robot payload vs reach chart against the same worksheet. This removes brochure bias and highlights where a layout change may outperform an upsized robot.
TechStat Vanguard recommends using chart data as part of a broader evidence stack: specification review, simulation, path validation, and traceable engineering assumptions. That approach turns selection from marketing interpretation into measurable technical judgment.
When read correctly, an industrial robot payload vs reach chart does not just describe a robot. It defines the boundary between feasible automation and hidden integration risk.
Search News
Hot Articles
- Carbon Fiber StructuresHow to Specify Aerospace Carbon Fiber Assemblies for Lightweight, Load-Bearing PartsJul 11, 2026
- Machine VisionXiaomi, Alibaba DAMO Academy Drive Open-Source Robotics Model Ecosystem, Lowering Algorithm Development Barriers for Overseas SMEs Adopting Chinese Robotics SolutionsMar 30, 2026
- Cobots & ArmsShanxi 'AI+' Conference Showcases Embodied Intelligence with Multinational Buyer Engagement: Key Industry ImplicationsMar 30, 2026
Popular Tags
Recommended News
 Jul 11, 2026How to Specify Aerospace Carbon Fiber Assemblies for Lightweight, Load-Bearing PartsAerospace carbon fiber assemblies: learn how to specify laminate design, load data, joining methods, and inspection controls for lighter, reliable load-bearing aerospace parts.Elena Rostova (UAV Systems Researcher)
 Mar 30, 2026Xiaomi, Alibaba DAMO Academy Drive Open-Source Robotics Model Ecosystem, Lowering Algorithm Development Barriers for Overseas SMEs Adopting Chinese Robotics SolutionsXiaomi & Alibaba DAMO Academy's open-source robotics models lower algorithm barriers for global SMEs. Boost efficiency in manufacturing, logistics & smart retail with ROS 2 compatible solutions.TSV Data Lab
 Mar 30, 2026Shanxi 'AI+' Conference Showcases Embodied Intelligence with Multinational Buyer Engagement: Key Industry ImplicationsShanxi 'AI+' Conference highlights embodied intelligence with Tesla, Ubtech & Jiantao showcasing multimodal robotics. 40+ global buyers validated tech on-site, creating new B2B channels for industrial automation & AI solutions.Chen Wei (Automation Lead Engineer)
 Mar 30, 2026Zhongguancun Unveils 6G Integrated Sensing-Computing-Intelligence Platform to Empower Embodied Robots for Global Industrial ApplicationsZhongguancun's new 6G platform revolutionizes industrial robotics with <10ms latency, empowering global automotive, logistics & port automation. Discover how this tech boosts China's smart manufacturing exports.TSV Data Lab
 Mar 30, 2026Mech-Mind Tianjin Embodied Intelligence R&D and Production Base Goes Live, Cutting Delivery Time by 20%–30% for Global Customized AMR+Vision SolutionsMech-Mind's Tianjin AMR+Vision production base cuts delivery time by 20%-30% for欧美 & Latin American markets. Discover how this PLd-certified facility accelerates customized robotics solutions for smart manufacturing and logistics.Chen Wei (Automation Lead Engineer)
 Mar 30, 2026Boao Forum Reveals 'Co-evolution of Big and Small Brains' Trend in Humanoid Robots, China's Embodied Intelligence Accelerates Adaptation to Overseas Manufacturing Service ScenariosDiscover how China's humanoid robots, featuring 'Co-evolution of Big and Small Brains,' are revolutionizing global manufacturing. Learn about Embodied Tian Gong 3.0's ISO compliance and overseas deployment at Boao Forum 2026.Chen Wei (Automation Lead Engineer)
 Mar 30, 2026China Railway Industrial Secures Patent for Embodied Robotics in Material Handling, Boosting High-Precision Delivery Capabilities for Overseas Infrastructure and Manufacturing ProjectsChina Railway Industrial's new patent for embodied robotics in material handling boosts high-precision delivery for global infrastructure & manufacturing. Discover how this innovation enhances logistics accuracy in automotive, rail transit & EPC projects.Chen Wei (Automation Lead Engineer)
 Oct 03, 2026Selecting Automotive Radar Sensor Modules for ADAS Range, Resolution, and IntegrationAutomotive radar sensor module selection guide for ADAS: compare range, resolution, field of view, latency, and integration to build safer, reliable vehicle systems.TSV Data Lab
 Oct 02, 2026How to Qualify Machined Parts Suppliers for Hard Tech ProgramsHard tech supply chain machined parts demand rigorous supplier qualification. Learn how to assess capability, traceability, quality controls, and delivery resilience.Dr. Marcus Vance
 Oct 01, 2026How to Select an Outdoor Security Radar Sensor for Perimeter Detection?Outdoor security radar sensor selection guide: compare range, accuracy, false-alarm control, integration, and field testing for reliable perimeter detection.TSV Data Lab
 Sep 30, 2026How to Evaluate Solid-State LiDAR Hardware for Outdoor Autonomous VehiclesSolid state LiDAR hardware evaluation guide for outdoor autonomous vehicles—compare range, point-cloud quality, environmental resilience, integration, and safety.TSV Data Lab
 Sep 29, 2026ISO 9283 Repeatability: How to Evaluate Cobot Positioning PerformanceISO 9283 cobot repeatability explained: learn how payload, reach, approach direction, and test conditions affect positioning performance and cell capability.Chen Wei (Automation Lead Engineer)
 Oct 03, 2026Is Edge Computing Necessary for Real-Time Quality Inspection?Is industrial edge computing necessary for real-time quality inspection? Explore how latency, data volume, reliability, and control integration shape the right architecture.TSV Data Lab
 Oct 02, 2026What Documents Prove a Precision Machining Supplier Can Hold Tolerance?What documents prove a precision machining supplier can hold tolerance? Explore certificates, FAI reports, calibration, SPC, and traceability evidence to qualify suppliers with confidence.Dr. Marcus Vance
 Oct 01, 2026Can a Machining Supplier Meet Aerospace Fatigue Testing Requirements?Can a machining supplier meet aerospace fatigue testing requirements? Learn the traceability, process control, and test evidence needed for reliable aerospace parts.Dr. Marcus Vance
 Sep 30, 2026Which Industrial Robot Specifications Matter for High-Precision Assembly?Which industrial robot specifications matter most for high-precision assembly? Explore repeatability, accuracy, stiffness, vibration, calibration, and force control for reliable yields.Chen Wei (Automation Lead Engineer)
 Sep 29, 2026How Do You Verify Servo Motor Torque Under Continuous Load?How do I verify servo motor torque under continuous load? Learn RMS torque checks, torque-speed limits, thermal derating, and real-machine testing.Chen Wei (Automation Lead Engineer)
 Oct 02, 2026ZD330 Software Configuration: Verifying Cut-List Import Before PurchaseZD330 software and machine configuration: verify cut-list imports, data mapping, labels, and workflow before purchase to reduce errors and choose with confidence.Victor Lin (Chief Software Architect)
 Sep 28, 2026Spindle Runout Measurement in Germany: DIN Standards, Methods, and Acceptance LimitsSpindle runout measurement Germany: explore DIN standards, proven methods, acceptance limits, and audit-ready practices for reliable machining quality.Dr. Marcus Vance
 Sep 27, 2026How to Select Wall-Mount Edge Devices for Space-Constrained Factory NetworksWall mount edge devices for space-constrained factories: evaluate workload, thermal design, power resilience, cable access, and network reliability for smarter deployments.TSV Data Lab
 Sep 26, 2026Machining Tolerance Analysis: How to Set Limits That Meet Function and Cost TargetsMachining tolerance analysis: learn how to set functional limits, control tolerance stacks, reduce inspection risk, and balance precision with production cost.Dr. Marcus Vance
 Sep 25, 2026How to Evaluate an Industrial Infrastructure Data Platform for Multi-Site OperationsIndustrial infrastructure data platform evaluation guide for multi-site operations: compare data quality, edge resilience, interoperability, governance, and scalable proof-of-value criteria.Victor Lin (Chief Software Architect)
 Sep 24, 2026How to Select Machine Vision Optics for Accurate Inspection at Different Working DistancesMachine vision optics selection guide for accurate inspection at every working distance. Compare FOV, pixel scale, DOF, distortion, lighting, and telecentric options.TSV Data Lab
 Sep 23, 2026How to Evaluate a Machine Vision System Integrator for High-Speed Inspection LinesChoose a machine vision system integrator with proven expertise in high-speed inspection, reliable reject timing, robust optics, and measurable acceptance criteria.TSV Data Lab