3D printing titanium porosity test results can be misleading
Publication Date
author
In advanced manufacturing, the 3d printing titanium porosity test is often treated as a final verdict on part quality.
That confidence is understandable, but it is not always justified.
A low porosity number may still hide process instability, local defects, or fatigue risk.
A high porosity number may also overstate danger when thresholds, sampling, or scan resolution are poorly aligned.
For titanium additive manufacturing, the real issue is not whether testing matters.
It is whether the reported 3d printing titanium porosity test reflects the true condition of the part.
What a 3d printing titanium porosity test actually measures
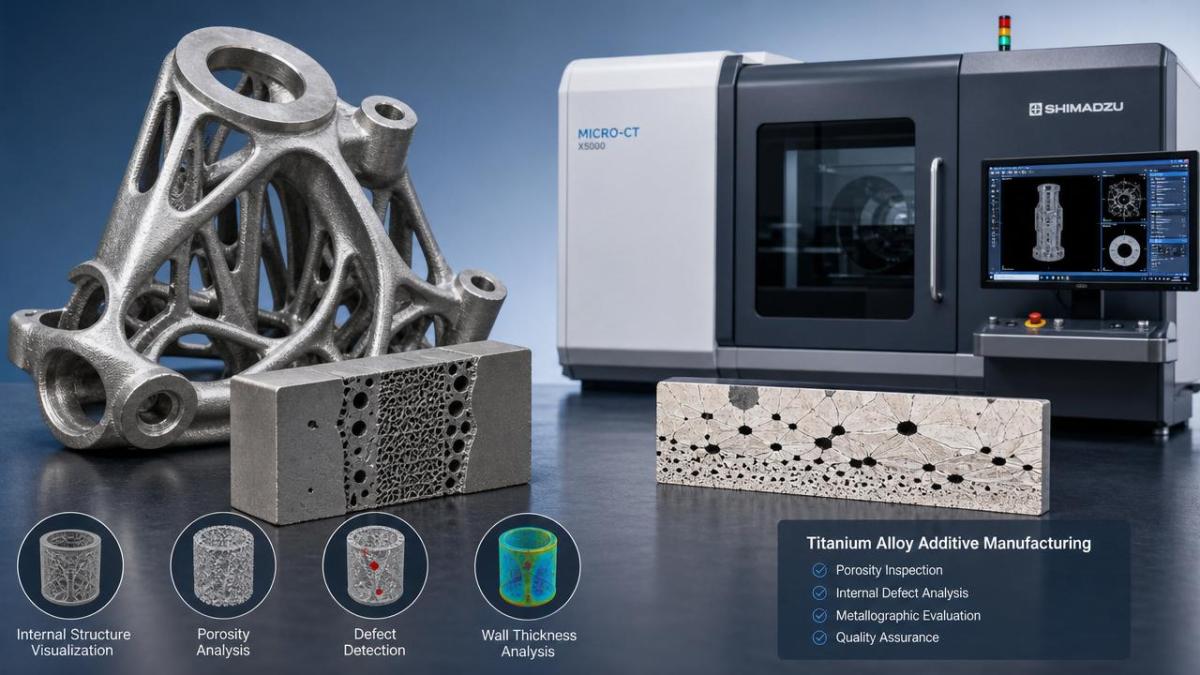
A 3d printing titanium porosity test estimates void content inside a printed component or coupon.
Those voids may come from lack of fusion, trapped gas, keyholing, contamination, or unstable energy input.
In titanium, even small pores can affect fatigue life, crack initiation, and post-machining reliability.
However, porosity is not one simple number.
It includes pore size, shape, location, clustering, orientation, and distribution across the build volume.
A report showing 0.05% porosity may look excellent.
Yet the same part could still contain one critical defect near a stress concentration zone.
That is why the 3d printing titanium porosity test should be read as one data layer, not the whole truth.
Common test methods
- Micro-CT scanning for internal defect mapping
- Metallographic cross-sections for polished area inspection
- Archimedes density comparison for bulk density estimation
- Ultrasonic or other NDT methods for larger defect detection
Each method reveals different aspects of porosity.
None is automatically complete without context.
Why results can become misleading in real production
The biggest problem is false precision.
A porosity value with several decimal places looks objective, but the path behind it may be weak.
In many industrial reviews, the number is separated from sampling logic and process history.
That separation creates risk.
Key distortion sources
A 3d printing titanium porosity test can therefore be technically correct and still operationally misleading.
That distinction matters in aerospace, medical, energy, and high-load automation components.
Industry background and current areas of concern
Titanium additive manufacturing is expanding because it combines weight reduction, geometry freedom, and consolidation of complex assemblies.
At the same time, qualification pressure is rising.
More organizations now ask whether a single 3d printing titanium porosity test can support reliable acceptance decisions.
Signals shaping current evaluation practice
- Greater use of LPBF titanium in flight-critical and thermal-loaded parts
- Higher demand for traceable parameter sets and machine stability records
- Stronger interest in pore morphology, not just total porosity percentage
- Growing reliance on CT data for internal quality verification
- Closer linking of porosity data with fatigue, HIP, and machining outcomes
This shift reflects a broader engineering reality.
Dense-looking parts are not always durable parts.
The 3d printing titanium porosity test must sit beside process capability evidence, not replace it.
Business value of reading porosity data correctly
Correct interpretation protects engineering schedules, qualification budgets, and field reliability.
Misreading the 3d printing titanium porosity test can create two opposite costs.
One is rejecting acceptable parts and increasing scrap.
The other is approving risky parts and transferring failure downstream.
Where better interpretation creates value
- Faster supplier qualification with fewer repeated test loops
- More realistic comparisons between machines, powders, and build strategies
- Improved alignment between quality data and end-use loading conditions
- Lower risk of expensive rework after machining or HIP
- Stronger traceability for audit and certification review
For data-driven organizations, porosity data becomes valuable only when tied to decisions.
That means linking the 3d printing titanium porosity test to geometry, load path, and service environment.
Typical scenarios where interpretation changes outcomes
Not all titanium parts should be judged by the same porosity logic.
Criticality depends on stress, wall thickness, machining allowance, and inspection accessibility.
Representative scenarios
These examples show why one reported 3d printing titanium porosity test result cannot be interpreted in isolation.
Practical guidance for evaluating test credibility
A stronger review process asks how the data was produced before asking whether the number looks acceptable.
Checklist for technical review
- Confirm whether the 3d printing titanium porosity test used coupons, full parts, or both.
- Check CT voxel size and determine the smallest detectable pore.
- Review segmentation thresholds and image reconstruction settings.
- Separate total porosity from maximum pore size and clustering behavior.
- Map defects against high-stress regions, not only total volume.
- Compare test data with powder quality, oxygen levels, and machine logs.
- Verify whether HIP or heat treatment occurred before final inspection.
- Link porosity findings with tensile, fatigue, and fracture data.
This approach turns the 3d printing titanium porosity test from a marketing number into an engineering metric.
A more reliable path forward
The safest path is multi-layer validation.
No single 3d printing titanium porosity test should carry full approval weight for demanding applications.
Reliable decisions come from combining internal defect data with process records, post-processing status, and mechanical performance evidence.
This is especially important when titanium parts move from prototype success to serial production control.
If the goal is engineering truth, then porosity results must be traceable, comparable, and tied to actual service risk.
Use the 3d printing titanium porosity test as a critical signal, but never as a standalone conclusion.
The next practical step is to define a review framework that standardizes sampling, CT resolution, thresholds, and acceptance logic across every titanium build program.
Search News
Hot Articles
- Carbon Fiber StructuresHow to Specify Aerospace Carbon Fiber Assemblies for Lightweight, Load-Bearing PartsJul 11, 2026
- Machine VisionXiaomi, Alibaba DAMO Academy Drive Open-Source Robotics Model Ecosystem, Lowering Algorithm Development Barriers for Overseas SMEs Adopting Chinese Robotics SolutionsMar 30, 2026
- Cobots & ArmsShanxi 'AI+' Conference Showcases Embodied Intelligence with Multinational Buyer Engagement: Key Industry ImplicationsMar 30, 2026
Popular Tags
Recommended News
 Jul 11, 2026How to Specify Aerospace Carbon Fiber Assemblies for Lightweight, Load-Bearing PartsAerospace carbon fiber assemblies: learn how to specify laminate design, load data, joining methods, and inspection controls for lighter, reliable load-bearing aerospace parts.Elena Rostova (UAV Systems Researcher)
 Mar 30, 2026Xiaomi, Alibaba DAMO Academy Drive Open-Source Robotics Model Ecosystem, Lowering Algorithm Development Barriers for Overseas SMEs Adopting Chinese Robotics SolutionsXiaomi & Alibaba DAMO Academy's open-source robotics models lower algorithm barriers for global SMEs. Boost efficiency in manufacturing, logistics & smart retail with ROS 2 compatible solutions.TSV Data Lab
 Mar 30, 2026Shanxi 'AI+' Conference Showcases Embodied Intelligence with Multinational Buyer Engagement: Key Industry ImplicationsShanxi 'AI+' Conference highlights embodied intelligence with Tesla, Ubtech & Jiantao showcasing multimodal robotics. 40+ global buyers validated tech on-site, creating new B2B channels for industrial automation & AI solutions.Chen Wei (Automation Lead Engineer)
 Mar 30, 2026Zhongguancun Unveils 6G Integrated Sensing-Computing-Intelligence Platform to Empower Embodied Robots for Global Industrial ApplicationsZhongguancun's new 6G platform revolutionizes industrial robotics with <10ms latency, empowering global automotive, logistics & port automation. Discover how this tech boosts China's smart manufacturing exports.TSV Data Lab
 Mar 30, 2026Mech-Mind Tianjin Embodied Intelligence R&D and Production Base Goes Live, Cutting Delivery Time by 20%–30% for Global Customized AMR+Vision SolutionsMech-Mind's Tianjin AMR+Vision production base cuts delivery time by 20%-30% for欧美 & Latin American markets. Discover how this PLd-certified facility accelerates customized robotics solutions for smart manufacturing and logistics.Chen Wei (Automation Lead Engineer)
 Mar 30, 2026Boao Forum Reveals 'Co-evolution of Big and Small Brains' Trend in Humanoid Robots, China's Embodied Intelligence Accelerates Adaptation to Overseas Manufacturing Service ScenariosDiscover how China's humanoid robots, featuring 'Co-evolution of Big and Small Brains,' are revolutionizing global manufacturing. Learn about Embodied Tian Gong 3.0's ISO compliance and overseas deployment at Boao Forum 2026.Chen Wei (Automation Lead Engineer)
 Mar 30, 2026China Railway Industrial Secures Patent for Embodied Robotics in Material Handling, Boosting High-Precision Delivery Capabilities for Overseas Infrastructure and Manufacturing ProjectsChina Railway Industrial's new patent for embodied robotics in material handling boosts high-precision delivery for global infrastructure & manufacturing. Discover how this innovation enhances logistics accuracy in automotive, rail transit & EPC projects.Chen Wei (Automation Lead Engineer)
 Sep 29, 2026ISO 9283 Repeatability: How to Evaluate Cobot Positioning PerformanceISO 9283 cobot repeatability explained: learn how payload, reach, approach direction, and test conditions affect positioning performance and cell capability.Chen Wei (Automation Lead Engineer)
 Sep 28, 2026Spindle Runout Measurement in Germany: DIN Standards, Methods, and Acceptance LimitsSpindle runout measurement Germany: explore DIN standards, proven methods, acceptance limits, and audit-ready practices for reliable machining quality.Dr. Marcus Vance
 Sep 27, 2026How to Select Wall-Mount Edge Devices for Space-Constrained Factory NetworksWall mount edge devices for space-constrained factories: evaluate workload, thermal design, power resilience, cable access, and network reliability for smarter deployments.TSV Data Lab
 Sep 26, 2026Machining Tolerance Analysis: How to Set Limits That Meet Function and Cost TargetsMachining tolerance analysis: learn how to set functional limits, control tolerance stacks, reduce inspection risk, and balance precision with production cost.Dr. Marcus Vance
 Sep 25, 2026How to Evaluate an Industrial Infrastructure Data Platform for Multi-Site OperationsIndustrial infrastructure data platform evaluation guide for multi-site operations: compare data quality, edge resilience, interoperability, governance, and scalable proof-of-value criteria.Victor Lin (Chief Software Architect)
 Sep 24, 2026How to Select Machine Vision Optics for Accurate Inspection at Different Working DistancesMachine vision optics selection guide for accurate inspection at every working distance. Compare FOV, pixel scale, DOF, distortion, lighting, and telecentric options.TSV Data Lab
 Sep 23, 2026How to Evaluate a Machine Vision System Integrator for High-Speed Inspection LinesChoose a machine vision system integrator with proven expertise in high-speed inspection, reliable reject timing, robust optics, and measurable acceptance criteria.TSV Data Lab
 Sep 28, 2026When is a SCADA API the right choice for connecting plant systems?SCADA API guide: learn when governed plant data integration improves traceability, security, and scalability—without compromising real-time control.Victor Lin (Chief Software Architect)
 Sep 27, 2026How SCADA data integration improves traceability across production linesSCADA data integration connects production-line data to improve traceability, accelerate quality investigations, and strengthen safety decisions.Victor Lin (Chief Software Architect)
 Sep 26, 2026What to define before starting SCADA integration planningSCADA integration planning starts with clear scope, control boundaries, data models, cybersecurity, and testing. Discover the definitions that reduce risk and costly rework.Victor Lin (Chief Software Architect)
 Sep 25, 2026How a smart factory with Industrial IoT reduces production blind spotsDiscover how a smart factory with Industrial IoT turns real-time machine, quality, and workflow data into actionable insights that reduce production blind spots and delivery risks.Victor Lin (Chief Software Architect)
 Sep 24, 2026When does Industrial IoT make smart manufacturing easier to scale?Smart manufacturing Industrial IoT scales when trusted data, interoperable systems, and secure workflows turn connected assets into measurable gains.TSV Data Lab
 Sep 23, 2026What drives ultra-precision machining cost at 1-micron tolerance?Ultra precision machining cost per part at 1 micron tolerance depends on process, material, metrology, and yield. Learn how to compare quotes confidently.Dr. Marcus Vance
 Sep 22, 2026Drone Engine-T550CC Applications: Build the UAV Power System Around the MissionAn application guide for Drone Engine-T550CC integration, covering payload planning, airframe matching, cooling, fuel, vibration, test procedures, documentation, and service preparation.Elena Rostova (UAV Systems Researcher)
 Sep 22, 2026How to Evaluate Industrial Edge Computing Vendors for Factory DeploymentIndustrial edge computing vendor evaluation guide for factories: compare latency, protocol fit, reliability, security, and lifecycle support before deployment.TSV Data Lab
 Sep 21, 2026Drone Payload Integration: Matching Power, Data, and Center of Gravity for Reliable FlightsDrone payload integration made practical: balance power, data, center of gravity, and endurance to build safer, more reliable mission-ready flights.Elena Rostova (UAV Systems Researcher)
 Sep 20, 2026Autonomous Navigation Pricing: Cost Drivers and Budget Benchmarks for AMR ProjectsAutonomous navigation price explained: compare AMR cost drivers, software, sensors, integration, safety, and lifecycle budgets to build a scalable project plan.Chen Wei (Automation Lead Engineer)