CODESYS runtime latency test and scan jitter surprises
Publication Date
author
In hard-tech automation, small timing deviations can trigger costly instability. This article explores a real CODESYS runtime latency test, unexpected scan jitter behavior, and what those results mean for engineers evaluating real time operating system RTOS benchmark data, OPC UA server response time, EtherCAT cycle time benchmark, and PLC vs PAC performance comparison in demanding industrial control environments.
For R&D engineers, machine builders, plant operators, procurement teams, and technical decision-makers, the challenge is rarely the headline cycle time printed on a vendor brochure. The real question is how a controller behaves after 8 hours, 24 hours, or 30 days of mixed communication, fieldbus traffic, HMI updates, logging, and interrupt load.
That is where latency and scan jitter become commercially important. A nominal 1 ms task that occasionally slips to 3 ms may still look acceptable in a demo, but in synchronized motion, deterministic I/O, or closed-loop edge control, that deviation can be the difference between stable throughput and recurring troubleshooting costs.
At TechStat Vanguard, the focus is not on marketing adjectives but on measurable engineering behavior. The purpose of this analysis is to explain what runtime latency actually reveals, why scan jitter often surprises teams evaluating CODESYS platforms, and how to interpret benchmark data before choosing hardware, RTOS architecture, or a PLC vs PAC control strategy.
Why CODESYS runtime latency matters beyond the headline scan time
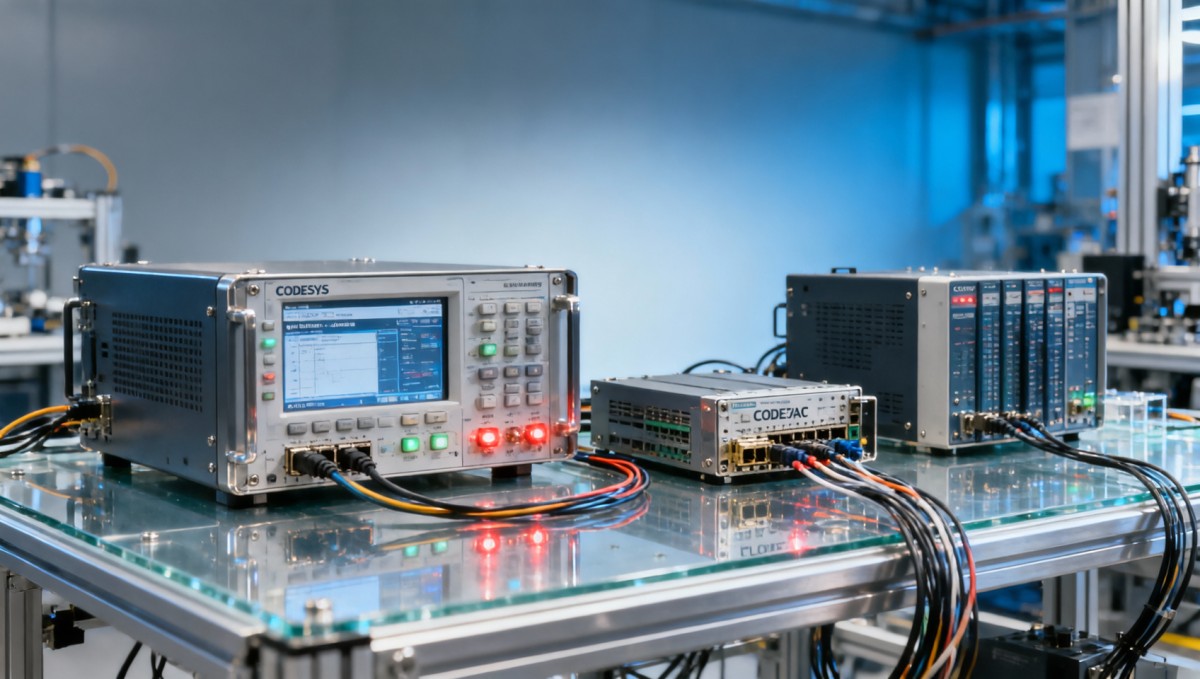
CODESYS is widely used because it offers portability across industrial hardware, standardized IEC 61131-3 development, and practical deployment in embedded control, gateways, soft PLCs, and machine controllers. However, portability does not guarantee deterministic timing. Runtime latency depends on the operating system layer, CPU isolation, interrupt behavior, fieldbus driver quality, and the number of competing software services.
In many projects, engineers begin by testing a cyclic task at 1 ms, 2 ms, or 4 ms. The initial result may appear stable for 10 to 15 minutes. Problems often surface only after OPC UA polling, historian writes, HMI rendering, and EtherCAT traffic are added together. That is why a proper latency test must simulate realistic industrial load rather than a single idle loop.
Scan jitter is the variation around the expected execution interval. If a task is configured for 1.000 ms but actually arrives at 0.98 ms, 1.04 ms, 1.30 ms, and occasionally 2.10 ms, the average may still look reasonable while the worst-case behavior becomes unacceptable. For procurement teams, this distinction is critical because average values rarely capture downtime risk.
What engineers should measure in a latency test
A meaningful benchmark should capture at least 5 timing dimensions: configured task interval, average execution time, average latency, peak latency, and jitter spread over a fixed duration such as 2 hours, 8 hours, or 24 hours. Without a long enough sample window, rare spikes caused by driver contention or network interrupts may never be observed.
- Configured cycle time, such as 1 ms, 2 ms, 5 ms, or 10 ms
- Average task latency over a sustained run, ideally above 2 hours
- Peak or worst-case latency, not just mean value
- Jitter distribution under idle and loaded states
- Communication impact from OPC UA, fieldbus, logging, and HMI traffic
The table below separates metrics that are often confused during vendor evaluation. This matters because two systems can both claim a 1 ms cycle, yet one may be suitable for deterministic machine control while the other is only acceptable for general automation sequencing.
The practical takeaway is simple: a clean average does not prove real-time reliability. Teams comparing CODESYS targets should request test logs that show percentile behavior and worst-case events, especially if the intended deployment includes EtherCAT synchronization, edge analytics, or OPC UA data exposure at the same time.
What the latency test revealed and why the jitter was surprising
In a representative test scenario, a CODESYS runtime was configured with a 1 ms cyclic task and monitored across multiple operating conditions: idle state, active OPC UA reads, HMI refresh, event logging, and EtherCAT process data exchange. During the first phase, average latency remained low, typically below 100 µs. The surprise appeared when mixed workload was introduced.
Under moderate communication load, the average value still looked acceptable, but jitter widened sharply. Instead of staying within a narrow band such as ±25 µs to ±50 µs, the task occasionally drifted into several hundred microseconds, with rare spikes above 1 ms. For general sequencing this may be tolerable, but for tightly synchronized control it changes the risk profile immediately.
This is the kind of result that surprises teams who only inspect “typical” scan time. A machine can pass a factory demo while still carrying a hidden timing weakness. Once deployed in the field, the added noise of production networks, larger tag sets, or more frequent OPC UA subscriptions can expose that weakness in a way that is expensive to diagnose.
Common sources of unexpected scan jitter
Unexpected jitter rarely comes from one cause alone. In most embedded or industrial PC deployments, it is the combined effect of scheduler behavior, driver stack overhead, and communication bursts. Even with a capable multicore CPU, poor core affinity or non-deterministic background services can disrupt timing.
Typical contributors engineers should
Search News
Hot Articles
- Carbon Fiber StructuresHow to Specify Aerospace Carbon Fiber Assemblies for Lightweight, Load-Bearing PartsJul 11, 2026
- Machine VisionXiaomi, Alibaba DAMO Academy Drive Open-Source Robotics Model Ecosystem, Lowering Algorithm Development Barriers for Overseas SMEs Adopting Chinese Robotics SolutionsMar 30, 2026
- Cobots & ArmsShanxi 'AI+' Conference Showcases Embodied Intelligence with Multinational Buyer Engagement: Key Industry ImplicationsMar 30, 2026
Popular Tags
Recommended News
 Jul 11, 2026How to Specify Aerospace Carbon Fiber Assemblies for Lightweight, Load-Bearing PartsAerospace carbon fiber assemblies: learn how to specify laminate design, load data, joining methods, and inspection controls for lighter, reliable load-bearing aerospace parts.Elena Rostova (UAV Systems Researcher)
 Mar 30, 2026Xiaomi, Alibaba DAMO Academy Drive Open-Source Robotics Model Ecosystem, Lowering Algorithm Development Barriers for Overseas SMEs Adopting Chinese Robotics SolutionsXiaomi & Alibaba DAMO Academy's open-source robotics models lower algorithm barriers for global SMEs. Boost efficiency in manufacturing, logistics & smart retail with ROS 2 compatible solutions.TSV Data Lab
 Mar 30, 2026Shanxi 'AI+' Conference Showcases Embodied Intelligence with Multinational Buyer Engagement: Key Industry ImplicationsShanxi 'AI+' Conference highlights embodied intelligence with Tesla, Ubtech & Jiantao showcasing multimodal robotics. 40+ global buyers validated tech on-site, creating new B2B channels for industrial automation & AI solutions.Chen Wei (Automation Lead Engineer)
 Mar 30, 2026Zhongguancun Unveils 6G Integrated Sensing-Computing-Intelligence Platform to Empower Embodied Robots for Global Industrial ApplicationsZhongguancun's new 6G platform revolutionizes industrial robotics with <10ms latency, empowering global automotive, logistics & port automation. Discover how this tech boosts China's smart manufacturing exports.TSV Data Lab
 Mar 30, 2026Mech-Mind Tianjin Embodied Intelligence R&D and Production Base Goes Live, Cutting Delivery Time by 20%–30% for Global Customized AMR+Vision SolutionsMech-Mind's Tianjin AMR+Vision production base cuts delivery time by 20%-30% for欧美 & Latin American markets. Discover how this PLd-certified facility accelerates customized robotics solutions for smart manufacturing and logistics.Chen Wei (Automation Lead Engineer)
 Mar 30, 2026Boao Forum Reveals 'Co-evolution of Big and Small Brains' Trend in Humanoid Robots, China's Embodied Intelligence Accelerates Adaptation to Overseas Manufacturing Service ScenariosDiscover how China's humanoid robots, featuring 'Co-evolution of Big and Small Brains,' are revolutionizing global manufacturing. Learn about Embodied Tian Gong 3.0's ISO compliance and overseas deployment at Boao Forum 2026.Chen Wei (Automation Lead Engineer)
 Mar 30, 2026China Railway Industrial Secures Patent for Embodied Robotics in Material Handling, Boosting High-Precision Delivery Capabilities for Overseas Infrastructure and Manufacturing ProjectsChina Railway Industrial's new patent for embodied robotics in material handling boosts high-precision delivery for global infrastructure & manufacturing. Discover how this innovation enhances logistics accuracy in automotive, rail transit & EPC projects.Chen Wei (Automation Lead Engineer)
 Oct 16, 2026Choosing a Rugged Edge AI Box Supplier: Thermal Tests and Lifecycle SupportChoose a rugged edge AI box supplier with proven thermal performance and reliable lifecycle support. Discover the tests and commitments to verify before you buy.TSV Data Lab
 Oct 15, 2026R&D Cost Reduction Services: How to Evaluate Fees, Savings, and ROIEvaluate R&D cost reduction services with confidence. Compare fees, verify savings, and calculate ROI without compromising performance. Discover how to choose a provider that delivers real value.Chen Wei (Automation Lead Engineer)
 Oct 15, 2026How Should You Compare TechStat Vanguard 5-Axis CNC Tolerances?TechStat Vanguard 5-axis CNC tolerance comparison: learn how to verify part accuracy, assess inspection evidence, and choose suppliers that reliably meet your drawing requirements.Dr. Marcus Vance
 Oct 14, 2026Drone Frame Composites: Carbon Fiber vs. Fiberglass for Weight and StiffnessExplore drone structural materials composites: compare carbon fiber and fiberglass for weight, stiffness, cost, and antenna compatibility. Find the right material for your drone frame.Elena Rostova (UAV Systems Researcher)
 Oct 13, 2026Smart Cameras vs. PC-Based Machine Vision: Which Fits High-Speed Inspection?This industrial product comparison for machine vision weighs smart cameras vs. PC-based systems on latency, throughput, and cost. Discover your best fit for high-speed inspection.TSV Data Lab
 Oct 12, 2026How to Verify RoHS Compliance in Industrial Sensing Systems Before DeploymentRoHS compliant sensing systems: learn how to verify materials, supplier declarations, testing, and configuration controls before industrial deployment.TSV Data Lab
 Oct 11, 2026How Procurement-Oriented Content Taxonomy Improves B2B Buying JourneysProcurement-oriented content taxonomy streamlines B2B buying journeys with clearer evidence, supplier comparisons, risk visibility, and faster approvals.TSV Data Lab
 Oct 10, 2026How to Select a Machine Performance Monitoring Platform for OEE and Downtime ReductionMachine performance monitoring platform selection guide: validate machine states, OEE data, downtime reasons, integrations, and scalability to reduce losses with confidence.TSV Data Lab
 Oct 08, 2026How to Machine Inconel 625 Blades Without Heat Cracks or Edge ChippingInconel 625 blade machining guide: prevent heat cracks, edge chipping, chatter, and work hardening with proven tooling, cooling, fixturing, and inspection strategies.Dr. Marcus Vance
 Oct 07, 2026How to Evaluate an HMI Panel Distributor for Industrial Automation ProjectsHMI panel distributor evaluation guide: verify technical compatibility, traceability, supply reliability, lifecycle support, and total cost for automation projects.Victor Lin (Chief Software Architect)
 Oct 06, 2026Navigation Fault Tolerance Standards for AMRs: What Safety Teams Must VerifyNavigation fault tolerance standards: learn what AMR safety teams must verify, from localization loss and sensor faults to stopping distance, safe restart, and site-specific validation.Chen Wei (Automation Lead Engineer)
 Oct 05, 2026Calculating Edge Computing Total Cost of Ownership Across Distributed SitesEdge computing ownership cost explained: calculate deployment, energy, connectivity, security, remote support, and refresh costs across distributed sites.TSV Data Lab
 Oct 04, 2026CAD/CAM Benchmarking in the GCC: What Manufacturers Should Ask a ConsultantCAD CAM benchmark consultant GCC guide: learn the key questions manufacturers should ask to validate post-processors, workflows, machine performance, and production risk.Victor Lin (Chief Software Architect)
 Oct 03, 2026Selecting Automotive Radar Sensor Modules for ADAS Range, Resolution, and IntegrationAutomotive radar sensor module selection guide for ADAS: compare range, resolution, field of view, latency, and integration to build safer, reliable vehicle systems.TSV Data Lab
 Oct 02, 2026How to Qualify Machined Parts Suppliers for Hard Tech ProgramsHard tech supply chain machined parts demand rigorous supplier qualification. Learn how to assess capability, traceability, quality controls, and delivery resilience.Dr. Marcus Vance
 Oct 01, 2026How to Select an Outdoor Security Radar Sensor for Perimeter Detection?Outdoor security radar sensor selection guide: compare range, accuracy, false-alarm control, integration, and field testing for reliable perimeter detection.TSV Data Lab
 Sep 30, 2026How to Evaluate Solid-State LiDAR Hardware for Outdoor Autonomous VehiclesSolid state LiDAR hardware evaluation guide for outdoor autonomous vehicles—compare range, point-cloud quality, environmental resilience, integration, and safety.TSV Data Lab