What matters most in VTOL pipeline inspection range
Publication Date
author
When evaluating a vtol drone for pipeline inspection, range is only one part of the engineering picture. Operators and buyers also need to compare endurance against tethered uav continuous flight time, assess sensor value through drone thermal camera resolution comparison, and understand how vtol transition phase aerodynamics affects stability, coverage, and data reliability in real inspection missions.
For research teams, field operators, procurement managers, and enterprise decision-makers, the central question is not simply how far a platform can fly on a brochure figure. The real question is how much useful inspection work a VTOL system can deliver per sortie, per shift, and per kilometer of pipeline under actual wind, payload, and communication constraints.
In long linear assets such as oil, gas, water, and chemical pipelines, range matters because the inspection corridor may extend 20 km, 50 km, or more between launch and recovery options. Yet practical mission value depends on endurance, cruise efficiency, transition stability, sensor power draw, data-link reliability, and the ability to maintain safe stand-off distances while still capturing actionable imagery.
This article examines what matters most in VTOL pipeline inspection range from an engineering and procurement perspective. It focuses on measurable factors, common trade-offs, and selection criteria that help reduce trial-and-error during platform comparison, specification drafting, and purchase evaluation.
Why range alone does not define inspection performance
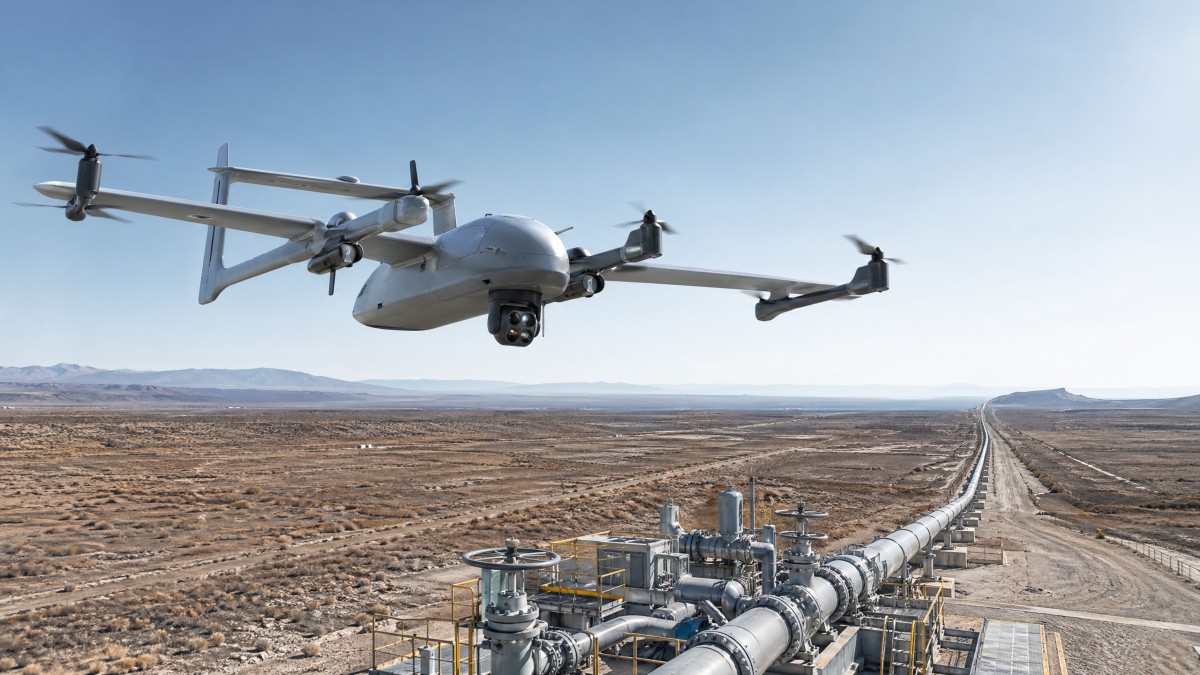
A published range figure often reflects ideal conditions: low wind, moderate temperature, new batteries, optimized cruise altitude, and limited payload weight. In pipeline inspection, those assumptions rarely hold. Operators may fly with EO sensors, thermal cameras, RTK modules, and redundant communication equipment, adding 0.8 kg to 2.5 kg compared with a minimal demonstration payload.
Range must therefore be interpreted together with endurance and inspection speed. A drone advertised with a 100 km ferry range may deliver only 45 km to 70 km of effective inspection range once it must loiter at valves, compressor stations, river crossings, or suspected leak points. If the mission profile includes 10 to 15 minutes of repeated hover checks, the usable corridor length can fall sharply.
Another overlooked factor is reserve policy. Many industrial operators do not plan to land at 0% battery. A conservative energy reserve of 20% to 30% is common for BVLOS-adjacent planning or complex terrain missions. That reserve protects against headwinds, route deviation, or aborted landing attempts, but it also reduces the true operational range available for data collection.
For procurement teams, the key metric is not maximum brochure distance but mission-effective coverage per battery cycle. That number should be calculated from four inputs: cruise speed, payload power draw, average hover time, and energy reserve threshold. Without those details, comparing one VTOL platform to another is often misleading.
Mission-effective range versus advertised range
The table below shows how the same VTOL platform can deliver very different outcomes depending on payload and mission behavior. These are typical engineering comparison ranges rather than brand-specific claims, and they illustrate why pipeline buyers should ask for scenario-based performance data.
The practical lesson is clear: range should be normalized around the task, not the airframe alone. A field team that only checks the farthest possible distance may end up with a platform that underperforms when the mission requires thermal imaging, repeat passes, or detailed anomaly verification.
Four questions buyers should ask suppliers
- What is the flight time at 50%, 75%, and 100% of rated payload?
- How much range remains when a 20% to 25% battery reserve is enforced?
- What cruise speed is assumed in the published range number: 14 m/s, 18 m/s, or higher?
- How does performance change with 5 m/s, 8 m/s, and 12 m/s headwind conditions?
Endurance, tethered alternatives, and corridor economics
VTOL pipeline inspection range must also be evaluated against endurance strategy. In some use cases, a long-range untethered platform is the right choice. In others, a tethered UAV with continuous flight time provides better economics for static monitoring, confined station inspection, or persistent overwatch above a high-risk point such as a pump station or suspected leak zone.
The trade-off is simple. A tethered UAV can remain aloft for 4 hours, 8 hours, or longer because power is supplied from the ground, but its mobility is limited by cable length and deployment footprint. A VTOL platform can inspect long corridors and bypass ground obstacles, but it is constrained by battery energy density and payload power consumption.
For operators running daily inspection routes, the cost per inspected kilometer often matters more than raw endurance. If a VTOL can cover 35 km in one sortie and complete 3 sorties per day, it may outperform a tethered system for linear surveying. If the mission is to watch a fixed 300 m to 800 m zone for 6 continuous hours, the tethered option may deliver better persistence and lower battery logistics.
Decision-makers should therefore map endurance to mission geometry. Linear assets favor mobility and efficient forward flight. Point assets favor persistence. Confusing these two profiles leads to unnecessary over-specification, higher training load, and avoidable capital cost.
VTOL and tethered UAV comparison for pipeline tasks
The table below highlights where each architecture fits best in common pipeline operations.
The comparison shows that “better endurance” depends on the inspection shape. In B2B evaluation, procurement teams should ask whether the mission is corridor-centric, node-centric, or mixed. That answer influences not only aircraft choice but staffing, battery inventory, generator needs, and maintenance planning.
A practical selection sequence
- Define the asset geometry: fixed site, 5–15 km section, or 20+ km corridor.
- Define persistence needs: under 60 minutes, 1–3 hours, or multi-hour stationary watch.
- Define sensor package mass and power load, especially if thermal and zoom payloads are combined.
- Estimate shift throughput in inspected kilometers per day, not just flight time per battery.
Sensor payloads, thermal resolution, and their effect on real range
One of the most common pipeline procurement mistakes is treating sensor quality as separate from range. In reality, payload configuration directly changes endurance, cruise efficiency, and even inspection speed. A heavier gimbal, additional cooling, and higher onboard processing demand can reduce flight time by 10% to 25% depending on airframe design and power architecture.
Thermal performance is especially important because many pipeline inspection tasks involve heat anomaly detection, insulation failure checks, flare monitoring, or leak indication near above-ground components. A basic thermal core may be sufficient for broad hotspot awareness, but identifying subtle temperature contrast at greater stand-off distances often requires higher resolution and better lens pairing.
For example, a drone thermal camera resolution comparison between 320×256 and 640×512 sensors is not just a spec-sheet exercise. The higher resolution option can improve target discrimination, reduce the need for close-in hover confirmation, and support more reliable post-flight analysis. However, it may also increase payload cost, storage demand, and in some cases total payload mass.
Operators should assess payloads in terms of inspection outcome per flight. If better thermal resolution cuts repeat passes from 3 to 1 on a 25 km route, the net operational efficiency may improve even if the battery drains slightly faster. That is why mission design and sensor design must be evaluated together.
Typical payload trade-offs for pipeline inspection
The table below summarizes how common sensor decisions influence both data quality and effective VTOL pipeline inspection range.
The main takeaway is that better sensors can either reduce or increase mission efficiency depending on how they are integrated. Procurement teams should ask for payload-specific flight data, not airframe-only endurance figures. A 15% loss in nominal flight time may still produce a 20% gain in completed inspection output if data quality eliminates rework.
Recommended payload review checklist
- Check total payload mass in kilograms, not only sensor model names.
- Review power consumption in hover and cruise modes separately.
- Confirm whether thermal data is radiometric or image-only, if analysis depth matters.
- Evaluate whether higher resolution reduces repeat inspection rates across a 1-week or 1-month operating cycle.
Transition aerodynamics, wind tolerance, and data reliability
VTOL transition phase aerodynamics are often under-discussed in buying conversations, yet they can be decisive in pipeline inspection. A platform may have good forward-flight efficiency but weak stability during transition from vertical lift to wing-borne cruise, or during the reverse transition before landing. If those phases are unstable, the aircraft may consume more energy, lose positional accuracy, or deliver blurred imagery near critical observation points.
This matters because pipeline missions rarely occur in laboratory air. Wind shear near ridges, thermal uplift over heated surfaces, and crosswinds in open corridors can disrupt transition behavior. Even if cruise endurance remains acceptable, repeated correction inputs and unstable attitude can degrade mapping overlap, thermal consistency, and zoom image clarity. That creates a direct link between aerodynamics and data quality.
For field users, the best indicator is not a vague “wind resistant” claim but a documented operating envelope. Typical industrial comparisons should include safe launch and recovery wind ranges, such as 8–10 m/s for conservative operation and perhaps 12 m/s in experienced conditions, plus the effect of gust spread on transition smoothness. These figures help crews understand whether a platform can maintain inspection productivity across seasons.
For engineering buyers, transition performance should be linked to the mission profile. If the route involves frequent short hover checks and multiple altitude changes, the aircraft will spend more time in energy-intensive and control-sensitive states. In such cases, a platform with slightly shorter headline range but cleaner transitions can be the better investment because it protects both data integrity and operational safety.
What to validate during technical evaluation
A robust evaluation should include controlled test scenarios rather than static specification review. Teams should compare the following variables in at least 3 repeated flights per scenario to identify consistency rather than one-time best-case results.
- Transition altitude loss or overshoot during outbound and inbound mode changes.
- Attitude stability with the actual inspection payload, not a dummy payload.
- Image blur rate or unusable frame percentage during wind gusts above 8 m/s.
- Energy consumption delta between steady corridor cruise and stop-check-stop missions.
These checks matter because pipeline inspection is a data business, not just a flight business. If 12% of thermal frames become unusable in transition-heavy missions, the nominal flight range becomes less relevant. Reflight cost, analyst time, and delayed maintenance response will usually outweigh the benefit of an extra few kilometers on paper.
Common transition-related procurement risks
Buyers should watch for three recurring issues. First, some demonstrations are performed with light payloads and minimal wind, which masks transition instability. Second, transition quality may degrade as batteries age past 150 to 250 cycles. Third, software tuning that works at sea level may not behave the same way at high-temperature or high-altitude sites. A serious evaluation process should include acceptance criteria for these conditions.
How to specify and buy a VTOL platform for pipeline inspection
A good procurement process converts operational needs into measurable specification items. Instead of asking for the “longest range VTOL drone,” buyers should define corridor length, sensor package, weather envelope, launch constraints, reserve policy, and required data outputs. This reduces ambiguity and gives suppliers a clear basis for technical response.
In many organizations, operations teams focus on usability, engineering teams focus on payload and reliability, and management focuses on total cost of ownership. A balanced purchase decision should combine all three. For example, a system with a 2-hour training reduction per operator and 15% fewer repeat missions may deliver stronger long-term value than a platform with slightly lower acquisition cost but more field friction.
It is also useful to separate mandatory requirements from optimization targets. Mandatory items may include minimum effective corridor coverage of 30 km per sortie, dual EO-thermal payload support, and wind operation up to 10 m/s. Optimization targets may include lower battery swap time, faster mission planning, or improved thermal stand-off distance. This structure helps prevent procurement drift.
For enterprise decision-makers, the strongest approach is a staged evaluation: desk review, supplier clarification, witnessed field test, and pilot deployment. Across a 2–6 week assessment cycle, this sequence usually reveals whether the platform can sustain real pipeline inspection work rather than isolated demo performance.
Suggested procurement criteria matrix
The following matrix can be adapted into an internal scorecard for vendor comparison.
A matrix like this keeps the evaluation grounded in engineering truth rather than brochure adjectives. It also helps cross-functional teams align around comparable evidence, which is essential when field users, procurement, and executives are prioritizing different outcomes.
FAQ for technical buyers
How much effective range is usually enough for pipeline inspection?
For many industrial patrol tasks, 20 km to 40 km of mission-effective corridor coverage per sortie is already useful, especially when launch sites are distributed. The right figure depends on terrain access, inspection density, and whether the route requires detailed station checks or mainly continuous corridor observation.
Should buyers prioritize thermal resolution or flight time?
If defect confirmation is difficult and repeat flights are frequent, better thermal capability may create more value than a modest increase in endurance. If the route is long, targets are large, and thermal use is secondary, longer flight time may deserve more weight. The best choice depends on whether rework cost or corridor distance is the larger constraint.
How long does a realistic evaluation cycle take?
A practical B2B evaluation often takes 2 to 6 weeks. That usually includes requirement definition, supplier Q&A, one or more field tests, and internal scoring. Shorter cycles can work for straightforward replacements, but new mission types usually require broader validation.
What matters most in VTOL pipeline inspection range is not the largest number on a product sheet but the amount of reliable, decision-grade inspection data a platform can deliver under real mission conditions. Effective range is shaped by payload mass, thermal camera selection, reserve policy, hover demand, and transition stability just as much as by battery capacity or wing efficiency.
For information researchers, operators, procurement teams, and enterprise leaders, the smartest path is to evaluate VTOL systems as complete inspection tools: airframe, sensor stack, endurance profile, wind envelope, and support model. That approach reduces supplier qualification risk and creates a stronger basis for long-term asset monitoring performance.
If you are comparing VTOL platforms for pipeline inspection, need a more rigorous supplier benchmark, or want help converting mission goals into measurable specification items, now is the right time to move from marketing claims to engineering-based evaluation. Contact us to discuss your use case, request a tailored assessment framework, or explore more hard-tech inspection solutions built around measurable performance.
Search News
Hot Articles
- Carbon Fiber StructuresHow to Specify Aerospace Carbon Fiber Assemblies for Lightweight, Load-Bearing PartsJul 11, 2026
- Machine VisionXiaomi, Alibaba DAMO Academy Drive Open-Source Robotics Model Ecosystem, Lowering Algorithm Development Barriers for Overseas SMEs Adopting Chinese Robotics SolutionsMar 30, 2026
- Cobots & ArmsShanxi 'AI+' Conference Showcases Embodied Intelligence with Multinational Buyer Engagement: Key Industry ImplicationsMar 30, 2026
Popular Tags
Recommended News
 Jul 11, 2026How to Specify Aerospace Carbon Fiber Assemblies for Lightweight, Load-Bearing PartsAerospace carbon fiber assemblies: learn how to specify laminate design, load data, joining methods, and inspection controls for lighter, reliable load-bearing aerospace parts.Elena Rostova (UAV Systems Researcher)
 Mar 30, 2026Xiaomi, Alibaba DAMO Academy Drive Open-Source Robotics Model Ecosystem, Lowering Algorithm Development Barriers for Overseas SMEs Adopting Chinese Robotics SolutionsXiaomi & Alibaba DAMO Academy's open-source robotics models lower algorithm barriers for global SMEs. Boost efficiency in manufacturing, logistics & smart retail with ROS 2 compatible solutions.TSV Data Lab
 Mar 30, 2026Shanxi 'AI+' Conference Showcases Embodied Intelligence with Multinational Buyer Engagement: Key Industry ImplicationsShanxi 'AI+' Conference highlights embodied intelligence with Tesla, Ubtech & Jiantao showcasing multimodal robotics. 40+ global buyers validated tech on-site, creating new B2B channels for industrial automation & AI solutions.Chen Wei (Automation Lead Engineer)
 Mar 30, 2026Zhongguancun Unveils 6G Integrated Sensing-Computing-Intelligence Platform to Empower Embodied Robots for Global Industrial ApplicationsZhongguancun's new 6G platform revolutionizes industrial robotics with <10ms latency, empowering global automotive, logistics & port automation. Discover how this tech boosts China's smart manufacturing exports.TSV Data Lab
 Mar 30, 2026Mech-Mind Tianjin Embodied Intelligence R&D and Production Base Goes Live, Cutting Delivery Time by 20%–30% for Global Customized AMR+Vision SolutionsMech-Mind's Tianjin AMR+Vision production base cuts delivery time by 20%-30% for欧美 & Latin American markets. Discover how this PLd-certified facility accelerates customized robotics solutions for smart manufacturing and logistics.Chen Wei (Automation Lead Engineer)
 Mar 30, 2026Boao Forum Reveals 'Co-evolution of Big and Small Brains' Trend in Humanoid Robots, China's Embodied Intelligence Accelerates Adaptation to Overseas Manufacturing Service ScenariosDiscover how China's humanoid robots, featuring 'Co-evolution of Big and Small Brains,' are revolutionizing global manufacturing. Learn about Embodied Tian Gong 3.0's ISO compliance and overseas deployment at Boao Forum 2026.Chen Wei (Automation Lead Engineer)
 Mar 30, 2026China Railway Industrial Secures Patent for Embodied Robotics in Material Handling, Boosting High-Precision Delivery Capabilities for Overseas Infrastructure and Manufacturing ProjectsChina Railway Industrial's new patent for embodied robotics in material handling boosts high-precision delivery for global infrastructure & manufacturing. Discover how this innovation enhances logistics accuracy in automotive, rail transit & EPC projects.Chen Wei (Automation Lead Engineer)
 Oct 26, 2026AMAXiMAL Releases Open-Source TopMod 3D v3 With Claude AIExplore AMAXiMAL’s free, open-source TopMod 3D v3 with Claude AI assistance, topology-based modeling and plywood fabrication tools that connect complex designs to physical builds.Dr. Marcus Vance
 Oct 26, 2026Choosing a SCADA System Integrator Company: PLC Compatibility and Long-Term SupportChoose a scada system integrator company with proven PLC compatibility and reliable long-term support. Discover what to test, compare, and require before investing.Victor Lin (Chief Software Architect)
 Oct 25, 2026Hesai Leads Global ADAS Main Lidar Shipments in Yole’s 2026 ReportHesai led global ADAS main lidar shipments with a 43% share in 2025, according to Yole’s 2026 report. Explore what this ranking reveals about its automotive market position.TSV Data Lab
 Oct 25, 2026Choosing an Aerospace Materials Manufacturer: Quality and Traceability ChecksChoosing an aerospace materials manufacturer? Learn how to verify certifications, test reports, and lot traceability to qualify suppliers confidently and reduce costly sourcing risks.Dr. Marcus Vance
 Oct 24, 2026Guotai Haitong: Global Entry-Level 3D Printer Shipments Rose 39% in Q1 2026Entry-level 3D printer shipments rose 39% in Q1 2026, Guotai Haitong reports. Explore how AI, multicolor printing and print farms are shaping market growth.Dr. Marcus Vance
 Oct 24, 2026Choosing an Industrial Vision Inspection Supplier: Acceptance Tests That MatterChoose an industrial vision inspection supplier with confidence. Discover acceptance tests for defect detection, false rejects, production speed, and reliable part rejection before you buy.TSV Data Lab
 Oct 23, 2026US Navy Raises Gecko Robotics Contract Ceiling to $300M for Robotic Fleet MaintenanceUS Navy raises Gecko Robotics’ contract ceiling to $300M for Pacific Fleet robotic inspections. Explore potential opportunities for maintenance suppliers and key procurement considerations.Chen Wei (Automation Lead Engineer)
 Oct 23, 2026Choosing Industrial Sensing Systems for Global Plants: Protocol CompatibilityCompare industrial sensing systems international buyers can trust. Explore protocol compatibility, reduce integration risks, and select proven configurations for reliable global plant deployments.TSV Data Lab
 Oct 22, 2026KUKA Showcases Physical AI and iiQKA.AI Vision at NVIDIA GTC BerlinExplore KUKA’s Physical AI showcase at NVIDIA GTC Berlin and discover how iiQKA.AI Vision aims to simplify robotic vision integration and improve 2D and 3D scene recognition.TSV Data Lab
 Oct 22, 2026Robotic Machining of Advanced Composites: What Tolerances Are Achievable?Explore advanced materials machining robotics: discover what drives achievable composite tolerances and how to validate accuracy before investing in your next machining system.Dr. Marcus Vance
 Oct 21, 2026China’s Industrial Robot Exports Near RMB 10 Billion in First Nine Months of 2026China’s industrial robot exports neared RMB 10 billion in January–September 2026, with value rising faster than volume. Explore the data and what it could mean for suppliers.Chen Wei (Automation Lead Engineer)
 Oct 21, 2026Low-Latency Industrial Data Processing: Pricing and Key Cost DriversExplore industrial data latency price drivers, from edge hardware to integration and support. Learn how to compare quotes, verify performance, and avoid unnecessary costs.TSV Data Lab
 Oct 20, 2026KUKA Launches iiQKA.AI Vision to Simplify Industrial Image ProcessingKUKA iiQKA.AI Vision simplifies industrial image processing with controller-based 2D and 3D vision. Explore drag-and-drop setup for vision-guided automation.TSV Data Lab
 Oct 20, 2026Smart Industrial Edge Devices: Key Criteria for Legacy PLC IntegrationChoose smart industrial edge devices for legacy PLC integration. Discover key criteria for compatibility, data quality, security, and reliable collection without disrupting control.TSV Data Lab
 Oct 19, 2026Choosing a Radar Sensor by Application: Range, Resolution, and Field of ViewSimplify radar sensor application based product selection. Compare range, resolution, and field of view to avoid blind spots and choose with confidence. Explore the guide.TSV Data Lab
 Oct 18, 2026Comparing Material Options for Procurement: Specs, Costs, and Supply RisksExplore procurement oriented technical content on material options, specs, costs, and supply risks. Compare alternatives to cut hidden expenses and make confident sourcing decisions.Dr. Marcus Vance
 Oct 17, 20265-Axis CNC Positioning Accuracy: How to Interpret ISO 230-2 Test ResultsAssess 5 axis CNC machining positioning accuracy with ISO 230-2. Learn to interpret repeatability, reversal error, and test conditions to compare suppliers and make confident acceptance decisions.Dr. Marcus Vance