Why Throughput Bottlenecks in Industrial IoT Are Often Misdiagnosed
Publication Date
author
Throughput failures in connected factories are rarely caused by bandwidth alone. For project leaders responsible for uptime, deployment milestones, and ROI, that distinction matters. In many industrial environments, what appears to be a network capacity problem is actually a symptom of architectural mismatch, bursty data behavior, protocol inefficiency, edge compute saturation, or timing instability between systems. Effective industrial IoT data throughput analysis starts by asking a more useful question: where is data being delayed, dropped, reprocessed, or serialized in ways the original design never accounted for?
The core search intent behind this topic is practical diagnosis. Project managers and engineering leads are not looking for a generic definition of throughput. They want to understand why systems underperform even when nominal bandwidth looks sufficient, how to distinguish root causes from symptoms, and what framework helps teams make better decisions before they waste budget on the wrong fix.
For this audience, the most valuable content is not a broad Industry 4.0 overview. It is a decision-oriented explanation of what is commonly misread, what evidence matters, how bottlenecks actually propagate across an automation stack, and which corrective actions produce measurable improvement. That is the lens this article takes.
Why “not enough bandwidth” is often the wrong diagnosis
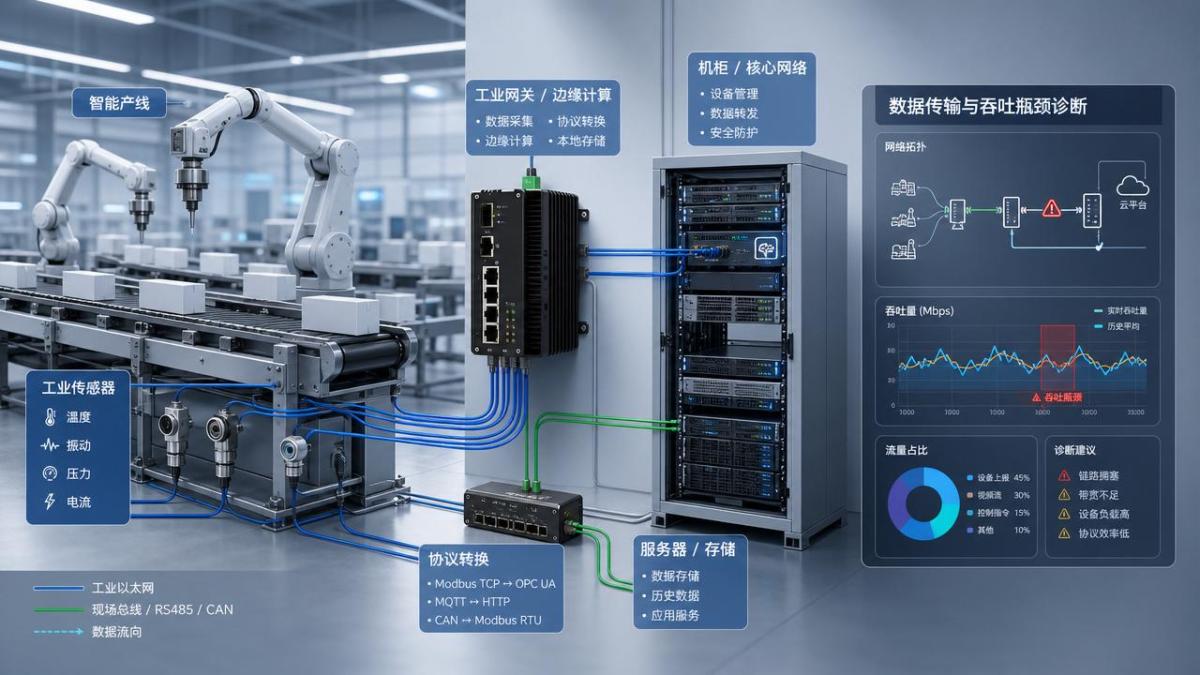
In industrial settings, teams often use “throughput bottleneck” as shorthand for any situation where data arrives late, dashboards lag, machine coordination degrades, or historian uploads fall behind. The problem is that bandwidth is only one variable in a much larger performance chain. A system can have adequate link capacity on paper and still fail in production because throughput is being constrained elsewhere.
This happens because throughput is not simply the maximum data rate of a network port. In a real plant environment, effective throughput is shaped by packet size, message frequency, polling behavior, retransmissions, protocol conversion, buffering strategy, CPU availability, storage write speed, edge inference time, and the scheduling behavior of both control and IT systems. If any one of these is poorly matched to actual operating conditions, the resulting slowdown can look like a network issue even when the network is not the primary bottleneck.
For project leaders, the risk is straightforward: misdiagnosis leads to the wrong capital allocation. Teams may upgrade switches, add bandwidth, or segment VLANs, only to discover that the true limiter sits inside a gateway, a protocol broker, a database commit queue, or an edge device trying to handle too many concurrent workloads. By then, delivery dates have slipped and confidence in the deployment has eroded.
What project managers and engineering leads actually need to know first
Before asking how much throughput a system should support, it is more useful to ask what type of throughput the application really demands. Industrial IoT traffic is not uniform. A predictive maintenance application sending compressed vibration features every few seconds behaves very differently from a machine vision pipeline, a high-frequency telemetry stream, or an event-driven alarm system with bursty load patterns.
That distinction matters because many bottlenecks are hidden by average metrics. A plant may show acceptable average throughput over a shift while still suffering from short but damaging congestion windows. Those brief spikes can disrupt time-sensitive data paths, delay command acknowledgments, or overwhelm edge nodes responsible for pre-processing. If the team only looks at average network utilization, they miss the operational reality.
Decision-makers should also separate business symptoms from technical causes. “The MES is delayed,” “our OEE dashboard is unreliable,” or “we cannot scale the pilot to three more lines” are symptoms. The underlying causes may involve serialization overhead in OPC UA, inefficient MQTT topic design, CPU contention inside an edge gateway, oversized payload structures, or cloud ingestion rate limits that were never modeled during the proof of concept stage.
The most common reasons throughput bottlenecks are misdiagnosed
The first reason is metric oversimplification. Many teams rely on a narrow set of indicators such as link speed, ping latency, or headline gateway throughput. Those numbers are useful, but they do not describe application-level performance under mixed industrial workloads. A gateway rated for high throughput in lab conditions may behave very differently when simultaneously handling protocol translation, local analytics, device management, encryption, and store-and-forward buffering.
The second reason is that pilot environments are too clean. Early deployments often run with a limited number of devices, ideal message schedules, and minimal exception handling. Once the architecture moves into live production, throughput behavior changes. More devices connect. Data bursts become less predictable. Maintenance windows overlap with analytics jobs. Logs expand. Security controls add overhead. What looked stable in a demo begins to fail at scale.
The third reason is confusion between throughput and latency. A system may move large volumes of data overall, yet still be unsuitable for applications that require deterministic response timing. In industrial automation, late data can be almost as harmful as lost data. If time alignment breaks between sensors, PLCs, SCADA, and edge analytics, the plant may experience false alerts, poor control quality, or delayed operator visibility even though bulk data transfer remains technically high.
The fourth reason is hidden protocol cost. Industrial environments rarely operate with a single clean data path. They combine fieldbus traffic, PLC communications, OPC UA sessions, MQTT brokers, REST APIs, database writes, cloud connectors, and cybersecurity layers. Every translation, handshake, header, security wrapper, and retry mechanism consumes compute and transmission resources. What appears to be “small data” at the sensor level can become much heavier by the time it reaches enterprise applications.
The fifth reason is weak observability across layers. OT teams may see device health and controller timing. IT teams may see server load and network utilization. Cloud teams may see ingestion performance. But if nobody owns end-to-end performance visibility, each group can prove its own layer is “within limits” while the overall system still underperforms. This fragmented accountability is one of the most persistent causes of misdiagnosed throughput problems.
Where the real bottleneck often sits in an Industrial IoT stack
In many deployments, the bottleneck is at the edge. Edge gateways and industrial PCs are frequently asked to do too much. They ingest data, normalize protocols, filter noise, run local analytics, compress payloads, manage security certificates, buffer during outages, and forward data upstream. When CPU, memory, or storage I/O reaches saturation, throughput degrades in subtle ways long before the device fully fails.
Another common choke point is protocol conversion. Plants often connect legacy equipment to newer IIoT platforms through translation layers. Each layer adds processing time and possible serialization delays. If polling intervals are poorly designed or payloads are too verbose, the architecture may spend more effort moving and reformatting data than extracting value from it.
Message brokers are another frequent source of hidden constraint. MQTT or similar systems can be highly efficient, but only when topic structure, quality-of-service settings, retain policies, and subscriber behavior are designed with scale in mind. Poor topic hierarchy or excessive QoS levels can increase broker load, memory use, and retransmission behavior, all of which reduce practical throughput.
Storage pipelines also deserve more attention than they usually receive. Throughput can collapse downstream when time-series databases, historians, or cloud data lakes are not tuned for write patterns coming from the plant. Batch frequency, indexing strategy, compression, and retention rules all affect ingestion speed. Teams sometimes blame the network for delays that actually originate in storage acknowledgment cycles.
Finally, security controls can create legitimate overhead that must be engineered, not ignored. Encryption, deep packet inspection, segmentation, and certificate management are essential. But they are not free. When added late in the project, they can materially alter throughput and latency behavior. Mature planning accounts for this overhead early instead of treating cybersecurity as operational friction added after performance testing.
How to run industrial IoT data throughput analysis that leads to root cause
A useful industrial IoT data throughput analysis begins with traffic characterization, not assumptions. Teams should document what data is being generated, by which devices, at what frequency, in what payload sizes, under which event conditions, and with what timing sensitivity. Without this inventory, the discussion stays abstract and vendors can hide behind nominal specifications that do not reflect the actual workload.
The second step is to map the full data path. From sensor or controller to gateway, broker, storage layer, dashboard, and cloud service, every transformation point should be visible. This is where many projects uncover unexpected hops, duplicated messages, unnecessary polling loops, or software services competing for the same hardware resources.
Third, measure more than average throughput. Peak load, burst duration, queue depth, packet loss, retransmission frequency, processing delay, and end-to-end latency variation are often more revealing than headline bandwidth utilization. Short-lived bursts matter because industrial systems frequently fail during transitions, not during steady-state operation. Startup sequences, recipe changes, alarm events, and maintenance actions all stress the architecture differently.
Fourth, isolate layers systematically. If possible, test raw network performance separately from application performance. Then test protocol conversion separately from analytics workloads. Then examine storage ingestion independently. This layered approach helps teams avoid the common trap of changing multiple variables at once and learning nothing from the result.
Fifth, validate under realistic scale. A proper test should reflect expected device counts, message frequency, failover scenarios, and security settings. It should also include degraded conditions such as intermittent connectivity, local buffering, and simultaneous operational tasks. Throughput claims that hold only in ideal conditions are not decision-grade engineering evidence.
Signals that tell you the problem is architectural, not just bandwidth-related
If network utilization remains moderate while application lag increases, the issue is likely not pure bandwidth. If delays appear mainly during burst events, the problem may be buffering, compute scheduling, or broker behavior. If adding bandwidth produces little improvement, that is another strong sign that the true bottleneck lies elsewhere.
Watch for uneven performance across identical devices or lines. That often points to local processing differences, firmware behavior, configuration drift, or topology inconsistencies rather than a global capacity limit. Similarly, if control traffic stays healthy while analytics or historian traffic falls behind, the bottleneck may be in non-real-time processing layers rather than in core industrial networking.
Frequent retries, duplicate messages, growing queue depth, and rising CPU load on gateways are especially important indicators. They suggest that the system is spending resources recovering from inefficiency instead of delivering clean throughput. In these cases, more bandwidth may only allow the architecture to fail slightly later.
What better decisions look like for project-focused leaders
For project managers and engineering leads, the value of better diagnosis is strategic as much as technical. It protects budget from reactive upgrades that do not solve the problem. It shortens supplier evaluation cycles because teams ask sharper performance questions. And it improves deployment confidence by linking throughput targets to real operating conditions instead of marketing claims.
Stronger decision-making usually starts with more disciplined specification. Instead of asking whether a gateway or platform supports “high throughput,” ask for tested throughput under defined protocol mixes, security settings, edge compute loads, and buffering scenarios. Require evidence on latency distribution, not just average values. Ask how performance changes when local analytics, compression, or protocol translation are enabled.
This is especially important in advanced manufacturing, where one weak layer can distort the economics of an entire digital initiative. A poorly sized edge architecture can delay predictive maintenance programs. A broker bottleneck can undermine plant-wide visibility. A storage ingestion issue can make traceability incomplete. Each of these outcomes affects operational credibility far beyond the network team.
A practical framework for avoiding throughput misdiagnosis from the start
The most reliable approach is data-first engineering. Define application classes early, model real traffic patterns, identify deterministic versus non-deterministic data paths, and benchmark each architectural layer against expected scale. This creates a shared performance baseline before procurement and integration decisions lock the project into avoidable limitations.
Cross-functional ownership also matters. OT, IT, controls engineering, cybersecurity, and analytics teams should align on common performance metrics and test conditions. Without that alignment, each function may optimize its own domain while leaving the overall throughput problem unresolved.
Finally, treat throughput as a system behavior, not a single component specification. In industrial environments, the question is rarely whether one device is fast enough in isolation. The real question is whether the entire chain can move the right data, at the right time, with the right reliability, under real production constraints.
Conclusion: diagnose the path, not just the pipe
Throughput bottlenecks in Industrial IoT are often misdiagnosed because teams look first at link capacity instead of system behavior. For connected factories, the real limiter is frequently a combination of protocol overhead, burst dynamics, edge compute saturation, storage ingestion limits, or weak architectural fit between OT and IT layers.
That is why effective industrial IoT data throughput analysis must go beyond bandwidth checks. It should trace the full data path, measure under realistic load, and distinguish symptoms from root causes. For project leaders, this is not just a technical best practice. It is the difference between funding another superficial fix and building an IIoT architecture that performs reliably at scale.
In a market crowded with vague performance claims, the teams that win are the ones that insist on engineering truth: measured workloads, transparent bottlenecks, and specifications tied to actual plant conditions. When throughput is analyzed that way, misdiagnosis becomes less likely, and scalable industrial performance becomes far more achievable.
Search News
Hot Articles
- Carbon Fiber StructuresHow to Specify Aerospace Carbon Fiber Assemblies for Lightweight, Load-Bearing PartsJul 11, 2026
- Machine VisionXiaomi, Alibaba DAMO Academy Drive Open-Source Robotics Model Ecosystem, Lowering Algorithm Development Barriers for Overseas SMEs Adopting Chinese Robotics SolutionsMar 30, 2026
- Cobots & ArmsShanxi 'AI+' Conference Showcases Embodied Intelligence with Multinational Buyer Engagement: Key Industry ImplicationsMar 30, 2026
Popular Tags
Recommended News
 Jul 11, 2026How to Specify Aerospace Carbon Fiber Assemblies for Lightweight, Load-Bearing PartsAerospace carbon fiber assemblies: learn how to specify laminate design, load data, joining methods, and inspection controls for lighter, reliable load-bearing aerospace parts.Elena Rostova (UAV Systems Researcher)
 Mar 30, 2026Xiaomi, Alibaba DAMO Academy Drive Open-Source Robotics Model Ecosystem, Lowering Algorithm Development Barriers for Overseas SMEs Adopting Chinese Robotics SolutionsXiaomi & Alibaba DAMO Academy's open-source robotics models lower algorithm barriers for global SMEs. Boost efficiency in manufacturing, logistics & smart retail with ROS 2 compatible solutions.TSV Data Lab
 Mar 30, 2026Shanxi 'AI+' Conference Showcases Embodied Intelligence with Multinational Buyer Engagement: Key Industry ImplicationsShanxi 'AI+' Conference highlights embodied intelligence with Tesla, Ubtech & Jiantao showcasing multimodal robotics. 40+ global buyers validated tech on-site, creating new B2B channels for industrial automation & AI solutions.Chen Wei (Automation Lead Engineer)
 Mar 30, 2026Zhongguancun Unveils 6G Integrated Sensing-Computing-Intelligence Platform to Empower Embodied Robots for Global Industrial ApplicationsZhongguancun's new 6G platform revolutionizes industrial robotics with <10ms latency, empowering global automotive, logistics & port automation. Discover how this tech boosts China's smart manufacturing exports.TSV Data Lab
 Mar 30, 2026Mech-Mind Tianjin Embodied Intelligence R&D and Production Base Goes Live, Cutting Delivery Time by 20%–30% for Global Customized AMR+Vision SolutionsMech-Mind's Tianjin AMR+Vision production base cuts delivery time by 20%-30% for欧美 & Latin American markets. Discover how this PLd-certified facility accelerates customized robotics solutions for smart manufacturing and logistics.Chen Wei (Automation Lead Engineer)
 Mar 30, 2026Boao Forum Reveals 'Co-evolution of Big and Small Brains' Trend in Humanoid Robots, China's Embodied Intelligence Accelerates Adaptation to Overseas Manufacturing Service ScenariosDiscover how China's humanoid robots, featuring 'Co-evolution of Big and Small Brains,' are revolutionizing global manufacturing. Learn about Embodied Tian Gong 3.0's ISO compliance and overseas deployment at Boao Forum 2026.Chen Wei (Automation Lead Engineer)
 Mar 30, 2026China Railway Industrial Secures Patent for Embodied Robotics in Material Handling, Boosting High-Precision Delivery Capabilities for Overseas Infrastructure and Manufacturing ProjectsChina Railway Industrial's new patent for embodied robotics in material handling boosts high-precision delivery for global infrastructure & manufacturing. Discover how this innovation enhances logistics accuracy in automotive, rail transit & EPC projects.Chen Wei (Automation Lead Engineer)
 Sep 28, 2026Spindle Runout Measurement in Germany: DIN Standards, Methods, and Acceptance LimitsSpindle runout measurement Germany: explore DIN standards, proven methods, acceptance limits, and audit-ready practices for reliable machining quality.Dr. Marcus Vance
 Sep 27, 2026How to Select Wall-Mount Edge Devices for Space-Constrained Factory NetworksWall mount edge devices for space-constrained factories: evaluate workload, thermal design, power resilience, cable access, and network reliability for smarter deployments.TSV Data Lab
 Sep 26, 2026Machining Tolerance Analysis: How to Set Limits That Meet Function and Cost TargetsMachining tolerance analysis: learn how to set functional limits, control tolerance stacks, reduce inspection risk, and balance precision with production cost.Dr. Marcus Vance
 Sep 25, 2026How to Evaluate an Industrial Infrastructure Data Platform for Multi-Site OperationsIndustrial infrastructure data platform evaluation guide for multi-site operations: compare data quality, edge resilience, interoperability, governance, and scalable proof-of-value criteria.Victor Lin (Chief Software Architect)
 Sep 24, 2026How to Select Machine Vision Optics for Accurate Inspection at Different Working DistancesMachine vision optics selection guide for accurate inspection at every working distance. Compare FOV, pixel scale, DOF, distortion, lighting, and telecentric options.TSV Data Lab
 Sep 23, 2026How to Evaluate a Machine Vision System Integrator for High-Speed Inspection LinesChoose a machine vision system integrator with proven expertise in high-speed inspection, reliable reject timing, robust optics, and measurable acceptance criteria.TSV Data Lab
 Sep 28, 2026When is a SCADA API the right choice for connecting plant systems?SCADA API guide: learn when governed plant data integration improves traceability, security, and scalability—without compromising real-time control.Victor Lin (Chief Software Architect)
 Sep 27, 2026How SCADA data integration improves traceability across production linesSCADA data integration connects production-line data to improve traceability, accelerate quality investigations, and strengthen safety decisions.Victor Lin (Chief Software Architect)
 Sep 26, 2026What to define before starting SCADA integration planningSCADA integration planning starts with clear scope, control boundaries, data models, cybersecurity, and testing. Discover the definitions that reduce risk and costly rework.Victor Lin (Chief Software Architect)
 Sep 25, 2026How a smart factory with Industrial IoT reduces production blind spotsDiscover how a smart factory with Industrial IoT turns real-time machine, quality, and workflow data into actionable insights that reduce production blind spots and delivery risks.Victor Lin (Chief Software Architect)
 Sep 24, 2026When does Industrial IoT make smart manufacturing easier to scale?Smart manufacturing Industrial IoT scales when trusted data, interoperable systems, and secure workflows turn connected assets into measurable gains.TSV Data Lab
 Sep 23, 2026What drives ultra-precision machining cost at 1-micron tolerance?Ultra precision machining cost per part at 1 micron tolerance depends on process, material, metrology, and yield. Learn how to compare quotes confidently.Dr. Marcus Vance
 Sep 22, 2026Drone Engine-T550CC Applications: Build the UAV Power System Around the MissionAn application guide for Drone Engine-T550CC integration, covering payload planning, airframe matching, cooling, fuel, vibration, test procedures, documentation, and service preparation.Elena Rostova (UAV Systems Researcher)
 Sep 22, 2026How to Evaluate Industrial Edge Computing Vendors for Factory DeploymentIndustrial edge computing vendor evaluation guide for factories: compare latency, protocol fit, reliability, security, and lifecycle support before deployment.TSV Data Lab
 Sep 21, 2026Drone Payload Integration: Matching Power, Data, and Center of Gravity for Reliable FlightsDrone payload integration made practical: balance power, data, center of gravity, and endurance to build safer, more reliable mission-ready flights.Elena Rostova (UAV Systems Researcher)
 Sep 20, 2026Autonomous Navigation Pricing: Cost Drivers and Budget Benchmarks for AMR ProjectsAutonomous navigation price explained: compare AMR cost drivers, software, sensors, integration, safety, and lifecycle budgets to build a scalable project plan.Chen Wei (Automation Lead Engineer)
 Sep 19, 2026How to Scope Automation Integration Services for Multi-System Factory ProjectsAutomation integration services: learn how to scope multi-system factory projects with clear workflows, interface contracts, safety boundaries, and acceptance criteria.Victor Lin (Chief Software Architect)