What data throughput analysis reveals in IIoT bottlenecks
Publication Date
author
For operators on the factory floor, hidden slowdowns often begin where machine signals, edge devices, and gateways fail to move data fast enough. This article uses industrial IoT data throughput analysis to uncover the real causes of IIoT bottlenecks, helping teams identify latency, packet loss, and bandwidth constraints before they erode uptime, visibility, and process stability.
What does industrial IoT data throughput analysis actually measure?
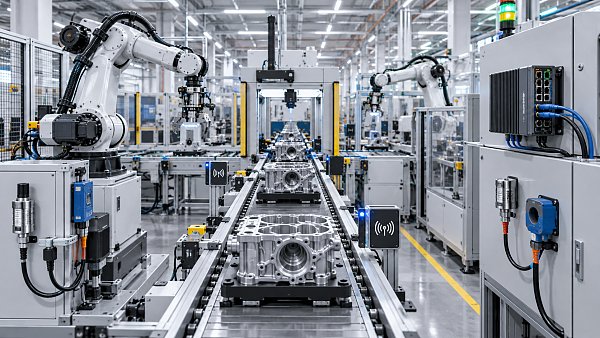
At the operator level, industrial IoT data throughput analysis is not just a network speed check. It is a practical method for measuring how much production data moves through an IIoT system, how consistently it moves, and where it gets delayed, dropped, or distorted. In a real plant, that data may come from PLCs, machine vision devices, vibration sensors, temperature probes, AGVs, barcode readers, and edge gateways. The analysis looks at volume, timing, path, and quality together.
Throughput is usually described as the amount of data successfully transmitted in a given time, but operators should also pay attention to latency, jitter, packet retransmissions, protocol overhead, queue depth, and burst behavior. A system can show acceptable average throughput while still causing production issues if traffic arrives in bursts that overload a gateway buffer or if one protocol monopolizes bandwidth during shift changes, recipe downloads, or image uploads.
This is why industrial IoT data throughput analysis matters in mixed environments. Modern factories do not run one neat stream of data. They run many streams with different timing needs. A vibration trend can tolerate delay, while a machine interlock or robotic coordination signal cannot. Analysis helps separate critical real-time traffic from noncritical historical or diagnostic traffic so that slowdowns are interpreted correctly.
Why do IIoT bottlenecks happen even when the network seems “fast enough”?
One of the most common misunderstandings is assuming that a high-bandwidth link automatically prevents bottlenecks. In practice, IIoT bottlenecks often come from mismatches between data generation, protocol behavior, gateway compute limits, and application polling patterns. A nominally fast Ethernet segment may still underperform if edge devices compress, decrypt, parse, buffer, and forward too much information at once.
Operators often see symptoms before they see causes. Dashboards update late. Machine states freeze briefly. Alarm timestamps no longer line up with what happened on the line. Historical data contains gaps. Vision inspection results arrive after the reject mechanism has already moved on. These are not always software bugs. They may be direct evidence that the data path is saturated or badly prioritized.
Several specific patterns create hidden bottlenecks:
- High-frequency sensors sending more raw data than the gateway can preprocess
- Too many devices polled at short intervals instead of using event-driven publishing
- Protocol conversion between Modbus, OPC UA, MQTT, and proprietary formats adding CPU and memory load
- Image, LiDAR, or vibration data sharing the same path as time-sensitive control telemetry
- Cloud sync jobs or batch uploads starting during production peaks
- Poor switch configuration, weak QoS rules, or overloaded wireless cells
In hard-tech environments like robotics, aerospace component machining, and sensor-rich automation cells, these issues are amplified because the cost of delayed data is not just inconvenience. It can mean scrap, false alarms, downtime, or uncertainty in root-cause analysis.
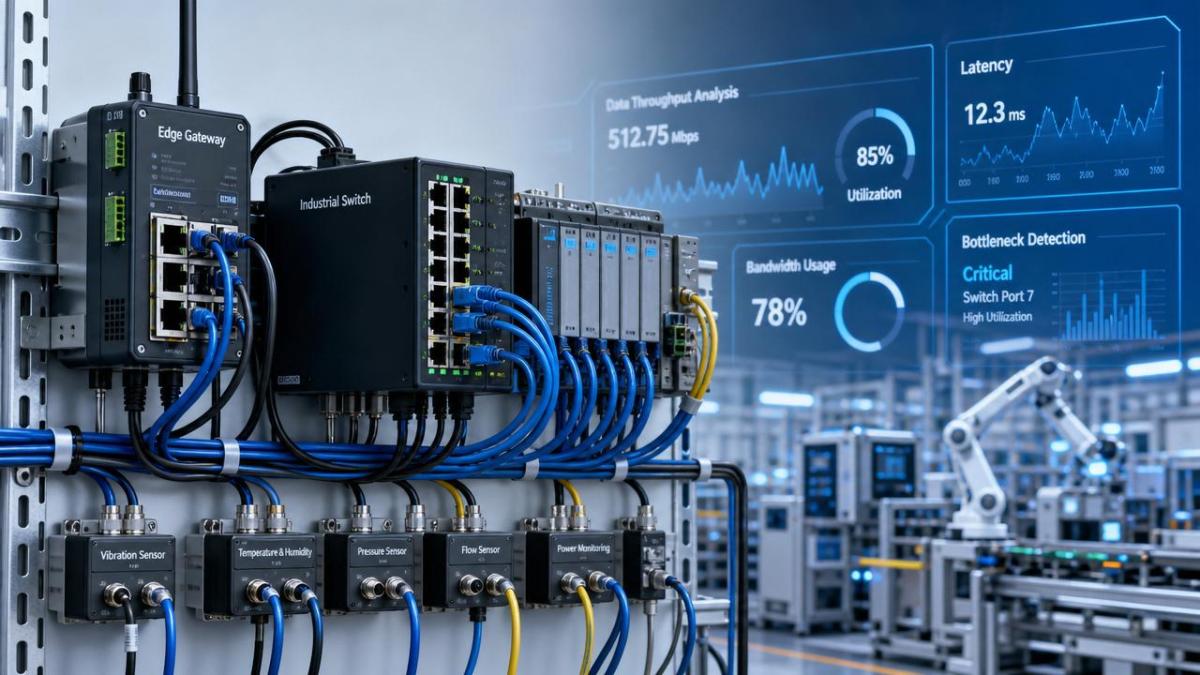
Which warning signs tell operators that throughput is becoming the real problem?
Industrial IoT data throughput analysis becomes especially valuable when symptoms look random. The key is to identify repeatable indicators. Operators do not need to wait for a total communication failure. Smaller clues usually appear first, and they often show up at the same times every day: startup, product changeover, heavy inspection cycles, or end-of-shift reporting.
Watch for these field-level indicators:
- HMI screens updating slower than actual machine behavior
- Intermittent gaps in historian records or missing sensor points
- Edge gateway CPU spikes that align with data bursts
- Increasing packet loss or retries on industrial switches
- Alarm floods after communication resumes, suggesting buffered events
- Analytics models losing accuracy because timestamps drift or arrive out of order
- Wireless devices showing acceptable signal strength but unstable response time
These signs matter because a throughput issue rarely stays isolated. Once delays begin, downstream systems react badly. MES status lags, digital traceability weakens, maintenance alerts come too late, and production teams start working around the system rather than trusting it. That is exactly the kind of information noise TSV warns against: when data exists, but its engineering value is compromised by poor transport quality.
What should operators measure first during industrial IoT data throughput analysis?
The first step is not buying new hardware. It is establishing a baseline. Operators and technicians should document what types of data are flowing, at what rates, from which devices, and with what timing requirement. This turns troubleshooting from guesswork into measurable engineering.
A useful starting checklist includes source device count, bytes per message, publish or polling interval, protocol used, peak event frequency, gateway resource usage, uplink utilization, and end-to-end delay from sensor generation to visible application output. Without that baseline, teams may replace a switch when the actual problem is an oversized polling schedule or unfiltered raw data stream.
The table below summarizes what to check first and what each metric may reveal.
How do different IIoT data types change the bottleneck picture?
Not all industrial traffic behaves the same. A plant collecting scalar sensor values every second has a very different throughput profile from a line running machine vision or edge AI inference. Industrial IoT data throughput analysis must reflect those differences, or the conclusions will be misleading.
Low-bandwidth telemetry such as temperatures, pressures, or motor states may create bottlenecks only when device count becomes large or polling is wasteful. By contrast, high-density sources such as cameras, LiDAR, acoustic monitoring, and vibration waveforms can saturate buffers or processing pipelines quickly, even if there are only a few of them. The bottleneck may sit in serialization, compression, storage writes, or protocol packaging rather than the physical cable itself.
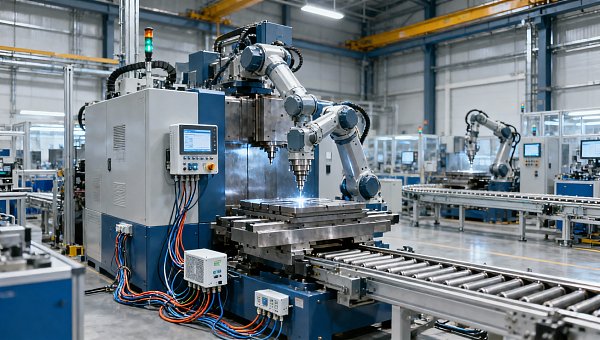
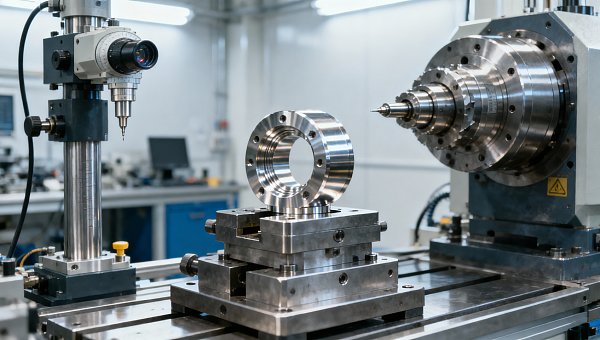
This distinction matters in advanced manufacturing ecosystems. A robot cell can appear healthy at the PLC level while its vision subsystem is silently dropping frames. A CNC monitoring setup can capture spindle status reliably but miss high-resolution vibration signatures needed for predictive maintenance. In both cases, the operator sees partial visibility and may assume the system is complete when it is not.
A good rule is to classify traffic into at least three groups: time-critical control-adjacent data, operational visibility data, and heavy analytical data. Then check whether each group has the right path, priority, and buffering strategy. Mixing everything equally is a common cause of IIoT performance decay.
What are the most common mistakes when teams try to fix throughput bottlenecks?
The biggest mistake is treating industrial IoT data throughput analysis as a one-time IT task instead of an operational reliability practice. Bottlenecks often emerge gradually as more tags, sensors, dashboards, and cloud connectors are added. The line worked last year, so teams assume the architecture is still fine. But cumulative load changes the system behavior.
Another mistake is focusing only on average utilization. Average numbers hide the burst events that cause real disruption. A network at 35% average load can still fail during ten-second spikes if camera uploads, MES transactions, and historian sync happen together. Operators should demand peak-period traces, not just daily averages.
Other frequent errors include:
- Adding more bandwidth without cleaning up noisy data collection
- Ignoring timestamp integrity and only checking whether data eventually arrives
- Assuming cloud delays are harmless for local operations
- Overlooking the edge gateway as a bottleneck because the link speed looks normal
- Using one polling policy for every device regardless of process criticality
These mistakes create a dangerous illusion: the system seems connected, but engineering truth is degraded. For TSV, this is where parameter-based thinking matters. Real performance is defined by measured latency envelopes, loss rates, and sustained data handling capacity under actual production conditions, not by brochure claims.
How can operators reduce IIoT bottlenecks without disrupting production?
Most plants can improve throughput reliability through staged changes rather than full redesign. Start by identifying the few data paths that matter most to uptime, quality, and traceability. Protect those first. Separate noncritical reporting, archival, or cloud synchronization from real-time operational traffic wherever possible.
Next, reduce unnecessary load at the source. Many IIoT systems collect more data than anyone uses. If a tag is polled every 100 milliseconds but reviewed once per shift, that is waste. If a machine vision stream is archived at full resolution when only defect metadata is needed downstream, that is waste too. Filtering, aggregation, event-based publishing, and edge preprocessing often deliver more benefit than simply upgrading the uplink.
Operators should also work with controls, OT, and IT teams to verify queue handling, QoS policy, VLAN segmentation, gateway sizing, and retry behavior. Even small adjustments can stabilize a line. Examples include slowing noncritical scan rates, scheduling batch uploads outside production peaks, or isolating heavy sensor traffic from control-adjacent communications.
Finally, validate every change using industrial IoT data throughput analysis again. Improvement is not confirmed because complaints stop for one shift. It is confirmed when measured peak throughput, end-to-end delay, and data loss behavior remain within acceptable limits over time.
When should a plant escalate from monitoring to redesign?
Escalation is justified when bottlenecks are structural rather than incidental. If operators repeatedly see delayed alarms, unstable visibility, data gaps during normal production, or gateway overload after routine expansion, the architecture may no longer match the process. This is especially true in plants adding robotics, high-speed inspection, edge AI, or denser condition monitoring.
A redesign may be necessary if the system depends on one overloaded gateway, lacks traffic prioritization, mixes heavy and time-sensitive data on the same path, or cannot scale without sharp latency growth. In those cases, patching around the issue can cost more in downtime and troubleshooting than redesigning key segments with clearer data roles and performance thresholds.
If you need to confirm the next step, start with practical questions: Which signals are truly time-critical? What is the highest burst load during real production? Where do packet loss and latency first appear? Is the bottleneck in the sensor, gateway, protocol stack, switch, wireless layer, or cloud connector? Which tags can be aggregated, filtered, or shifted to lower priority? By asking those questions first, teams can move from vague IIoT frustration to measurable, actionable decisions grounded in industrial IoT data throughput analysis.
Search News
Hot Articles
- Carbon Fiber StructuresHow to Specify Aerospace Carbon Fiber Assemblies for Lightweight, Load-Bearing PartsJul 11, 2026
- Machine VisionXiaomi, Alibaba DAMO Academy Drive Open-Source Robotics Model Ecosystem, Lowering Algorithm Development Barriers for Overseas SMEs Adopting Chinese Robotics SolutionsMar 30, 2026
- Cobots & ArmsShanxi 'AI+' Conference Showcases Embodied Intelligence with Multinational Buyer Engagement: Key Industry ImplicationsMar 30, 2026
Popular Tags
Recommended News
 Jul 11, 2026How to Specify Aerospace Carbon Fiber Assemblies for Lightweight, Load-Bearing PartsAerospace carbon fiber assemblies: learn how to specify laminate design, load data, joining methods, and inspection controls for lighter, reliable load-bearing aerospace parts.Elena Rostova (UAV Systems Researcher)
 Mar 30, 2026Xiaomi, Alibaba DAMO Academy Drive Open-Source Robotics Model Ecosystem, Lowering Algorithm Development Barriers for Overseas SMEs Adopting Chinese Robotics SolutionsXiaomi & Alibaba DAMO Academy's open-source robotics models lower algorithm barriers for global SMEs. Boost efficiency in manufacturing, logistics & smart retail with ROS 2 compatible solutions.TSV Data Lab
 Mar 30, 2026Shanxi 'AI+' Conference Showcases Embodied Intelligence with Multinational Buyer Engagement: Key Industry ImplicationsShanxi 'AI+' Conference highlights embodied intelligence with Tesla, Ubtech & Jiantao showcasing multimodal robotics. 40+ global buyers validated tech on-site, creating new B2B channels for industrial automation & AI solutions.Chen Wei (Automation Lead Engineer)
 Mar 30, 2026Zhongguancun Unveils 6G Integrated Sensing-Computing-Intelligence Platform to Empower Embodied Robots for Global Industrial ApplicationsZhongguancun's new 6G platform revolutionizes industrial robotics with <10ms latency, empowering global automotive, logistics & port automation. Discover how this tech boosts China's smart manufacturing exports.TSV Data Lab
 Mar 30, 2026Mech-Mind Tianjin Embodied Intelligence R&D and Production Base Goes Live, Cutting Delivery Time by 20%–30% for Global Customized AMR+Vision SolutionsMech-Mind's Tianjin AMR+Vision production base cuts delivery time by 20%-30% for欧美 & Latin American markets. Discover how this PLd-certified facility accelerates customized robotics solutions for smart manufacturing and logistics.Chen Wei (Automation Lead Engineer)
 Mar 30, 2026Boao Forum Reveals 'Co-evolution of Big and Small Brains' Trend in Humanoid Robots, China's Embodied Intelligence Accelerates Adaptation to Overseas Manufacturing Service ScenariosDiscover how China's humanoid robots, featuring 'Co-evolution of Big and Small Brains,' are revolutionizing global manufacturing. Learn about Embodied Tian Gong 3.0's ISO compliance and overseas deployment at Boao Forum 2026.Chen Wei (Automation Lead Engineer)
 Mar 30, 2026China Railway Industrial Secures Patent for Embodied Robotics in Material Handling, Boosting High-Precision Delivery Capabilities for Overseas Infrastructure and Manufacturing ProjectsChina Railway Industrial's new patent for embodied robotics in material handling boosts high-precision delivery for global infrastructure & manufacturing. Discover how this innovation enhances logistics accuracy in automotive, rail transit & EPC projects.Chen Wei (Automation Lead Engineer)
 Sep 28, 2026Spindle Runout Measurement in Germany: DIN Standards, Methods, and Acceptance LimitsSpindle runout measurement Germany: explore DIN standards, proven methods, acceptance limits, and audit-ready practices for reliable machining quality.Dr. Marcus Vance
 Sep 27, 2026How to Select Wall-Mount Edge Devices for Space-Constrained Factory NetworksWall mount edge devices for space-constrained factories: evaluate workload, thermal design, power resilience, cable access, and network reliability for smarter deployments.TSV Data Lab
 Sep 26, 2026Machining Tolerance Analysis: How to Set Limits That Meet Function and Cost TargetsMachining tolerance analysis: learn how to set functional limits, control tolerance stacks, reduce inspection risk, and balance precision with production cost.Dr. Marcus Vance
 Sep 25, 2026How to Evaluate an Industrial Infrastructure Data Platform for Multi-Site OperationsIndustrial infrastructure data platform evaluation guide for multi-site operations: compare data quality, edge resilience, interoperability, governance, and scalable proof-of-value criteria.Victor Lin (Chief Software Architect)
 Sep 24, 2026How to Select Machine Vision Optics for Accurate Inspection at Different Working DistancesMachine vision optics selection guide for accurate inspection at every working distance. Compare FOV, pixel scale, DOF, distortion, lighting, and telecentric options.TSV Data Lab
 Sep 23, 2026How to Evaluate a Machine Vision System Integrator for High-Speed Inspection LinesChoose a machine vision system integrator with proven expertise in high-speed inspection, reliable reject timing, robust optics, and measurable acceptance criteria.TSV Data Lab
 Sep 28, 2026When is a SCADA API the right choice for connecting plant systems?SCADA API guide: learn when governed plant data integration improves traceability, security, and scalability—without compromising real-time control.Victor Lin (Chief Software Architect)
 Sep 27, 2026How SCADA data integration improves traceability across production linesSCADA data integration connects production-line data to improve traceability, accelerate quality investigations, and strengthen safety decisions.Victor Lin (Chief Software Architect)
 Sep 26, 2026What to define before starting SCADA integration planningSCADA integration planning starts with clear scope, control boundaries, data models, cybersecurity, and testing. Discover the definitions that reduce risk and costly rework.Victor Lin (Chief Software Architect)
 Sep 25, 2026How a smart factory with Industrial IoT reduces production blind spotsDiscover how a smart factory with Industrial IoT turns real-time machine, quality, and workflow data into actionable insights that reduce production blind spots and delivery risks.Victor Lin (Chief Software Architect)
 Sep 24, 2026When does Industrial IoT make smart manufacturing easier to scale?Smart manufacturing Industrial IoT scales when trusted data, interoperable systems, and secure workflows turn connected assets into measurable gains.TSV Data Lab
 Sep 23, 2026What drives ultra-precision machining cost at 1-micron tolerance?Ultra precision machining cost per part at 1 micron tolerance depends on process, material, metrology, and yield. Learn how to compare quotes confidently.Dr. Marcus Vance
 Sep 22, 2026Drone Engine-T550CC Applications: Build the UAV Power System Around the MissionAn application guide for Drone Engine-T550CC integration, covering payload planning, airframe matching, cooling, fuel, vibration, test procedures, documentation, and service preparation.Elena Rostova (UAV Systems Researcher)
 Sep 22, 2026How to Evaluate Industrial Edge Computing Vendors for Factory DeploymentIndustrial edge computing vendor evaluation guide for factories: compare latency, protocol fit, reliability, security, and lifecycle support before deployment.TSV Data Lab
 Sep 21, 2026Drone Payload Integration: Matching Power, Data, and Center of Gravity for Reliable FlightsDrone payload integration made practical: balance power, data, center of gravity, and endurance to build safer, more reliable mission-ready flights.Elena Rostova (UAV Systems Researcher)
 Sep 20, 2026Autonomous Navigation Pricing: Cost Drivers and Budget Benchmarks for AMR ProjectsAutonomous navigation price explained: compare AMR cost drivers, software, sensors, integration, safety, and lifecycle budgets to build a scalable project plan.Chen Wei (Automation Lead Engineer)
 Sep 19, 2026How to Scope Automation Integration Services for Multi-System Factory ProjectsAutomation integration services: learn how to scope multi-system factory projects with clear workflows, interface contracts, safety boundaries, and acceptance criteria.Victor Lin (Chief Software Architect)