How to read a lipo battery discharge rate curve correctly
Publication Date
author
A lipo battery discharge rate curve can reveal far more than a simple voltage drop—if you know how to read it correctly. For practical operation, this curve helps estimate usable energy, load stability, heat risk, and safe cutoff margins. In data-driven engineering environments, reading a lipo battery discharge rate curve correctly reduces guesswork and supports better runtime, safety, and maintenance decisions.
Why the lipo battery discharge rate curve matters more today
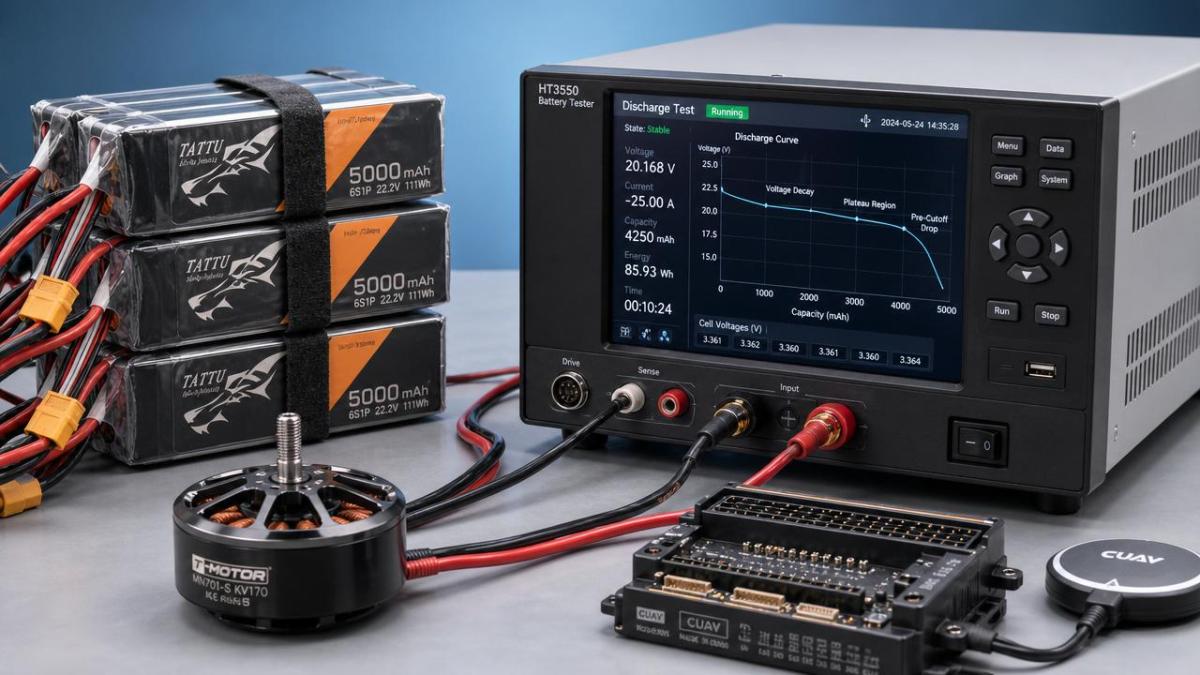
Across UAVs, mobile robotics, edge devices, and field electronics, power systems now face higher transient loads and tighter safety windows. That makes the lipo battery discharge rate curve more important than ever.
A label such as 25C or 50C gives only a headline rating. The actual lipo battery discharge rate curve shows how voltage behaves over time under a defined current, temperature, and cutoff threshold.
This matters because two packs with similar nominal specifications can behave very differently under load. One may hold voltage well through mid-discharge. Another may sag early and lose usable capacity fast.
For organizations aligned with engineering truth, curve interpretation is more valuable than marketing claims. The curve exposes internal resistance behavior, efficiency loss, and realistic operating boundaries.
The key signals hidden inside a lipo battery discharge rate curve
A correct reading starts by breaking the graph into zones. Most discharge plots use voltage on the vertical axis and capacity, time, or state of charge on the horizontal axis.
1. The initial voltage sag
The first drop appears almost immediately after load is applied. This is not always a defect. It reflects internal resistance and the gap between open-circuit voltage and loaded voltage.
A steep early sag often signals higher resistance, aging cells, poor temperature conditions, or excessive current demand. In practical use, this is where throttle punch or startup instability appears.
2. The plateau region
The middle section is the most useful part of the lipo battery discharge rate curve. A flatter plateau means the pack maintains stable voltage for longer under the tested load.
This region often defines real-world usability. If voltage remains stable here, motors, controllers, sensors, and transmitters receive more consistent power and performance.
3. The knee point
The knee is the sharp downward bend near the end of discharge. This is the most critical marker on a lipo battery discharge rate curve.
Once the curve enters this zone, voltage drops quickly while little usable energy remains. Continuing operation beyond the knee increases over-discharge risk and accelerates cell damage.
4. The cutoff endpoint
Many charts stop at a defined per-cell cutoff, such as 3.0V or 3.2V under load. This endpoint strongly affects the displayed capacity and curve length.
Never compare curves fairly unless cutoff voltage, temperature, and current are clearly stated. Without these test conditions, the chart can be misleading.
Why discharge curves are changing across applications
Modern systems place different stress patterns on batteries. Continuous current no longer tells the full story. Pulse loads, thermal cycling, and compact packaging are reshaping battery evaluation.
In drones, high burst current causes noticeable sag during climb or acceleration. In robotics, repeated stop-start movement creates recurring voltage dips. In portable electronics, thermal limits restrict usable discharge rates.
That is why a lipo battery discharge rate curve should be read as an application-specific performance map, not a generic battery advertisement.
Main drivers behind these changes
How to compare one lipo battery discharge rate curve to another
Direct comparison works only when test conditions are aligned. Many reading errors come from comparing curves generated at different current levels or temperatures.
- Check whether current is constant, pulsed, or stepped.
- Confirm ambient and cell starting temperature.
- Verify per-cell cutoff voltage.
- Note whether the horizontal axis shows time, mAh, or state of charge.
- Look for pack age, cycle count, and cell balancing condition.
If one lipo battery discharge rate curve holds a higher plateau at the same load, that pack usually delivers better real-world performance. If the knee appears later, more usable capacity remains before cutoff.
However, a longer curve is not always better. If it relies on very low cutoff voltage, it may show impressive capacity while reducing battery life and safety margin.
What the curve means for runtime, safety, and system behavior
The lipo battery discharge rate curve affects more than battery health. It also influences how the entire system behaves during operation.
In propulsion systems, voltage sag reduces thrust and can trigger premature low-voltage alarms. In sensing platforms, unstable voltage can affect data quality, transmission consistency, or processor behavior.
When the curve approaches the knee, thermal stress often rises. That combination of low voltage and high current is one of the least forgiving operating windows.
Observed impact by business or operating stage
- Testing stage: helps validate current draw assumptions.
- Deployment stage: supports realistic runtime estimates.
- Maintenance stage: reveals aging through earlier sag and knee shift.
- Safety control stage: improves low-voltage alarm and cutoff settings.
What to focus on when reading a lipo battery discharge rate curve
For practical interpretation, focus on a few high-value markers rather than every data point. This makes the lipo battery discharge rate curve easier to use in daily decisions.
- Measure loaded voltage, not just resting voltage.
- Identify the knee before setting minimum safe landing or shutdown limits.
- Compare plateau flatness across similar loads.
- Watch for curve shifts over repeated cycles.
- Treat cold-weather curves separately from room-temperature curves.
A useful rule is simple: stop treating rated C values as the final answer. The lipo battery discharge rate curve provides stronger evidence than printed marketing specifications.
A practical framework for better decisions
The next step is to build a curve-based operating habit
The value of a lipo battery discharge rate curve appears only when it is used consistently. Record loaded voltage, temperature, and runtime after each meaningful operating session.
Then compare those field observations with published or measured discharge curves. Over time, the connection between curve shape and real behavior becomes easy to recognize.
In hard-tech environments, better outcomes rarely come from louder claims. They come from better data interpretation. A correctly read lipo battery discharge rate curve supports safer limits, more stable output, and more reliable planning.
Start by reviewing one battery pack under one repeatable load. Mark the sag, plateau, knee, and cutoff. That simple habit can improve both performance and battery lifespan.
Search News
Hot Articles
- Carbon Fiber StructuresHow to Specify Aerospace Carbon Fiber Assemblies for Lightweight, Load-Bearing PartsJul 11, 2026
- Machine VisionXiaomi, Alibaba DAMO Academy Drive Open-Source Robotics Model Ecosystem, Lowering Algorithm Development Barriers for Overseas SMEs Adopting Chinese Robotics SolutionsMar 30, 2026
- Cobots & ArmsShanxi 'AI+' Conference Showcases Embodied Intelligence with Multinational Buyer Engagement: Key Industry ImplicationsMar 30, 2026
Popular Tags
Recommended News
 Jul 11, 2026How to Specify Aerospace Carbon Fiber Assemblies for Lightweight, Load-Bearing PartsAerospace carbon fiber assemblies: learn how to specify laminate design, load data, joining methods, and inspection controls for lighter, reliable load-bearing aerospace parts.Elena Rostova (UAV Systems Researcher)
 Mar 30, 2026Xiaomi, Alibaba DAMO Academy Drive Open-Source Robotics Model Ecosystem, Lowering Algorithm Development Barriers for Overseas SMEs Adopting Chinese Robotics SolutionsXiaomi & Alibaba DAMO Academy's open-source robotics models lower algorithm barriers for global SMEs. Boost efficiency in manufacturing, logistics & smart retail with ROS 2 compatible solutions.TSV Data Lab
 Mar 30, 2026Shanxi 'AI+' Conference Showcases Embodied Intelligence with Multinational Buyer Engagement: Key Industry ImplicationsShanxi 'AI+' Conference highlights embodied intelligence with Tesla, Ubtech & Jiantao showcasing multimodal robotics. 40+ global buyers validated tech on-site, creating new B2B channels for industrial automation & AI solutions.Chen Wei (Automation Lead Engineer)
 Mar 30, 2026Zhongguancun Unveils 6G Integrated Sensing-Computing-Intelligence Platform to Empower Embodied Robots for Global Industrial ApplicationsZhongguancun's new 6G platform revolutionizes industrial robotics with <10ms latency, empowering global automotive, logistics & port automation. Discover how this tech boosts China's smart manufacturing exports.TSV Data Lab
 Mar 30, 2026Mech-Mind Tianjin Embodied Intelligence R&D and Production Base Goes Live, Cutting Delivery Time by 20%–30% for Global Customized AMR+Vision SolutionsMech-Mind's Tianjin AMR+Vision production base cuts delivery time by 20%-30% for欧美 & Latin American markets. Discover how this PLd-certified facility accelerates customized robotics solutions for smart manufacturing and logistics.Chen Wei (Automation Lead Engineer)
 Mar 30, 2026Boao Forum Reveals 'Co-evolution of Big and Small Brains' Trend in Humanoid Robots, China's Embodied Intelligence Accelerates Adaptation to Overseas Manufacturing Service ScenariosDiscover how China's humanoid robots, featuring 'Co-evolution of Big and Small Brains,' are revolutionizing global manufacturing. Learn about Embodied Tian Gong 3.0's ISO compliance and overseas deployment at Boao Forum 2026.Chen Wei (Automation Lead Engineer)
 Mar 30, 2026China Railway Industrial Secures Patent for Embodied Robotics in Material Handling, Boosting High-Precision Delivery Capabilities for Overseas Infrastructure and Manufacturing ProjectsChina Railway Industrial's new patent for embodied robotics in material handling boosts high-precision delivery for global infrastructure & manufacturing. Discover how this innovation enhances logistics accuracy in automotive, rail transit & EPC projects.Chen Wei (Automation Lead Engineer)
 Oct 04, 2026CAD/CAM Benchmarking in the GCC: What Manufacturers Should Ask a ConsultantCAD CAM benchmark consultant GCC guide: learn the key questions manufacturers should ask to validate post-processors, workflows, machine performance, and production risk.Victor Lin (Chief Software Architect)
 Oct 03, 2026Selecting Automotive Radar Sensor Modules for ADAS Range, Resolution, and IntegrationAutomotive radar sensor module selection guide for ADAS: compare range, resolution, field of view, latency, and integration to build safer, reliable vehicle systems.TSV Data Lab
 Oct 02, 2026How to Qualify Machined Parts Suppliers for Hard Tech ProgramsHard tech supply chain machined parts demand rigorous supplier qualification. Learn how to assess capability, traceability, quality controls, and delivery resilience.Dr. Marcus Vance
 Oct 01, 2026How to Select an Outdoor Security Radar Sensor for Perimeter Detection?Outdoor security radar sensor selection guide: compare range, accuracy, false-alarm control, integration, and field testing for reliable perimeter detection.TSV Data Lab
 Sep 30, 2026How to Evaluate Solid-State LiDAR Hardware for Outdoor Autonomous VehiclesSolid state LiDAR hardware evaluation guide for outdoor autonomous vehicles—compare range, point-cloud quality, environmental resilience, integration, and safety.TSV Data Lab
 Sep 29, 2026ISO 9283 Repeatability: How to Evaluate Cobot Positioning PerformanceISO 9283 cobot repeatability explained: learn how payload, reach, approach direction, and test conditions affect positioning performance and cell capability.Chen Wei (Automation Lead Engineer)
 Oct 04, 2026How Should You Compare 5-Axis CNC Machine Accuracy Claims?How do I compare 5-axis CNC machine accuracy claims? Learn how to assess standards, thermal stability, TCP accuracy, and real-world test evidence.Dr. Marcus Vance
 Oct 03, 2026Is Edge Computing Necessary for Real-Time Quality Inspection?Is industrial edge computing necessary for real-time quality inspection? Explore how latency, data volume, reliability, and control integration shape the right architecture.TSV Data Lab
 Oct 02, 2026What Documents Prove a Precision Machining Supplier Can Hold Tolerance?What documents prove a precision machining supplier can hold tolerance? Explore certificates, FAI reports, calibration, SPC, and traceability evidence to qualify suppliers with confidence.Dr. Marcus Vance
 Oct 01, 2026Can a Machining Supplier Meet Aerospace Fatigue Testing Requirements?Can a machining supplier meet aerospace fatigue testing requirements? Learn the traceability, process control, and test evidence needed for reliable aerospace parts.Dr. Marcus Vance
 Sep 30, 2026Which Industrial Robot Specifications Matter for High-Precision Assembly?Which industrial robot specifications matter most for high-precision assembly? Explore repeatability, accuracy, stiffness, vibration, calibration, and force control for reliable yields.Chen Wei (Automation Lead Engineer)
 Sep 29, 2026How Do You Verify Servo Motor Torque Under Continuous Load?How do I verify servo motor torque under continuous load? Learn RMS torque checks, torque-speed limits, thermal derating, and real-machine testing.Chen Wei (Automation Lead Engineer)
 Oct 02, 2026ZD330 Software Configuration: Verifying Cut-List Import Before PurchaseZD330 software and machine configuration: verify cut-list imports, data mapping, labels, and workflow before purchase to reduce errors and choose with confidence.Victor Lin (Chief Software Architect)
 Sep 28, 2026Spindle Runout Measurement in Germany: DIN Standards, Methods, and Acceptance LimitsSpindle runout measurement Germany: explore DIN standards, proven methods, acceptance limits, and audit-ready practices for reliable machining quality.Dr. Marcus Vance
 Sep 27, 2026How to Select Wall-Mount Edge Devices for Space-Constrained Factory NetworksWall mount edge devices for space-constrained factories: evaluate workload, thermal design, power resilience, cable access, and network reliability for smarter deployments.TSV Data Lab
 Sep 26, 2026Machining Tolerance Analysis: How to Set Limits That Meet Function and Cost TargetsMachining tolerance analysis: learn how to set functional limits, control tolerance stacks, reduce inspection risk, and balance precision with production cost.Dr. Marcus Vance
 Sep 25, 2026How to Evaluate an Industrial Infrastructure Data Platform for Multi-Site OperationsIndustrial infrastructure data platform evaluation guide for multi-site operations: compare data quality, edge resilience, interoperability, governance, and scalable proof-of-value criteria.Victor Lin (Chief Software Architect)