What a Servo Motor Torque Curve Reveals Under Repeated Peak Loads
Publication Date
author
Repeated peak loads reveal whether a servo system is genuinely robust or only looks good on a datasheet. In practice, a servo motor torque curve under repeated peak events helps engineers and buyers judge three things that steady-state specs often miss: how fast thermal stress accumulates, whether the duty cycle is realistic, and how the servo drive responds when acceleration spikes happen again and again. For teams evaluating smart factory automation solutions—from cobot for CNC machine tending to AMR for warehouse logistics—the real question is not just “Can this motor hit peak torque once?” but “Can it survive the real motion profile without overheating, derating, or shortening service life?”
What is the real search intent behind servo motor torque curve analysis under repeated peak loads?
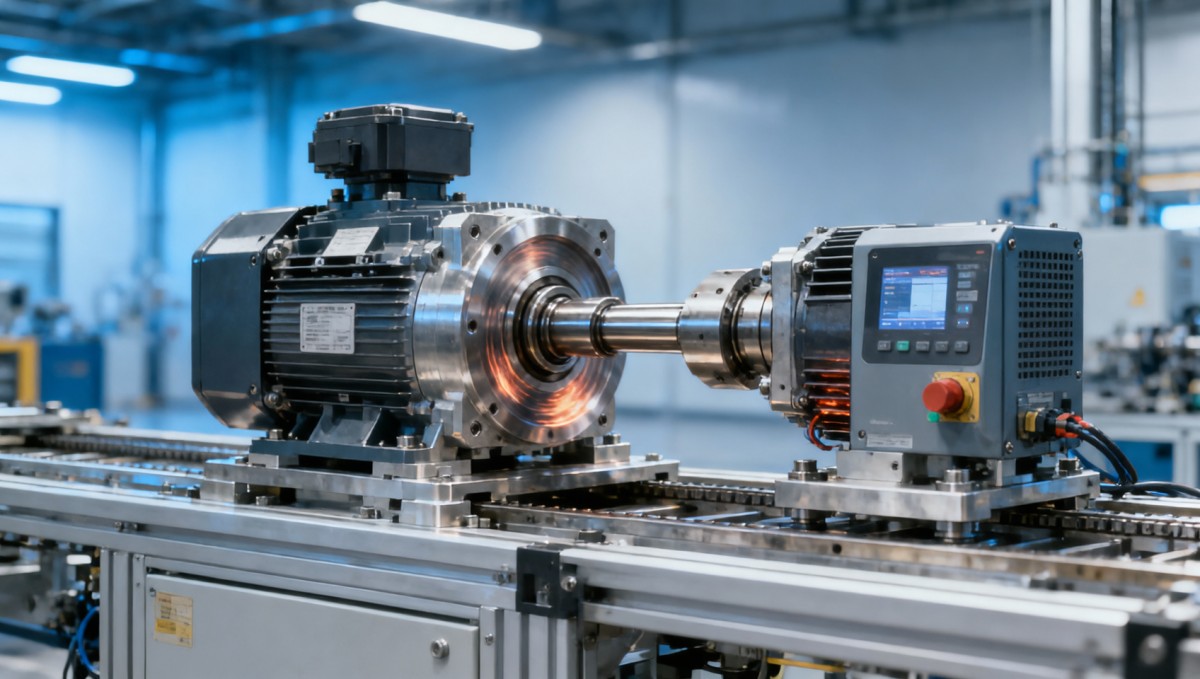
The core search intent here is practical evaluation, not theory alone. Readers searching this topic usually want to understand how to interpret a servo motor torque curve when the application repeatedly demands short bursts of high torque. They are often trying to answer one of the following:
- Will this servo motor remain reliable in cyclic, high-acceleration motion?
- How much does repeated peak torque reduce lifespan or increase failure risk?
- What does the torque curve reveal that rated torque and peak torque specs do not?
- How should I compare competing motors, drives, or automation platforms more accurately?
For information researchers, operators, procurement teams, and business decision-makers, the value is in translating a torque curve into a reliability judgment. A motor that looks strong on paper may still perform poorly if its thermal reserve is small, if the drive cannot recover fast enough between peaks, or if the actual duty cycle pushes it into continuous overheating.
The high-value takeaway is simple: under repeated peak loads, the torque curve becomes a risk map. It shows whether the servo system has enough margin for repetitive real-world operation, not just isolated lab conditions.
Why steady-state specifications often hide the real problem
Many servo motor comparisons still start with rated torque, peak torque, rated speed, and power. Those figures are useful, but they can be misleading when the application includes frequent starts, stops, reversals, or short-cycle overloads.
In real automation cells, motion is rarely smooth and constant. A cobot for CNC machine tending may repeatedly accelerate a part, stop precisely, reposition, and repeat hundreds or thousands of times per shift. An AMR for warehouse logistics may face changing payloads, ramp transitions, and repeated traction events. In both cases, repeated peak loads create cumulative stress that steady-state specs do not fully describe.
What gets hidden by average values?
- Thermal buildup over time: short bursts may be individually acceptable, but repeated too frequently they push winding temperature upward.
- Recovery time between load spikes: the system may not have enough off-time to cool down.
- Drive current handling limits: the motor may be capable, but the servo drive may clip current or derate under repetition.
- Mechanical fatigue: couplings, gearboxes, bearings, and load interfaces may see repeated stress far beyond what average torque suggests.
This is why advanced buyers and engineering teams should treat a servo motor torque curve as a dynamic operating envelope rather than a simple performance badge.
What a servo motor torque curve actually reveals in repeated peak-load scenarios
When interpreted correctly, the torque curve gives several actionable insights.
1. The difference between “can achieve” and “can sustain”
Most servo motors can produce torque above rated output for short periods. The important question is duration and repetition. If the torque curve shows a high peak region but the allowable time is extremely short, then frequent peak commands may create thermal overload quickly. That matters more than the headline peak number.
2. The speed range where overload is truly available
Peak torque is not always available uniformly across the speed range. In some systems, torque falls off sharply as speed rises. If your application demands repeated high torque at higher RPM, the useful overload margin may be much smaller than expected.
3. The thermal reserve of the motor design
A torque curve, especially when paired with thermal or duty-cycle data, indicates how much margin exists before insulation, magnets, or winding resistance become performance limits. A more conservative motor may appear less impressive in marketing terms but prove more reliable in repetitive duty.
4. How the servo drive shapes real output
The motor and drive must be evaluated together. A motor torque curve on its own does not guarantee delivered system performance. Under repeated peak loads, the drive’s current loop response, overload allowance, protection logic, and thermal model determine whether commanded torque is actually delivered consistently.
5. Whether the application is living in a safe intermittent zone or drifting into chronic overload
If the motion profile repeatedly enters the upper envelope of the torque curve without adequate cool-down time, the system may technically run but operate with accelerated wear, nuisance trips, or reduced repeatability.
How thermal buildup changes the meaning of peak torque
Thermal behavior is usually the hidden story behind repeated peak-load problems. Every burst of high current increases copper losses, and those losses generate heat. If the next burst comes before the previous heat dissipates, the temperature baseline rises cycle after cycle.
This means a servo system can pass a short demonstration and still fail in production. Common symptoms include:
- Gradual torque derating after extended operation
- Unexpected overtemperature alarms during busy periods
- Positioning instability as components heat up
- Reduced bearing and insulation life
- Higher maintenance frequency and lower MTBF
For buyers and decision-makers, this is crucial. A lower-cost system that frequently operates near repeated overload limits may create hidden costs in downtime, parts replacement, and process instability. In contrast, a servo sized with thermal margin may cost more upfront but reduce total lifecycle cost significantly.
When evaluating a supplier, ask:
- What is the thermal model behind the published overload rating?
- How long can peak torque be repeated at the expected cycle rate?
- Was the torque curve validated at the application’s ambient temperature?
- Does the curve reflect motor-only capability or full motor-plus-drive capability?
Why duty cycle matters more than one-time overload capability
Duty cycle is often the most practical lens for interpreting a servo motor torque curve. It defines how often the motor is loaded, for how long, and with what rest periods. Two applications can have the same peak torque requirement but radically different risk profiles because their duty cycles differ.
For example:
- Cobot for CNC machine tending: repetitive pick-load-place motions with frequent acceleration and deceleration, often predictable but relentless.
- AMR for warehouse logistics: highly variable duty with changing payloads, slopes, stop-start traffic, and uneven floor resistance.
In both cases, average torque may look acceptable while the effective thermal duty is not. This is why engineers should compare the real motion profile against the torque-time envelope, not just the maximum torque line item.
A useful rule: if peak torque appears repeatedly in normal operation rather than as a rare event, treat it as part of the application’s regular thermal load. Once that happens, the peak specification is no longer a comfort factor; it becomes a design constraint.
How servo drive response time affects repeated peak-load reliability
Servo drive response time is not just a control-performance issue. It also affects whether the motor experiences clean, controlled torque delivery or repeated stress spikes that increase heat and instability.
A fast, well-tuned drive can:
- Deliver current quickly enough to match acceleration demands
- Reduce overshoot and oscillation
- Shorten settling time
- Improve motion consistency across repeated cycles
A poorly matched or poorly tuned drive can do the opposite. It may cause torque ripple, current overshoot, unnecessary heating, or repeated correction actions that inflate the real load seen by the motor.
For operators and engineers, that means a torque curve should never be read in isolation from control behavior. For procurement and business leaders, it means “same motor class” does not equal “same system performance.” The drive algorithm, overload strategy, encoder feedback quality, and tuning support all influence whether repeated peaks remain manageable.
What engineers, buyers, and decision-makers should check before comparing suppliers
To make a data-first comparison, focus on evidence that links the servo motor torque curve to the actual workload. A useful evaluation checklist includes:
- Rated vs. peak torque with duration: not just the values, but how long and how often peak torque is allowed.
- Torque behavior across speed: especially if the application needs overload at higher RPM.
- Thermal derating conditions: ambient temperature, enclosure, airflow, altitude, and mounting conditions.
- Drive overload limits: current ceiling, repetition allowance, and protective trip logic.
- Duty-cycle validation: whether the supplier has matched the motor to your real motion profile.
- System-level fatigue implications: gearbox, couplings, bearings, and transmission components.
- Test data: repeated-cycle bench results, MTBF references, or long-duration application evidence.
This approach is especially important in smart factory automation solutions where line uptime, maintenance predictability, and consistent takt time directly affect ROI.
Application examples: what repeated peak loads look like in real automation
In CNC machine tending, a cobot may need sharp acceleration to maintain takt time while handling varying part weights and end-of-arm tooling. The servo system sees repeated bursts during each cycle. If the torque curve margin is too thin, the result may be rising motor temperature, slower recovery, or reduced precision by the end of the shift.
In warehouse AMRs, repeated peak loads often occur during startup under payload, ramp climbing, emergency avoidance maneuvers, or wheel resistance changes. Here, the torque curve must be evaluated with speed, battery voltage variation, and drive behavior in mind. A system that performs well in a controlled demo may struggle during continuous fleet operation.
These examples highlight the same lesson: repeated peak loads are not an exception in modern automation. In many systems, they are normal operating reality. That is exactly why torque curve interpretation should be tied to duty cycle, heat, and control response instead of marketing claims.
Final judgment: how to read torque curves without marketing noise
A servo motor torque curve under repeated peak loads reveals whether a motion system has real operating margin or only attractive headline specs. The most important insight is not the highest peak torque number. It is how the system behaves when those peaks happen repeatedly in production: whether heat accumulates, whether the duty cycle is supportable, and whether the drive can deliver and recover cleanly.
For engineers, this means matching the torque curve to the actual motion profile. For operators, it means watching for signs of thermal stress and unstable cycle performance. For procurement teams, it means demanding duration, repetition, and test-condition data instead of relying on brochure claims. For enterprise decision-makers, it means recognizing that robust servo sizing often protects uptime, maintenance cost, and production consistency far better than low upfront pricing.
In short, repeated peak loads turn the torque curve into a truth test. If you want to compare smart factory automation solutions rigorously, this is one of the clearest engineering tools available.
Search News
Hot Articles
- Carbon Fiber StructuresHow to Specify Aerospace Carbon Fiber Assemblies for Lightweight, Load-Bearing PartsJul 11, 2026
- Machine VisionXiaomi, Alibaba DAMO Academy Drive Open-Source Robotics Model Ecosystem, Lowering Algorithm Development Barriers for Overseas SMEs Adopting Chinese Robotics SolutionsMar 30, 2026
- Cobots & ArmsShanxi 'AI+' Conference Showcases Embodied Intelligence with Multinational Buyer Engagement: Key Industry ImplicationsMar 30, 2026
Popular Tags
Recommended News
 Jul 11, 2026How to Specify Aerospace Carbon Fiber Assemblies for Lightweight, Load-Bearing PartsAerospace carbon fiber assemblies: learn how to specify laminate design, load data, joining methods, and inspection controls for lighter, reliable load-bearing aerospace parts.Elena Rostova (UAV Systems Researcher)
 Mar 30, 2026Xiaomi, Alibaba DAMO Academy Drive Open-Source Robotics Model Ecosystem, Lowering Algorithm Development Barriers for Overseas SMEs Adopting Chinese Robotics SolutionsXiaomi & Alibaba DAMO Academy's open-source robotics models lower algorithm barriers for global SMEs. Boost efficiency in manufacturing, logistics & smart retail with ROS 2 compatible solutions.TSV Data Lab
 Mar 30, 2026Shanxi 'AI+' Conference Showcases Embodied Intelligence with Multinational Buyer Engagement: Key Industry ImplicationsShanxi 'AI+' Conference highlights embodied intelligence with Tesla, Ubtech & Jiantao showcasing multimodal robotics. 40+ global buyers validated tech on-site, creating new B2B channels for industrial automation & AI solutions.Chen Wei (Automation Lead Engineer)
 Mar 30, 2026Zhongguancun Unveils 6G Integrated Sensing-Computing-Intelligence Platform to Empower Embodied Robots for Global Industrial ApplicationsZhongguancun's new 6G platform revolutionizes industrial robotics with <10ms latency, empowering global automotive, logistics & port automation. Discover how this tech boosts China's smart manufacturing exports.TSV Data Lab
 Mar 30, 2026Mech-Mind Tianjin Embodied Intelligence R&D and Production Base Goes Live, Cutting Delivery Time by 20%–30% for Global Customized AMR+Vision SolutionsMech-Mind's Tianjin AMR+Vision production base cuts delivery time by 20%-30% for欧美 & Latin American markets. Discover how this PLd-certified facility accelerates customized robotics solutions for smart manufacturing and logistics.Chen Wei (Automation Lead Engineer)
 Mar 30, 2026Boao Forum Reveals 'Co-evolution of Big and Small Brains' Trend in Humanoid Robots, China's Embodied Intelligence Accelerates Adaptation to Overseas Manufacturing Service ScenariosDiscover how China's humanoid robots, featuring 'Co-evolution of Big and Small Brains,' are revolutionizing global manufacturing. Learn about Embodied Tian Gong 3.0's ISO compliance and overseas deployment at Boao Forum 2026.Chen Wei (Automation Lead Engineer)
 Mar 30, 2026China Railway Industrial Secures Patent for Embodied Robotics in Material Handling, Boosting High-Precision Delivery Capabilities for Overseas Infrastructure and Manufacturing ProjectsChina Railway Industrial's new patent for embodied robotics in material handling boosts high-precision delivery for global infrastructure & manufacturing. Discover how this innovation enhances logistics accuracy in automotive, rail transit & EPC projects.Chen Wei (Automation Lead Engineer)
 Oct 15, 2026R&D Cost Reduction Services: How to Evaluate Fees, Savings, and ROIEvaluate R&D cost reduction services with confidence. Compare fees, verify savings, and calculate ROI without compromising performance. Discover how to choose a provider that delivers real value.Chen Wei (Automation Lead Engineer)
 Oct 15, 2026How Should You Compare TechStat Vanguard 5-Axis CNC Tolerances?TechStat Vanguard 5-axis CNC tolerance comparison: learn how to verify part accuracy, assess inspection evidence, and choose suppliers that reliably meet your drawing requirements.Dr. Marcus Vance
 Oct 14, 2026Drone Frame Composites: Carbon Fiber vs. Fiberglass for Weight and StiffnessExplore drone structural materials composites: compare carbon fiber and fiberglass for weight, stiffness, cost, and antenna compatibility. Find the right material for your drone frame.Elena Rostova (UAV Systems Researcher)
 Oct 13, 2026Smart Cameras vs. PC-Based Machine Vision: Which Fits High-Speed Inspection?This industrial product comparison for machine vision weighs smart cameras vs. PC-based systems on latency, throughput, and cost. Discover your best fit for high-speed inspection.TSV Data Lab
 Oct 12, 2026How to Verify RoHS Compliance in Industrial Sensing Systems Before DeploymentRoHS compliant sensing systems: learn how to verify materials, supplier declarations, testing, and configuration controls before industrial deployment.TSV Data Lab
 Oct 11, 2026How Procurement-Oriented Content Taxonomy Improves B2B Buying JourneysProcurement-oriented content taxonomy streamlines B2B buying journeys with clearer evidence, supplier comparisons, risk visibility, and faster approvals.TSV Data Lab
 Oct 10, 2026How to Select a Machine Performance Monitoring Platform for OEE and Downtime ReductionMachine performance monitoring platform selection guide: validate machine states, OEE data, downtime reasons, integrations, and scalability to reduce losses with confidence.TSV Data Lab
 Oct 08, 2026How to Machine Inconel 625 Blades Without Heat Cracks or Edge ChippingInconel 625 blade machining guide: prevent heat cracks, edge chipping, chatter, and work hardening with proven tooling, cooling, fixturing, and inspection strategies.Dr. Marcus Vance
 Oct 07, 2026How to Evaluate an HMI Panel Distributor for Industrial Automation ProjectsHMI panel distributor evaluation guide: verify technical compatibility, traceability, supply reliability, lifecycle support, and total cost for automation projects.Victor Lin (Chief Software Architect)
 Oct 06, 2026Navigation Fault Tolerance Standards for AMRs: What Safety Teams Must VerifyNavigation fault tolerance standards: learn what AMR safety teams must verify, from localization loss and sensor faults to stopping distance, safe restart, and site-specific validation.Chen Wei (Automation Lead Engineer)
 Oct 05, 2026Calculating Edge Computing Total Cost of Ownership Across Distributed SitesEdge computing ownership cost explained: calculate deployment, energy, connectivity, security, remote support, and refresh costs across distributed sites.TSV Data Lab
 Oct 04, 2026CAD/CAM Benchmarking in the GCC: What Manufacturers Should Ask a ConsultantCAD CAM benchmark consultant GCC guide: learn the key questions manufacturers should ask to validate post-processors, workflows, machine performance, and production risk.Victor Lin (Chief Software Architect)
 Oct 03, 2026Selecting Automotive Radar Sensor Modules for ADAS Range, Resolution, and IntegrationAutomotive radar sensor module selection guide for ADAS: compare range, resolution, field of view, latency, and integration to build safer, reliable vehicle systems.TSV Data Lab
 Oct 02, 2026How to Qualify Machined Parts Suppliers for Hard Tech ProgramsHard tech supply chain machined parts demand rigorous supplier qualification. Learn how to assess capability, traceability, quality controls, and delivery resilience.Dr. Marcus Vance
 Oct 01, 2026How to Select an Outdoor Security Radar Sensor for Perimeter Detection?Outdoor security radar sensor selection guide: compare range, accuracy, false-alarm control, integration, and field testing for reliable perimeter detection.TSV Data Lab
 Sep 30, 2026How to Evaluate Solid-State LiDAR Hardware for Outdoor Autonomous VehiclesSolid state LiDAR hardware evaluation guide for outdoor autonomous vehicles—compare range, point-cloud quality, environmental resilience, integration, and safety.TSV Data Lab
 Sep 29, 2026ISO 9283 Repeatability: How to Evaluate Cobot Positioning PerformanceISO 9283 cobot repeatability explained: learn how payload, reach, approach direction, and test conditions affect positioning performance and cell capability.Chen Wei (Automation Lead Engineer)