How to compare drone motor thrust test data without mistakes
Publication Date
author
For after-sales maintenance teams, comparing drone motor thrust test data accurately is the difference between reliable troubleshooting and costly misjudgment. Small variations in voltage, propeller size, ambient temperature, or test setup can distort results and lead to wrong replacement or tuning decisions. This guide shows how to evaluate drone motor thrust test data with a disciplined, engineering-first method that reduces noise, improves consistency, and supports smarter maintenance actions.
When people search for guidance on drone motor thrust test data, the real need is rarely academic. They usually want to know whether two motors, two batches, or two test reports can be compared fairly, and whether an apparent performance drop is a true fault or just a testing artifact.
For after-sales maintenance staff, the biggest concerns are practical. Can this motor still meet service standards? Is the thrust loss caused by the motor, the ESC, the propeller, or the battery? Can a customer complaint be confirmed with evidence? Those questions matter more than generic theory.
The most useful approach is to standardize the comparison method before interpreting results. That means checking the test conditions, normalizing the data, identifying hidden variables, and only then deciding whether the motor should be repaired, retuned, or replaced.
Why thrust test comparisons go wrong so often in maintenance work
The most common mistake is comparing numbers that were produced under different conditions. A thrust value by itself means very little unless you also know the voltage, current, propeller model, air density, mounting method, and measurement equipment used.
Another frequent error is focusing on peak thrust alone. In real maintenance work, peak thrust is only one signal. Efficiency, current draw, vibration behavior, temperature rise, and thrust consistency across the throttle range often reveal more about motor health.
Data quality also suffers when teams use mixed test records from suppliers, internal benches, and field technicians without a common template. If one report uses fully charged batteries and another uses bench power, the results are not directly comparable.
Even small mechanical differences can mislead a diagnosis. Bent shafts, worn bearings, loose propeller hubs, damaged magnets, or slight imbalance may reduce measured thrust, yet the underlying issue may not be the winding itself.
Start with the question: what exactly are you trying to compare?
Before reviewing any dataset, define the comparison target clearly. In after-sales service, the comparison usually falls into one of four categories: motor-to-motor, same motor over time, tested result against factory baseline, or field result against controlled bench result.
Each category requires a different interpretation. Comparing two new motors from different suppliers is a sourcing and compatibility task. Comparing one serviced motor before and after repair is a maintenance verification task. Comparing a customer-returned unit against baseline data is a fault isolation task.
If the objective is unclear, teams often draw the wrong conclusion from valid numbers. A motor that looks weaker than a factory sample may still be acceptable if the service threshold allows a certain deviation under realistic operating conditions.
Clear purpose improves decision speed. It tells the technician which parameters matter most, what tolerance band is acceptable, and whether the final judgment should prioritize absolute thrust, repeatability, electrical efficiency, or thermal stability.
Always verify the test conditions before reading the thrust numbers
Accurate comparison begins with condition matching. At minimum, every thrust test record should include motor model, KV rating, propeller size and pitch, ESC model and firmware, input voltage, current, ambient temperature, humidity, altitude, and test instrument model.
Voltage is one of the biggest distortion factors in drone motor thrust test data. A motor tested at a slightly higher voltage can appear significantly better, especially near upper throttle ranges. Comparing thrust without matching voltage is one of the fastest ways to misdiagnose performance.
Propeller specification must also match exactly. Diameter, pitch, blade count, blade profile, material stiffness, and wear condition all affect load. Two tests using “the same size” propeller may still produce different thrust if the propeller brand or stiffness differs.
Air density changes matter more than many field teams expect. Temperature, humidity, and altitude influence thrust generation. If one motor is tested in a hot, high-altitude environment and another in a cool sea-level workshop, lower thrust does not automatically indicate motor degradation.
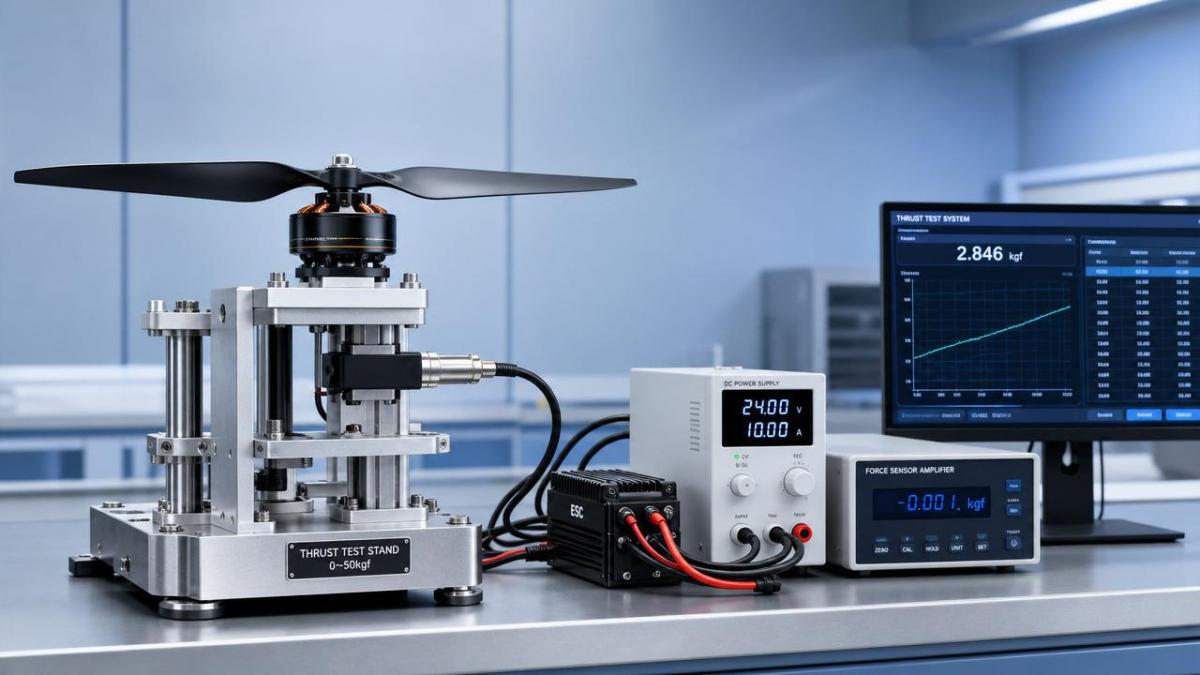
The test bench itself can introduce bias. Load cell calibration, fixture rigidity, sensor sampling rate, and vibration isolation all influence the result. A poorly mounted test rig may underreport thrust or generate unstable readings that look like motor inconsistency.
Normalize data before deciding whether a motor is weak
If the raw conditions are not perfectly matched, normalization is the next step. The goal is not to force unlike data into false equality, but to reduce obvious external distortions before making a maintenance decision.
A practical first method is to compare thrust at matched voltage and matched throttle points, such as 50%, 70%, and 100%. This provides a better profile than comparing only the highest recorded thrust value from separate tests.
Another useful method is thrust-to-current comparison. If two motors produce similar thrust but one draws much higher current, the weaker electrical efficiency may indicate winding damage, bearing drag, magnet weakness, or increased friction in the drivetrain.
Thrust-per-watt is especially useful for after-sales teams dealing with suspected hidden damage. A motor that still reaches acceptable peak thrust but does so with unusually high power consumption may pass a superficial check while failing in real flight endurance.
Where possible, compare percentage deviation from a known baseline instead of only absolute values. A serviced motor operating within a defined percentage band of the factory benchmark is easier to judge than a motor evaluated against isolated raw numbers.
Look at the full performance curve, not just the top-end figure
Healthy motors usually show a smooth relationship between throttle input, current rise, and thrust output. If the curve has irregular steps, unusual plateaus, or unstable high-throttle behavior, the issue may involve commutation, ESC timing, bearing resistance, or vibration.
Mid-throttle data is often more valuable than maximum-throttle data in actual service cases. Many commercial drones spend more time in partial-thrust operation than at full output. A motor with acceptable peak thrust but poor mid-range efficiency can still cause flight instability or reduced mission time.
Temperature trend is another critical layer. If two motors produce similar thrust initially but one heats much faster during repeated runs, that motor may have internal losses that will worsen under prolonged field use.
Repeated-run consistency should not be ignored. A motor that delivers good numbers once but drifts quickly over three to five repeated tests may have intermittent mechanical or electrical issues that a single data point cannot reveal.
Separate motor faults from system-level causes
In after-sales maintenance, not every thrust problem is a motor problem. ESC calibration, battery sag, connector resistance, propeller damage, frame resonance, and firmware settings can all distort thrust test outcomes.
A common trap is replacing the motor when the actual issue is upstream power delivery. If battery internal resistance is high, voltage droop under load can reduce measured thrust and make a good motor appear defective. Bench power testing can help isolate this variable.
ESC timing and firmware behavior also matter. Different ESC settings may change current response, smoothness, and motor heating. When comparing drone motor thrust test data across service cases, always document whether ESC parameters were controlled or varied.
Mechanical installation can further influence results. Over-tightened mounts, misaligned shafts, or contact between rotating parts and wiring may create drag. In these cases, low thrust data reflects installation error rather than true motor failure.
Build a repeatable comparison checklist for service teams
The best way to reduce mistakes is to use a standard checklist every time. After-sales teams should verify five layers before interpreting results: test setup, electrical input, propeller condition, environmental conditions, and benchmark source.
A useful checklist starts with calibration status. Confirm load cell calibration date, tachometer accuracy, and current measurement reliability. Then confirm power source type, battery state of charge, wire gauge, and connector integrity.
Next, document the rotor hardware. Record propeller brand, dimensions, wear state, torque setting, and any visible imbalance. Then log environmental factors such as room temperature, pressure, and altitude if available.
Finally, confirm the comparison baseline. Is the reference data from the original manufacturer, internal lab validation, or a third-party source? If the source is unclear or methodologically weak, the comparison may still be misleading even with careful testing.
Teams that use a structured template can detect patterns faster. They can also defend maintenance decisions more confidently when customers challenge a replacement recommendation or when internal quality teams request evidence.
How to judge whether the difference is meaningful or just noise
Not every deviation requires action. Maintenance teams need acceptance bands based on service reality, not perfection. Small thrust differences may come from normal production tolerance, sensor noise, or minor environmental variation rather than actionable defects.
A meaningful difference usually appears in combination with other signals. For example, lower thrust plus higher current plus rising temperature is much more convincing than lower thrust alone. Multi-parameter agreement strengthens fault confidence.
Trend direction matters more than a single isolated gap. If repeated tests show a consistent decline against baseline, the case for degradation becomes stronger. If results scatter randomly, the first suspect should be the test method rather than the motor.
Where possible, define red, yellow, and green thresholds. Green means within expected tolerance. Yellow means monitor or retest under stricter controls. Red means likely service action, such as repair, replacement, or deeper root-cause analysis.
What good documentation looks like in real after-sales operations
Strong documentation turns thrust testing from a rough screening tool into a traceable engineering process. Every report should link the motor serial or batch, service history, customer complaint, test configuration, raw data, and final decision.
Include both raw readings and interpreted conclusions. Raw data preserves traceability. Interpretation explains why a technician recommended continued use, recalibration, part replacement, or escalation to engineering support.
Photographic records are also valuable. A simple image of the test setup, propeller used, and motor condition can prevent later confusion. In cross-site service operations, visuals help ensure that different teams are actually testing under comparable conditions.
If your organization handles recurring fleet maintenance, store historical drone motor thrust test data in a searchable database. Over time, this reveals normal aging patterns, batch variation, and failure signatures that are hard to detect in isolated cases.
Conclusion: compare methods first, numbers second
The safest way to compare drone motor thrust test data without mistakes is to treat every number as conditional evidence, not instant truth. For after-sales maintenance teams, the right process begins with matched test conditions, normalized data, and multi-parameter analysis.
Do not judge a motor by peak thrust alone. Check voltage, propeller, environment, current draw, efficiency, repeatability, and thermal behavior. Separate true motor faults from ESC, battery, installation, and measurement issues before making a service decision.
In practice, the teams that make the fewest mistakes are not the ones with the most data, but the ones with the most disciplined comparison method. When your evaluation process is controlled, drone motor thrust test data becomes a reliable maintenance tool rather than a source of confusion.
Search News
Hot Articles
- Carbon Fiber StructuresHow to Specify Aerospace Carbon Fiber Assemblies for Lightweight, Load-Bearing PartsJul 11, 2026
- Machine VisionXiaomi, Alibaba DAMO Academy Drive Open-Source Robotics Model Ecosystem, Lowering Algorithm Development Barriers for Overseas SMEs Adopting Chinese Robotics SolutionsMar 30, 2026
- Cobots & ArmsShanxi 'AI+' Conference Showcases Embodied Intelligence with Multinational Buyer Engagement: Key Industry ImplicationsMar 30, 2026
Popular Tags
Recommended News
 Jul 11, 2026How to Specify Aerospace Carbon Fiber Assemblies for Lightweight, Load-Bearing PartsAerospace carbon fiber assemblies: learn how to specify laminate design, load data, joining methods, and inspection controls for lighter, reliable load-bearing aerospace parts.Elena Rostova (UAV Systems Researcher)
 Mar 30, 2026Xiaomi, Alibaba DAMO Academy Drive Open-Source Robotics Model Ecosystem, Lowering Algorithm Development Barriers for Overseas SMEs Adopting Chinese Robotics SolutionsXiaomi & Alibaba DAMO Academy's open-source robotics models lower algorithm barriers for global SMEs. Boost efficiency in manufacturing, logistics & smart retail with ROS 2 compatible solutions.TSV Data Lab
 Mar 30, 2026Shanxi 'AI+' Conference Showcases Embodied Intelligence with Multinational Buyer Engagement: Key Industry ImplicationsShanxi 'AI+' Conference highlights embodied intelligence with Tesla, Ubtech & Jiantao showcasing multimodal robotics. 40+ global buyers validated tech on-site, creating new B2B channels for industrial automation & AI solutions.Chen Wei (Automation Lead Engineer)
 Mar 30, 2026Zhongguancun Unveils 6G Integrated Sensing-Computing-Intelligence Platform to Empower Embodied Robots for Global Industrial ApplicationsZhongguancun's new 6G platform revolutionizes industrial robotics with <10ms latency, empowering global automotive, logistics & port automation. Discover how this tech boosts China's smart manufacturing exports.TSV Data Lab
 Mar 30, 2026Mech-Mind Tianjin Embodied Intelligence R&D and Production Base Goes Live, Cutting Delivery Time by 20%–30% for Global Customized AMR+Vision SolutionsMech-Mind's Tianjin AMR+Vision production base cuts delivery time by 20%-30% for欧美 & Latin American markets. Discover how this PLd-certified facility accelerates customized robotics solutions for smart manufacturing and logistics.Chen Wei (Automation Lead Engineer)
 Mar 30, 2026Boao Forum Reveals 'Co-evolution of Big and Small Brains' Trend in Humanoid Robots, China's Embodied Intelligence Accelerates Adaptation to Overseas Manufacturing Service ScenariosDiscover how China's humanoid robots, featuring 'Co-evolution of Big and Small Brains,' are revolutionizing global manufacturing. Learn about Embodied Tian Gong 3.0's ISO compliance and overseas deployment at Boao Forum 2026.Chen Wei (Automation Lead Engineer)
 Mar 30, 2026China Railway Industrial Secures Patent for Embodied Robotics in Material Handling, Boosting High-Precision Delivery Capabilities for Overseas Infrastructure and Manufacturing ProjectsChina Railway Industrial's new patent for embodied robotics in material handling boosts high-precision delivery for global infrastructure & manufacturing. Discover how this innovation enhances logistics accuracy in automotive, rail transit & EPC projects.Chen Wei (Automation Lead Engineer)
 Oct 03, 2026Selecting Automotive Radar Sensor Modules for ADAS Range, Resolution, and IntegrationAutomotive radar sensor module selection guide for ADAS: compare range, resolution, field of view, latency, and integration to build safer, reliable vehicle systems.TSV Data Lab
 Oct 02, 2026How to Qualify Machined Parts Suppliers for Hard Tech ProgramsHard tech supply chain machined parts demand rigorous supplier qualification. Learn how to assess capability, traceability, quality controls, and delivery resilience.Dr. Marcus Vance
 Oct 01, 2026How to Select an Outdoor Security Radar Sensor for Perimeter Detection?Outdoor security radar sensor selection guide: compare range, accuracy, false-alarm control, integration, and field testing for reliable perimeter detection.TSV Data Lab
 Sep 30, 2026How to Evaluate Solid-State LiDAR Hardware for Outdoor Autonomous VehiclesSolid state LiDAR hardware evaluation guide for outdoor autonomous vehicles—compare range, point-cloud quality, environmental resilience, integration, and safety.TSV Data Lab
 Sep 29, 2026ISO 9283 Repeatability: How to Evaluate Cobot Positioning PerformanceISO 9283 cobot repeatability explained: learn how payload, reach, approach direction, and test conditions affect positioning performance and cell capability.Chen Wei (Automation Lead Engineer)
 Oct 03, 2026Is Edge Computing Necessary for Real-Time Quality Inspection?Is industrial edge computing necessary for real-time quality inspection? Explore how latency, data volume, reliability, and control integration shape the right architecture.TSV Data Lab
 Oct 02, 2026What Documents Prove a Precision Machining Supplier Can Hold Tolerance?What documents prove a precision machining supplier can hold tolerance? Explore certificates, FAI reports, calibration, SPC, and traceability evidence to qualify suppliers with confidence.Dr. Marcus Vance
 Oct 01, 2026Can a Machining Supplier Meet Aerospace Fatigue Testing Requirements?Can a machining supplier meet aerospace fatigue testing requirements? Learn the traceability, process control, and test evidence needed for reliable aerospace parts.Dr. Marcus Vance
 Sep 30, 2026Which Industrial Robot Specifications Matter for High-Precision Assembly?Which industrial robot specifications matter most for high-precision assembly? Explore repeatability, accuracy, stiffness, vibration, calibration, and force control for reliable yields.Chen Wei (Automation Lead Engineer)
 Sep 29, 2026How Do You Verify Servo Motor Torque Under Continuous Load?How do I verify servo motor torque under continuous load? Learn RMS torque checks, torque-speed limits, thermal derating, and real-machine testing.Chen Wei (Automation Lead Engineer)
 Oct 02, 2026ZD330 Software Configuration: Verifying Cut-List Import Before PurchaseZD330 software and machine configuration: verify cut-list imports, data mapping, labels, and workflow before purchase to reduce errors and choose with confidence.Victor Lin (Chief Software Architect)
 Sep 28, 2026Spindle Runout Measurement in Germany: DIN Standards, Methods, and Acceptance LimitsSpindle runout measurement Germany: explore DIN standards, proven methods, acceptance limits, and audit-ready practices for reliable machining quality.Dr. Marcus Vance
 Sep 27, 2026How to Select Wall-Mount Edge Devices for Space-Constrained Factory NetworksWall mount edge devices for space-constrained factories: evaluate workload, thermal design, power resilience, cable access, and network reliability for smarter deployments.TSV Data Lab
 Sep 26, 2026Machining Tolerance Analysis: How to Set Limits That Meet Function and Cost TargetsMachining tolerance analysis: learn how to set functional limits, control tolerance stacks, reduce inspection risk, and balance precision with production cost.Dr. Marcus Vance
 Sep 25, 2026How to Evaluate an Industrial Infrastructure Data Platform for Multi-Site OperationsIndustrial infrastructure data platform evaluation guide for multi-site operations: compare data quality, edge resilience, interoperability, governance, and scalable proof-of-value criteria.Victor Lin (Chief Software Architect)
 Sep 24, 2026How to Select Machine Vision Optics for Accurate Inspection at Different Working DistancesMachine vision optics selection guide for accurate inspection at every working distance. Compare FOV, pixel scale, DOF, distortion, lighting, and telecentric options.TSV Data Lab
 Sep 23, 2026How to Evaluate a Machine Vision System Integrator for High-Speed Inspection LinesChoose a machine vision system integrator with proven expertise in high-speed inspection, reliable reject timing, robust optics, and measurable acceptance criteria.TSV Data Lab