Drone Motor Thrust Test Data Can Be Right and Still Useless
Publication Date
author
Drone motor thrust test data can look precise on paper yet fail in real procurement and flight decisions when context is missing. For engineers, operators, buyers, and executives comparing drone motor thrust test data, drone propeller thrust efficiency, uav center of gravity calculation, and drone payload capacity vs flight time, the real question is not whether the numbers are correct, but whether they are decision-useful under actual operating conditions.
Why Correct Drone Motor Thrust Test Data Still Fails in Real Decisions
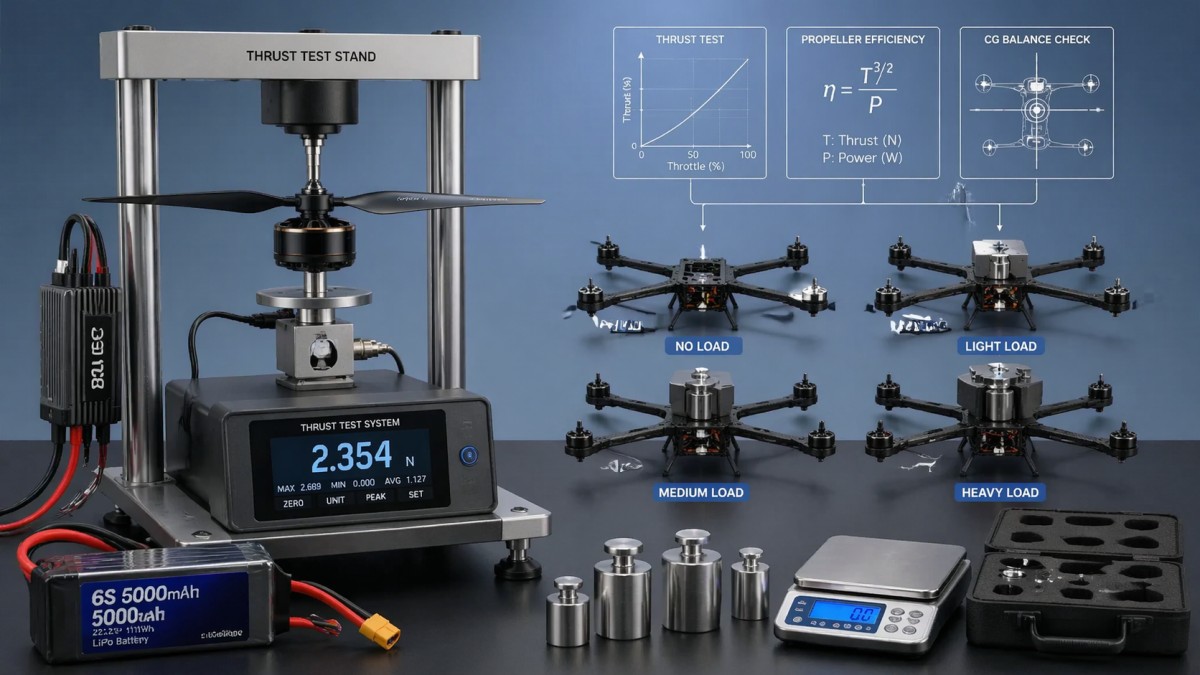
In UAV sourcing and flight system evaluation, a thrust chart often becomes the first filter. It looks objective: voltage, current, RPM, thrust, efficiency. But many teams discover later that technically correct drone motor thrust test data did not predict field behavior. The reason is simple. A bench number usually captures one controlled state, while real aircraft performance depends on 3 linked systems: propulsion, airframe balance, and mission profile.
This matters across the full buying chain. Information researchers want comparable data. Operators care about heat, stability, and recovery margin. Procurement teams need a shortlist that survives supplier claims. Executives want to know whether a motor-prop combination supports business outcomes over a 12–24 month deployment cycle. If the test method hides ambient temperature, battery sag, propeller type, or ESC tuning, the data may be accurate yet still useless for selection.
A common mistake is treating static thrust as a final answer. Static bench tests are valuable, but they do not capture forward flight unloading, vibration amplification, or payload-induced center-of-gravity drift. When teams compare drone payload capacity vs flight time, the gap between lab values and mission values often appears in the last 15%–25% of usable battery, where stability margins become more important than headline thrust.
At TechStat Vanguard, the goal is not to reject test data. The goal is to restore engineering context. Parameters do not lie, but incomplete parameters mislead. For UAV and aerospace metrics, useful benchmarking means tying propulsion data to tolerances, environmental conditions, component interaction, and decision thresholds that can guide specification sheets and supplier qualification.
What Usually Goes Missing from a “Good” Test Sheet
Most bench reports omit at least 4 high-impact variables: propeller geometry, battery internal resistance, ESC timing or firmware behavior, and test environment. A motor tested at 25°C with a fresh pack may look very different at 10°C after repeated climb cycles. If your procurement comparison ignores these conditions, you are not comparing motors. You are comparing isolated snapshots.
- Static thrust without propeller details can distort drone propeller thrust efficiency judgments.
- Current draw without battery voltage under load hides real endurance risk.
- Thrust peaks without thermal duration say little about continuous operation for 8–20 minute missions.
- Motor data without uav center of gravity calculation cannot predict flight controller workload or stability reserve.
Which Parameters Actually Make Drone Motor Thrust Test Data Decision-Useful?
Decision-useful data is data that can survive translation from lab to mission planning. For UAV teams, that means combining propulsion figures with mission constraints. Instead of asking only “How much thrust does this motor make?”, ask 3 deeper questions: At what voltage under load? For how long before thermal degradation? With what propeller and all-up weight? These questions turn a raw figure into a procurement tool.
A practical review framework should include at least 6 items: static thrust, thrust-to-current efficiency, steady-state temperature rise, transient response, vibration behavior, and center-of-gravity sensitivity. That is especially important in mapping drones, agricultural UAVs, and inspection platforms, where payload variation can shift system behavior more than catalog specifications suggest.
The table below shows how teams should reinterpret common test metrics. It is not a universal standard, but it is a realistic engineering lens for comparing drone motor thrust test data across suppliers and use cases.
The key lesson is that no single value should dominate your decision. A motor with slightly lower peak thrust can be the better choice if it delivers a stronger efficiency band between 40% and 70% throttle, where many commercial UAV missions spend most of their flight time. That is where benchmark interpretation becomes more valuable than headline numbers.
How UAV Center of Gravity Calculation Changes the Meaning of Thrust Data
Many teams compare motor data without checking how payload placement alters control authority. Yet uav center of gravity calculation can completely change whether thrust is usable. A front-heavy aircraft may still hover, but it can require higher continuous compensation from the flight controller and front motors. That increases thermal imbalance, accelerates battery depletion, and reduces safe handling in gusts or during descent.
For practical evaluation, do not stop at total thrust-to-weight ratio. Also review longitudinal and lateral balance under 2–3 representative payload states: empty, nominal mission load, and maximum planned payload. This is often more important than a small difference in bench thrust because poor balance can consume the performance margin you thought you had purchased.
How to Compare Suppliers Without Being Misled by Similar-Looking Numbers
Procurement teams frequently receive motor data sheets that look comparable but are not tested on the same basis. One supplier may report thrust with a larger, slow-turning propeller. Another may prioritize a shorter burst window. A third may publish data at nominal voltage rather than voltage under load. On paper, all three can appear valid. In practice, they describe different operating realities.
To build a useful comparison, create a normalized review model. Start with a fixed mission class, then compare only within that class. For example, inspection quadcopters carrying light sensors should not use the same weighting logic as agricultural platforms with high fluid payload variation. A wrong comparison model leads to a wrong shortlist even before supplier negotiation starts.
The next table offers a field-oriented comparison approach for buyers, researchers, and technical managers. It combines parameter review, scenario relevance, and decision risk, which is closer to how TSV evaluates engineering truth in hard-tech supply chains.
This comparison method helps reduce supplier qualification noise. If two motors differ by only a narrow efficiency margin, but one supplier provides 4-step traceable test conditions and the other does not, the decision is not only about performance. It is also about risk, reproducibility, and the cost of wrong assumptions in deployment.
A Simple 5-Point Procurement Checklist
- Confirm whether the drone motor thrust test data was generated with the same propeller family you plan to use.
- Ask for loaded voltage and current, not only nominal battery labels such as 6S or 12S.
- Review continuous load behavior over at least one mission-relevant interval, often 5–10 minutes.
- Check whether uav center of gravity calculation is included for your payload range and mounting layout.
- Compare drone payload capacity vs flight time using reserve energy policy, not ideal lab discharge.
These 5 checks are usually enough to expose whether a “strong” specification sheet can support actual fleet planning. For many B2B buyers, this saves more time than asking for additional marketing presentations because it quickly reveals which suppliers understand integrated system performance.
How Operators and Engineers Should Read Drone Payload Capacity vs Flight Time
Payload claims often fail for the same reason thrust claims fail: they are presented without mission assumptions. An aircraft may lift a payload for a short hover test, yet still be unsuitable for mapping, spraying, inspection, or logistics. The useful question is not the maximum payload in one moment. It is the payload that preserves control, endurance, thermal margin, and acceptable battery aging over repeated cycles.
For example, if a platform is specified for a 20-minute nominal flight, operators should ask whether that estimate assumes calm weather, fresh batteries, and reserve-to-land thresholds. In real work, teams often plan around a safer operational window such as 60%–80% of the brochure figure, especially when winds, altitude, or repeated climbs are expected. That planning discipline makes drone payload capacity vs flight time analysis useful instead of aspirational.
Engineers should also separate three payload states: advertised maximum lift, recommended operational payload, and efficient payload band. The last category is often missing, but it is the most valuable for cost control. If a UAV spends most missions in the efficient payload band, battery wear, motor heat, and maintenance interruptions usually become easier to predict.
This is where cross-functional review matters. Operators see recoverability. Engineers see control reserve. Procurement sees life-cycle cost. Executives see uptime and project continuity. A single thrust table cannot answer all of that, but a well-structured benchmark can connect them into one decision framework.
Scenario-Based Interpretation
Mapping and Survey UAVs
These platforms often prioritize consistent efficiency over extreme thrust. A motor-prop setup that performs best in the 45%–65% throttle region may be more valuable than one with a higher absolute thrust ceiling. Stable current draw, low vibration, and repeatable center-of-gravity behavior are usually more important than peak lift figures.
Agricultural and Heavy-Lift UAVs
For these systems, payload changes during operation can be large and continuous. That makes thermal data and balance sensitivity essential. A motor that looks efficient at takeoff may become less useful as liquid loads shift or as mission segments demand repeated acceleration. Here, drone motor thrust test data should be reviewed together with dynamic payload reduction curves and duty-cycle assumptions.
Inspection and Utility Operations
Inspection teams often fly near structures, in gusts, or under stop-and-go maneuvering. They need response predictability, not only efficiency. In these cases, thrust reserve and transient control response can be more valuable than a small gain in hover endurance. Procurement that ignores this tradeoff may buy a technically efficient but operationally frustrating setup.
Common Misconceptions, Risk Signals, and What to Ask Before You Buy
One of the most persistent misconceptions is that more thrust automatically means more safety. In reality, safety comes from usable margin under expected conditions. If extra thrust is achieved through high current draw, aggressive propeller loading, or short-duration thermal stress, the result may be a narrower safe operating envelope, not a wider one. That is why procurement should read beyond the top line of the chart.
Another misconception is that efficiency measured at one point predicts full mission behavior. It does not. Drone propeller thrust efficiency changes across throttle position, air density, payload state, and propeller wear. A decision based on one attractive operating point can miss the reality of daily use across 20–50 flight cycles per week in professional fleets.
The third misconception is that center of gravity can be corrected later by tuning. Software tuning helps, but it does not remove physical imbalance. Poor uav center of gravity calculation increases controller effort and can mask hardware mismatch until field conditions become harder. By then, the cost is no longer a specification issue. It becomes an operational issue.
A better approach is disciplined questioning before supplier approval. Ask for repeatability, not just a result. Ask for system context, not only component data. Ask for mission-matched performance, not generic promotion. These questions align with TSV’s hard-tech benchmarking principle: engineering truth starts where marketing simplification stops.
FAQ for Researchers, Buyers, and Decision-Makers
How should I compare drone motor thrust test data from different suppliers?
Normalize the comparison first. Match voltage under load, propeller specification, ESC setup, ambient condition, and test duration. Then compare efficiency in the expected operating band, often mid-throttle rather than only full throttle. If one supplier cannot provide these conditions, the comparison remains incomplete even if the data appears precise.
What is the biggest mistake in drone payload capacity vs flight time evaluation?
The biggest mistake is using maximum payload and maximum flight time as if they can occur together. In most practical cases, they cannot. Teams should define at least 3 mission states: light load, nominal load, and heavy load. Then estimate endurance with a safety reserve and realistic battery behavior, not only ideal discharge assumptions.
Why does drone propeller thrust efficiency matter as much as motor thrust?
Because the motor does not generate useful aircraft performance alone. The propulsion result comes from motor, propeller, ESC, battery, and frame interaction. A strong motor with a poor propeller match can waste power, increase noise, and raise heat. In many cases, the propeller choice changes mission endurance more than a small change in motor peak thrust.
When should uav center of gravity calculation be included in sourcing?
It should be included before final supplier selection whenever payloads are movable, swappable, or mounted away from the geometric center. That includes camera gimbals, LiDAR, sprayers, multispectral systems, and delivery bays. If the aircraft has more than 2 payload configurations, center-of-gravity review should be part of the pre-purchase engineering checklist, not a later correction.
Why Work With a Data-Driven Benchmarking Partner
Hard-tech procurement is increasingly shaped by noise: inflated claims, incomplete parameters, and isolated test snapshots. That environment slows R&D, complicates supplier qualification, and increases the cost of wrong decisions. TechStat Vanguard addresses that problem by acting as a commercial filter for engineering teams and procurement leaders who need usable facts instead of broad claims.
For UAV and aerospace metrics, that means looking beyond a single thrust chart. TSV focuses on performance benchmarking, specification relevance, and traceable technical interpretation. We help teams connect drone motor thrust test data to drone propeller thrust efficiency, uav center of gravity calculation, and drone payload capacity vs flight time so procurement decisions reflect mission reality rather than isolated lab values.
If you are screening suppliers, refining a spec sheet, or validating whether a propulsion dataset is suitable for commercial deployment, the most productive next step is a structured technical review. That review can cover parameter confirmation, operating assumptions, payload state analysis, delivery-cycle implications, and compatibility risks before purchase orders or validation builds begin.
Contact TSV if you need support with motor and propeller parameter confirmation, supplier comparison logic, payload-to-endurance evaluation, test method review, certification-related documentation alignment, sample assessment planning, or quotation-stage technical clarification. In a market full of polished claims, better decisions start with harder data and clearer context.
Search News
Hot Articles
- Carbon Fiber StructuresHow to Specify Aerospace Carbon Fiber Assemblies for Lightweight, Load-Bearing PartsJul 11, 2026
- Machine VisionXiaomi, Alibaba DAMO Academy Drive Open-Source Robotics Model Ecosystem, Lowering Algorithm Development Barriers for Overseas SMEs Adopting Chinese Robotics SolutionsMar 30, 2026
- Cobots & ArmsShanxi 'AI+' Conference Showcases Embodied Intelligence with Multinational Buyer Engagement: Key Industry ImplicationsMar 30, 2026
Popular Tags
Recommended News
 Jul 11, 2026How to Specify Aerospace Carbon Fiber Assemblies for Lightweight, Load-Bearing PartsAerospace carbon fiber assemblies: learn how to specify laminate design, load data, joining methods, and inspection controls for lighter, reliable load-bearing aerospace parts.Elena Rostova (UAV Systems Researcher)
 Mar 30, 2026Xiaomi, Alibaba DAMO Academy Drive Open-Source Robotics Model Ecosystem, Lowering Algorithm Development Barriers for Overseas SMEs Adopting Chinese Robotics SolutionsXiaomi & Alibaba DAMO Academy's open-source robotics models lower algorithm barriers for global SMEs. Boost efficiency in manufacturing, logistics & smart retail with ROS 2 compatible solutions.TSV Data Lab
 Mar 30, 2026Shanxi 'AI+' Conference Showcases Embodied Intelligence with Multinational Buyer Engagement: Key Industry ImplicationsShanxi 'AI+' Conference highlights embodied intelligence with Tesla, Ubtech & Jiantao showcasing multimodal robotics. 40+ global buyers validated tech on-site, creating new B2B channels for industrial automation & AI solutions.Chen Wei (Automation Lead Engineer)
 Mar 30, 2026Zhongguancun Unveils 6G Integrated Sensing-Computing-Intelligence Platform to Empower Embodied Robots for Global Industrial ApplicationsZhongguancun's new 6G platform revolutionizes industrial robotics with <10ms latency, empowering global automotive, logistics & port automation. Discover how this tech boosts China's smart manufacturing exports.TSV Data Lab
 Mar 30, 2026Mech-Mind Tianjin Embodied Intelligence R&D and Production Base Goes Live, Cutting Delivery Time by 20%–30% for Global Customized AMR+Vision SolutionsMech-Mind's Tianjin AMR+Vision production base cuts delivery time by 20%-30% for欧美 & Latin American markets. Discover how this PLd-certified facility accelerates customized robotics solutions for smart manufacturing and logistics.Chen Wei (Automation Lead Engineer)
 Mar 30, 2026Boao Forum Reveals 'Co-evolution of Big and Small Brains' Trend in Humanoid Robots, China's Embodied Intelligence Accelerates Adaptation to Overseas Manufacturing Service ScenariosDiscover how China's humanoid robots, featuring 'Co-evolution of Big and Small Brains,' are revolutionizing global manufacturing. Learn about Embodied Tian Gong 3.0's ISO compliance and overseas deployment at Boao Forum 2026.Chen Wei (Automation Lead Engineer)
 Mar 30, 2026China Railway Industrial Secures Patent for Embodied Robotics in Material Handling, Boosting High-Precision Delivery Capabilities for Overseas Infrastructure and Manufacturing ProjectsChina Railway Industrial's new patent for embodied robotics in material handling boosts high-precision delivery for global infrastructure & manufacturing. Discover how this innovation enhances logistics accuracy in automotive, rail transit & EPC projects.Chen Wei (Automation Lead Engineer)
 Oct 23, 2026US Navy Raises Gecko Robotics Contract Ceiling to $300M for Robotic Fleet MaintenanceUS Navy raises Gecko Robotics’ contract ceiling to $300M for Pacific Fleet robotic inspections. Explore potential opportunities for maintenance suppliers and key procurement considerations.Chen Wei (Automation Lead Engineer)
 Oct 23, 2026Choosing Industrial Sensing Systems for Global Plants: Protocol CompatibilityCompare industrial sensing systems international buyers can trust. Explore protocol compatibility, reduce integration risks, and select proven configurations for reliable global plant deployments.TSV Data Lab
 Oct 22, 2026KUKA Showcases Physical AI and iiQKA.AI Vision at NVIDIA GTC BerlinExplore KUKA’s Physical AI showcase at NVIDIA GTC Berlin and discover how iiQKA.AI Vision aims to simplify robotic vision integration and improve 2D and 3D scene recognition.TSV Data Lab
 Oct 22, 2026Robotic Machining of Advanced Composites: What Tolerances Are Achievable?Explore advanced materials machining robotics: discover what drives achievable composite tolerances and how to validate accuracy before investing in your next machining system.Dr. Marcus Vance
 Oct 21, 2026China’s Industrial Robot Exports Near RMB 10 Billion in First Nine Months of 2026China’s industrial robot exports neared RMB 10 billion in January–September 2026, with value rising faster than volume. Explore the data and what it could mean for suppliers.Chen Wei (Automation Lead Engineer)
 Oct 21, 2026Low-Latency Industrial Data Processing: Pricing and Key Cost DriversExplore industrial data latency price drivers, from edge hardware to integration and support. Learn how to compare quotes, verify performance, and avoid unnecessary costs.TSV Data Lab
 Oct 20, 2026KUKA Launches iiQKA.AI Vision to Simplify Industrial Image ProcessingKUKA iiQKA.AI Vision simplifies industrial image processing with controller-based 2D and 3D vision. Explore drag-and-drop setup for vision-guided automation.TSV Data Lab
 Oct 20, 2026Smart Industrial Edge Devices: Key Criteria for Legacy PLC IntegrationChoose smart industrial edge devices for legacy PLC integration. Discover key criteria for compatibility, data quality, security, and reliable collection without disrupting control.TSV Data Lab
 Oct 19, 2026Choosing a Radar Sensor by Application: Range, Resolution, and Field of ViewSimplify radar sensor application based product selection. Compare range, resolution, and field of view to avoid blind spots and choose with confidence. Explore the guide.TSV Data Lab
 Oct 18, 2026Comparing Material Options for Procurement: Specs, Costs, and Supply RisksExplore procurement oriented technical content on material options, specs, costs, and supply risks. Compare alternatives to cut hidden expenses and make confident sourcing decisions.Dr. Marcus Vance
 Oct 17, 20265-Axis CNC Positioning Accuracy: How to Interpret ISO 230-2 Test ResultsAssess 5 axis CNC machining positioning accuracy with ISO 230-2. Learn to interpret repeatability, reversal error, and test conditions to compare suppliers and make confident acceptance decisions.Dr. Marcus Vance
 Oct 16, 2026Choosing a Rugged Edge AI Box Supplier: Thermal Tests and Lifecycle SupportChoose a rugged edge AI box supplier with proven thermal performance and reliable lifecycle support. Discover the tests and commitments to verify before you buy.TSV Data Lab
 Oct 15, 2026R&D Cost Reduction Services: How to Evaluate Fees, Savings, and ROIEvaluate R&D cost reduction services with confidence. Compare fees, verify savings, and calculate ROI without compromising performance. Discover how to choose a provider that delivers real value.Chen Wei (Automation Lead Engineer)
 Oct 23, 2026How Do You Evaluate Solid-State LiDAR Point Cloud Density?Evaluate solid-state LiDAR point cloud density using valid returns, angular spacing, and real-world coverage. Discover how to compare sensors and choose the right fit for your application.TSV Data Lab
 Oct 22, 2026How Do You Test AMR Navigation Accuracy in a Warehouse?Test AMR navigation accuracy in warehouses with practical methods for localization, path tracking, and docking. Learn to set tolerances and compare robots before deployment.Chen Wei (Automation Lead Engineer)
 Oct 21, 2026How Should You Balance Cobot Payload Against Reach?Explore cobot payload versus reach to choose the right robot. Learn how tooling, load limits, workspace, and cycle time affect performance—and avoid costly selection mistakes.Chen Wei (Automation Lead Engineer)
 Oct 20, 2026How Do You Measure Industrial IoT Gateway Latency Under Load?Measure industrial IoT gateway latency under load with reliable timestamps, realistic traffic, and tail-latency analysis. Discover how to expose bottlenecks and choose the right gateway.TSV Data Lab