Millimeter AGV Positioning Accuracy Sounds Simple Until Docking Starts
Publication Date
author
Millimeter-level AGV positioning accuracy sounds impressive on paper—until real docking, transfer, and ERP/WMS handshakes expose the gap between lab specs and shop-floor reality. For teams evaluating smart factory automation solutions, automated guided vehicle for heavy load systems, or agv integration with erp wms, the real question is not navigation alone, but whether repeatable docking accuracy holds under production pressure.
That distinction matters to engineers, operators, procurement teams, and executive decision-makers alike. A vehicle that reports ±5 mm in a clean demo aisle may still miss a conveyor interface, delay a robotic load transfer, or trigger software exceptions when floor wear, payload shift, network latency, and station tolerances begin stacking up. In practical automation programs, docking repeatability is not a marketing line item; it is a throughput variable.
At TechStat Vanguard, the useful question is always the same: which parameters still hold when the system is exposed to production reality? In AGV projects, that means breaking positioning accuracy into measurable layers—global navigation, local correction, mechanical alignment, station design, and digital handshake integrity. Once those layers are evaluated together, buyers can distinguish between a vehicle that merely arrives near a station and one that docks reliably, shift after shift.
Why millimeter accuracy becomes a different problem at the docking station
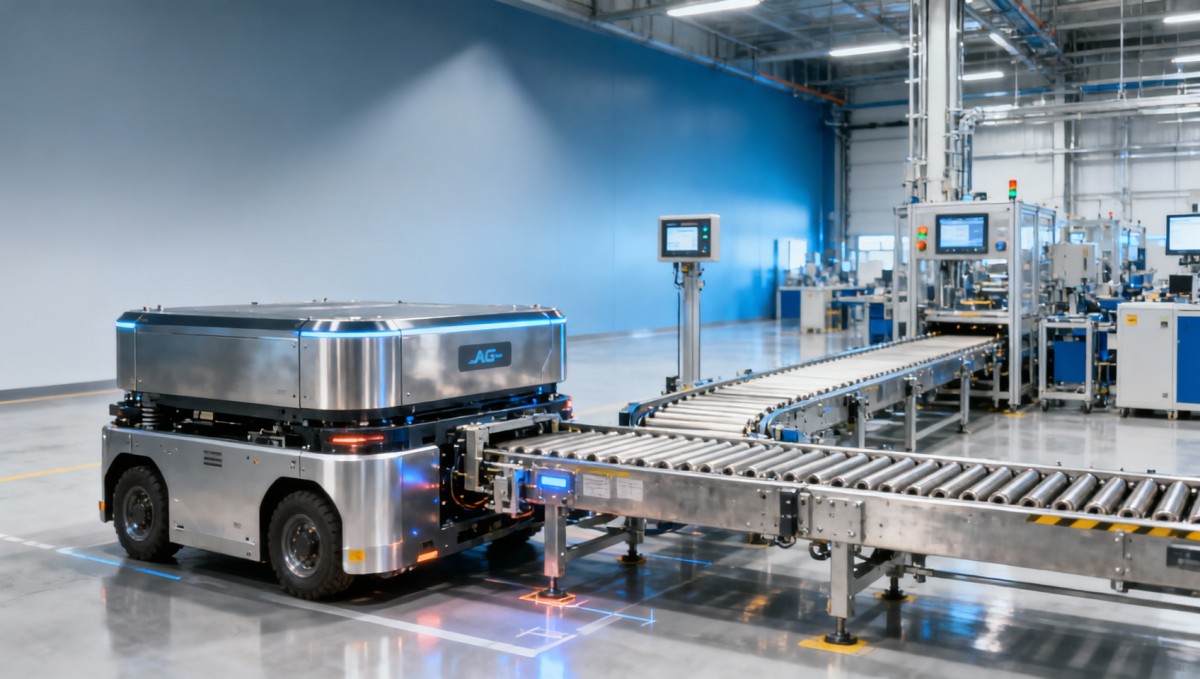
In open-path navigation, an AGV can still complete a route even if its stop point varies by 10–20 mm. Docking is different. Once the vehicle must interface with a roller conveyor, lift table, robotic arm, charging plate, or pallet transfer frame, the tolerance window often narrows to ±3 mm, ±5 mm, or at most ±10 mm depending on the mechanical design. A small deviation that looks harmless on a map can become a failed transfer in production.
This is where many factory teams discover that positioning accuracy is not a single number. There is map accuracy, localization refresh rate, vehicle stopping repeatability, mast or fork deflection under load, and station-side mechanical tolerance. If each layer introduces even 1–3 mm of deviation, the combined result can exceed the transfer window. The problem is cumulative, not isolated.
Heavy-load AGV systems face an even tougher condition. A platform carrying 500 kg, 1 ton, or 2 tons behaves differently from an unloaded unit used during a showroom test. Braking distance changes, wheel deformation increases, and the center of gravity may shift during acceleration and deceleration. In some layouts, a floor slope of only 1–2% is enough to influence final docking posture.
Another practical factor is cycle frequency. A vehicle that docks correctly 8 times out of 10 is not acceptable on a line that runs 400 docking cycles per shift. Even a 1% docking failure rate can create repeated manual intervention, blocked aisles, delayed replenishment, and avoidable alarm events in the WMS or MES layer. Reliability at scale matters more than best-case accuracy at one point in time.
The five tolerance layers most buyers underestimate
- Vehicle localization tolerance: laser SLAM, QR code, magnetic, or reflector-based guidance each behaves differently under dust, reflection, and traffic density.
- Stopping repeatability: deceleration control, wheel traction, and controller tuning can add several millimeters even when map position is correct.
- Payload-induced deformation: fork sag, chassis twist, and load offset become significant above 300–500 kg.
- Dock station tolerance: conveyor frame flatness, sensor bracket installation, and worn guide rails can widen error bands over time.
- Software handshake timing: ERP/WMS/MES confirmation delays of 200–800 ms may trigger motion timing mismatches at the station.
The table below helps separate “navigation accuracy” from “dock-ready accuracy,” which is the more useful procurement lens for real operations.
The practical takeaway is straightforward: if a supplier quotes a single millimeter-level value without stating load condition, floor condition, station type, or correction method, the figure is incomplete. Decision-makers should insist on task-specific accuracy, not generic navigation claims.
What actually affects repeatable AGV docking on the shop floor
Repeatable docking is influenced by a chain of physical and digital variables. Floor condition alone can change outcomes dramatically. Expansion joints, epoxy wear, embedded rails, dust buildup, and local vibration near stamping or machining zones all influence how accurately an AGV can approach a target. A floor that varies by 3–5 mm across a docking zone may already be large enough to challenge a tight transfer interface.
Sensor selection also matters. LiDAR-based localization may perform well in flexible environments, but reflective surfaces, glass partitions, and moving traffic can create noise. QR or Data Matrix markers can improve local correction, yet they depend on line-of-sight cleanliness and maintenance discipline. Magnetic guidance offers predictable routing, but layout changes become slower and more expensive. There is no universal best method; there is only method-to-scenario fit.
Vehicle mechanics are often under-checked during procurement. Wheel material hardness, steering backlash, suspension behavior, encoder resolution, and braking control affect the final 50–200 mm before docking more than buyers expect. If the application involves heavy loads, narrow bays, or high-frequency transfers, mechanical repeatability must be reviewed together with control logic.
Finally, the station itself must be treated as part of the positioning system. A perfectly tuned AGV cannot compensate for a dock frame that shifts over time, sensors mounted with inconsistent offsets, or conveyor heights that drift outside tolerance after maintenance work. In many failed deployments, the root cause sits in the interface hardware rather than the vehicle.
Common causes of docking deviation in production
Environmental and layout issues
- Floor settlement or unevenness greater than 2–3 mm in the final docking area.
- Metallic clutter, reflective barriers, or frequent traffic changes that reduce localization stability.
- Docking zones placed too close to fork traffic, causing repeated obstruction and path correction.
Vehicle and load issues
- Payload center offset exceeding design assumptions, especially with asymmetrical pallets or fixtures.
- Wheel wear after 6–12 months that changes stopping behavior if preventive maintenance is weak.
- Insufficient local correction logic for the last 100 mm of approach.
For most smart factory automation solutions, the best-performing architecture combines global navigation with local correction. That may mean LiDAR for path planning and visual, code-based, or mechanical referencing at the station. This layered approach can reduce approach variability from a broader ±15 mm range to a controlled ±3–5 mm range when implemented well.
The most useful engineering question is therefore not “What is your AGV accuracy?” but “What docking repeatability can you maintain at full payload, on our floor, at our target cycle rate, after 3 shifts of operation?” That wording reveals system maturity much faster than generic brochures do.
How to evaluate AGV integration with ERP, WMS, and transfer equipment
Docking success is not purely mechanical. In modern factories, the vehicle must also exchange task status, inventory confirmation, load identity, and exception codes with ERP, WMS, MES, or line control systems. If the physical stop is accurate but the digital handshake is late or inconsistent, the station may still reject the transfer. Integration quality is therefore a core part of positioning performance.
A typical handoff sequence contains at least 5 stages: dispatch creation, route authorization, arrival confirmation, station readiness confirmation, and transfer completion feedback. In high-volume operations, each stage may need to complete within 100–500 ms to avoid creating dead time. Once software latency rises beyond 1–2 seconds, the impact becomes visible in queue growth and station occupancy.
The issue becomes sharper when AGVs serve multiple systems at once. For example, a heavy-load vehicle may need to read pallet identity from WMS, receive route priority from traffic control, confirm conveyor state through PLC signals, and return completion data to ERP. If any interface lacks timestamp discipline, status synchronization, or exception recovery logic, the vehicle may re-approach, wait in place, or trigger unnecessary operator intervention.
This is why procurement teams should treat integration architecture as part of the acceptance scope. Request interface timing logic, retry policy, timeout settings, and error handling scenarios. A project that looks inexpensive at the equipment level can become costly if software troubleshooting extends commissioning from 2 weeks to 8 weeks.
Minimum integration checkpoints before purchase approval
The following checklist helps align engineering, IT, operations, and sourcing teams before an AGV project enters final vendor selection.
The main conclusion is that AGV integration with ERP WMS should be tested as a cycle, not as isolated API success. A message reaching the server is not enough. The system must prove that the right physical action occurred at the right station, within the right time window, with the right inventory state.
A practical commissioning sequence
- Validate docking repeatability without payload for 30–50 cycles.
- Repeat validation at nominal payload and maximum planned payload.
- Introduce live PLC and station feedback logic.
- Run ERP/WMS handshake under realistic task concurrency.
- Test error recovery, blocked station response, and re-dispatch logic.
When teams follow this staged sequence, they can isolate whether a problem comes from positioning, mechanics, controls, or software orchestration. That shortens root-cause analysis and prevents the common mistake of blaming the AGV when the true issue sits in process integration.
Selection criteria for heavy-load AGV systems and precision docking projects
Procurement decisions should start from transfer risk, not brochure features. A plant moving empty bins at low speed does not need the same docking architecture as a facility moving 1,500 kg engine components, battery packs, aerospace subassemblies, or large reels. The heavier and more valuable the load, the more important it becomes to evaluate structural stability, interface tolerance, and recovery logic.
For automated guided vehicle for heavy load applications, buyers should examine at least 4 dimensions: load dynamics, docking method, digital integration, and serviceability. Load dynamics includes payload range, center-of-gravity variation, incline tolerance, and braking performance. Docking method covers whether the system relies on free stop, local visual correction, mechanical guide pin alignment, or active lift compensation.
Serviceability is especially important in 24/7 operations. If a wheel set requires replacement every 4–6 months under abrasive flooring, or a sensor recalibration procedure takes 3 hours, downtime can erode the initial savings promised by automation. Maintenance accessibility, spare part lead time, and diagnostic transparency are therefore relevant buying criteria, not afterthoughts.
A disciplined selection process also compares acceptance metrics. Instead of accepting “millimeter-level positioning,” specify measurable criteria such as 200 consecutive dockings, at full payload, with at least 98–99.5% successful transfer completion, under actual network and traffic conditions. Those requirements create accountability and produce more realistic supplier proposals.
Decision factors that should appear in the RFQ
The following comparison table can be used when shortlisting vendors for smart factory automation solutions with repeatable docking demands.
For enterprise decision-makers, this type of comparison helps reduce qualification risk. For operators and engineers, it ensures that final acceptance criteria reflect the real line conditions they will manage every day. For procurement teams, it prevents feature-heavy proposals from masking critical integration gaps.
Three practical specification tips
- Specify docking repeatability separately from route navigation accuracy.
- Request validation at minimum, nominal, and maximum payload rather than unloaded demonstration only.
- Define software response thresholds and exception recovery steps in the same document as mechanical acceptance.
Implementation risks, validation methods, and questions buyers should ask
Even good AGV projects can underperform if validation is too narrow. One common mistake is commissioning during low-traffic hours, on clean floors, with a simplified route set, and then assuming the same results will hold in live production. A more reliable approach is to validate under the same conditions the plant will face at 70–90% operational intensity.
Another frequent error is accepting successful arrival as equivalent to successful transfer. In reality, the useful metric is task completion rate. If 100 missions are dispatched and 97 arrive, but only 92 complete physical transfer without intervention, then the meaningful success rate is 92%, not 97%. This distinction is essential when building ROI models for labor reduction and throughput planning.
Validation should also include degradation scenarios. Test wheel wear simulation, partial network delay, sensor contamination, blocked station logic, and repeated docking over extended cycles such as 100, 200, or 500 repetitions. Precision that disappears after several hours of operation is not stable precision. Long-cycle consistency matters more than a clean first-run result.
For companies building a supplier qualification framework, the right buyer questions tend to expose maturity quickly. Ask how accuracy was measured, under which load, on what floor condition, at what speed, with which local correction method, and with what transfer success rate. If answers stay abstract, risk is usually still high.
FAQ for research teams, users, and sourcing managers
How accurate does an AGV need to be for conveyor docking?
In many facilities, reliable conveyor docking requires final repeatability in the ±3 to ±10 mm range, depending on transfer width, guide design, and whether there is mechanical compliance at the station. The correct target should always be defined around transfer success, not just stop-point accuracy.
Are millimeter-level claims realistic for heavy-load AGVs?
They can be realistic in controlled conditions and with local correction, but buyers should ask whether the claim applies at full payload, during repeated cycles, and on production floors. A result proven at 0 kg is not equivalent to one proven at 1,000 kg or more.
How long does integration with ERP or WMS usually take?
Simple task-level integration may take 2–4 weeks, while multi-system orchestration involving WMS, MES, PLCs, and exception handling can take 6–12 weeks or longer depending on interface readiness and data cleanliness. Commissioning timelines should include test cycles, not only interface coding.
What should be included in final acceptance?
At minimum: payload-specific docking validation, transfer completion rate, communication timeout behavior, blocked-station recovery, and maintenance documentation. If any of these items are excluded, operational risk remains hidden until go-live.
Millimeter AGV positioning accuracy only becomes meaningful when it survives the full chain of real-world demands: floor variation, payload dynamics, mechanical interfaces, software timing, and repeated docking cycles. For factories investing in smart material flow, the goal is not a persuasive number on a brochure. The goal is stable transfer performance that supports throughput, data integrity, and predictable operations.
TechStat Vanguard focuses on the parameters that continue to matter after deployment. If your team is comparing automated guided vehicle solutions, refining a heavy-load AGV specification, or planning AGV integration with ERP WMS, now is the right time to define acceptance around measurable docking reality. Contact us to discuss evaluation criteria, benchmarking priorities, or a more decision-ready technical framework for your automation project.
Search News
Hot Articles
- Carbon Fiber StructuresHow to Specify Aerospace Carbon Fiber Assemblies for Lightweight, Load-Bearing PartsJul 11, 2026
- Machine VisionXiaomi, Alibaba DAMO Academy Drive Open-Source Robotics Model Ecosystem, Lowering Algorithm Development Barriers for Overseas SMEs Adopting Chinese Robotics SolutionsMar 30, 2026
- Cobots & ArmsShanxi 'AI+' Conference Showcases Embodied Intelligence with Multinational Buyer Engagement: Key Industry ImplicationsMar 30, 2026
Popular Tags
Recommended News
 Jul 11, 2026How to Specify Aerospace Carbon Fiber Assemblies for Lightweight, Load-Bearing PartsAerospace carbon fiber assemblies: learn how to specify laminate design, load data, joining methods, and inspection controls for lighter, reliable load-bearing aerospace parts.Elena Rostova (UAV Systems Researcher)
 Mar 30, 2026Xiaomi, Alibaba DAMO Academy Drive Open-Source Robotics Model Ecosystem, Lowering Algorithm Development Barriers for Overseas SMEs Adopting Chinese Robotics SolutionsXiaomi & Alibaba DAMO Academy's open-source robotics models lower algorithm barriers for global SMEs. Boost efficiency in manufacturing, logistics & smart retail with ROS 2 compatible solutions.TSV Data Lab
 Mar 30, 2026Shanxi 'AI+' Conference Showcases Embodied Intelligence with Multinational Buyer Engagement: Key Industry ImplicationsShanxi 'AI+' Conference highlights embodied intelligence with Tesla, Ubtech & Jiantao showcasing multimodal robotics. 40+ global buyers validated tech on-site, creating new B2B channels for industrial automation & AI solutions.Chen Wei (Automation Lead Engineer)
 Mar 30, 2026Zhongguancun Unveils 6G Integrated Sensing-Computing-Intelligence Platform to Empower Embodied Robots for Global Industrial ApplicationsZhongguancun's new 6G platform revolutionizes industrial robotics with <10ms latency, empowering global automotive, logistics & port automation. Discover how this tech boosts China's smart manufacturing exports.TSV Data Lab
 Mar 30, 2026Mech-Mind Tianjin Embodied Intelligence R&D and Production Base Goes Live, Cutting Delivery Time by 20%–30% for Global Customized AMR+Vision SolutionsMech-Mind's Tianjin AMR+Vision production base cuts delivery time by 20%-30% for欧美 & Latin American markets. Discover how this PLd-certified facility accelerates customized robotics solutions for smart manufacturing and logistics.Chen Wei (Automation Lead Engineer)
 Mar 30, 2026Boao Forum Reveals 'Co-evolution of Big and Small Brains' Trend in Humanoid Robots, China's Embodied Intelligence Accelerates Adaptation to Overseas Manufacturing Service ScenariosDiscover how China's humanoid robots, featuring 'Co-evolution of Big and Small Brains,' are revolutionizing global manufacturing. Learn about Embodied Tian Gong 3.0's ISO compliance and overseas deployment at Boao Forum 2026.Chen Wei (Automation Lead Engineer)
 Mar 30, 2026China Railway Industrial Secures Patent for Embodied Robotics in Material Handling, Boosting High-Precision Delivery Capabilities for Overseas Infrastructure and Manufacturing ProjectsChina Railway Industrial's new patent for embodied robotics in material handling boosts high-precision delivery for global infrastructure & manufacturing. Discover how this innovation enhances logistics accuracy in automotive, rail transit & EPC projects.Chen Wei (Automation Lead Engineer)
 Oct 15, 2026R&D Cost Reduction Services: How to Evaluate Fees, Savings, and ROIEvaluate R&D cost reduction services with confidence. Compare fees, verify savings, and calculate ROI without compromising performance. Discover how to choose a provider that delivers real value.Chen Wei (Automation Lead Engineer)
 Oct 14, 2026Drone Frame Composites: Carbon Fiber vs. Fiberglass for Weight and StiffnessExplore drone structural materials composites: compare carbon fiber and fiberglass for weight, stiffness, cost, and antenna compatibility. Find the right material for your drone frame.Elena Rostova (UAV Systems Researcher)
 Oct 13, 2026Smart Cameras vs. PC-Based Machine Vision: Which Fits High-Speed Inspection?This industrial product comparison for machine vision weighs smart cameras vs. PC-based systems on latency, throughput, and cost. Discover your best fit for high-speed inspection.TSV Data Lab
 Oct 12, 2026How to Verify RoHS Compliance in Industrial Sensing Systems Before DeploymentRoHS compliant sensing systems: learn how to verify materials, supplier declarations, testing, and configuration controls before industrial deployment.TSV Data Lab
 Oct 11, 2026How Procurement-Oriented Content Taxonomy Improves B2B Buying JourneysProcurement-oriented content taxonomy streamlines B2B buying journeys with clearer evidence, supplier comparisons, risk visibility, and faster approvals.TSV Data Lab
 Oct 10, 2026How to Select a Machine Performance Monitoring Platform for OEE and Downtime ReductionMachine performance monitoring platform selection guide: validate machine states, OEE data, downtime reasons, integrations, and scalability to reduce losses with confidence.TSV Data Lab
 Oct 08, 2026How to Machine Inconel 625 Blades Without Heat Cracks or Edge ChippingInconel 625 blade machining guide: prevent heat cracks, edge chipping, chatter, and work hardening with proven tooling, cooling, fixturing, and inspection strategies.Dr. Marcus Vance
 Oct 07, 2026How to Evaluate an HMI Panel Distributor for Industrial Automation ProjectsHMI panel distributor evaluation guide: verify technical compatibility, traceability, supply reliability, lifecycle support, and total cost for automation projects.Victor Lin (Chief Software Architect)
 Oct 06, 2026Navigation Fault Tolerance Standards for AMRs: What Safety Teams Must VerifyNavigation fault tolerance standards: learn what AMR safety teams must verify, from localization loss and sensor faults to stopping distance, safe restart, and site-specific validation.Chen Wei (Automation Lead Engineer)
 Oct 05, 2026Calculating Edge Computing Total Cost of Ownership Across Distributed SitesEdge computing ownership cost explained: calculate deployment, energy, connectivity, security, remote support, and refresh costs across distributed sites.TSV Data Lab
 Oct 04, 2026CAD/CAM Benchmarking in the GCC: What Manufacturers Should Ask a ConsultantCAD CAM benchmark consultant GCC guide: learn the key questions manufacturers should ask to validate post-processors, workflows, machine performance, and production risk.Victor Lin (Chief Software Architect)
 Oct 03, 2026Selecting Automotive Radar Sensor Modules for ADAS Range, Resolution, and IntegrationAutomotive radar sensor module selection guide for ADAS: compare range, resolution, field of view, latency, and integration to build safer, reliable vehicle systems.TSV Data Lab
 Oct 02, 2026How to Qualify Machined Parts Suppliers for Hard Tech ProgramsHard tech supply chain machined parts demand rigorous supplier qualification. Learn how to assess capability, traceability, quality controls, and delivery resilience.Dr. Marcus Vance
 Oct 01, 2026How to Select an Outdoor Security Radar Sensor for Perimeter Detection?Outdoor security radar sensor selection guide: compare range, accuracy, false-alarm control, integration, and field testing for reliable perimeter detection.TSV Data Lab
 Sep 30, 2026How to Evaluate Solid-State LiDAR Hardware for Outdoor Autonomous VehiclesSolid state LiDAR hardware evaluation guide for outdoor autonomous vehicles—compare range, point-cloud quality, environmental resilience, integration, and safety.TSV Data Lab
 Sep 29, 2026ISO 9283 Repeatability: How to Evaluate Cobot Positioning PerformanceISO 9283 cobot repeatability explained: learn how payload, reach, approach direction, and test conditions affect positioning performance and cell capability.Chen Wei (Automation Lead Engineer)
 Oct 14, 2026How tight can micro machining aerospace tolerances be in production?Micro machining aerospace tolerances can reach low-micron levels in production. Learn what controls repeatability, inspection confidence, and flight-critical quality.Dr. Marcus Vance