AGV battery degradation rate after one year of use
Publication Date
author
For financial approvers evaluating warehouse automation ROI, the agv battery degradation rate after one year of use is not just a technical detail—it directly affects replacement budgets, uptime risk, and total cost of ownership. This analysis cuts through vendor claims to examine how real-world operating cycles, charging habits, and battery chemistry shape performance decline and long-term capital planning.
Why does the agv battery degradation rate matter so much after the first year?
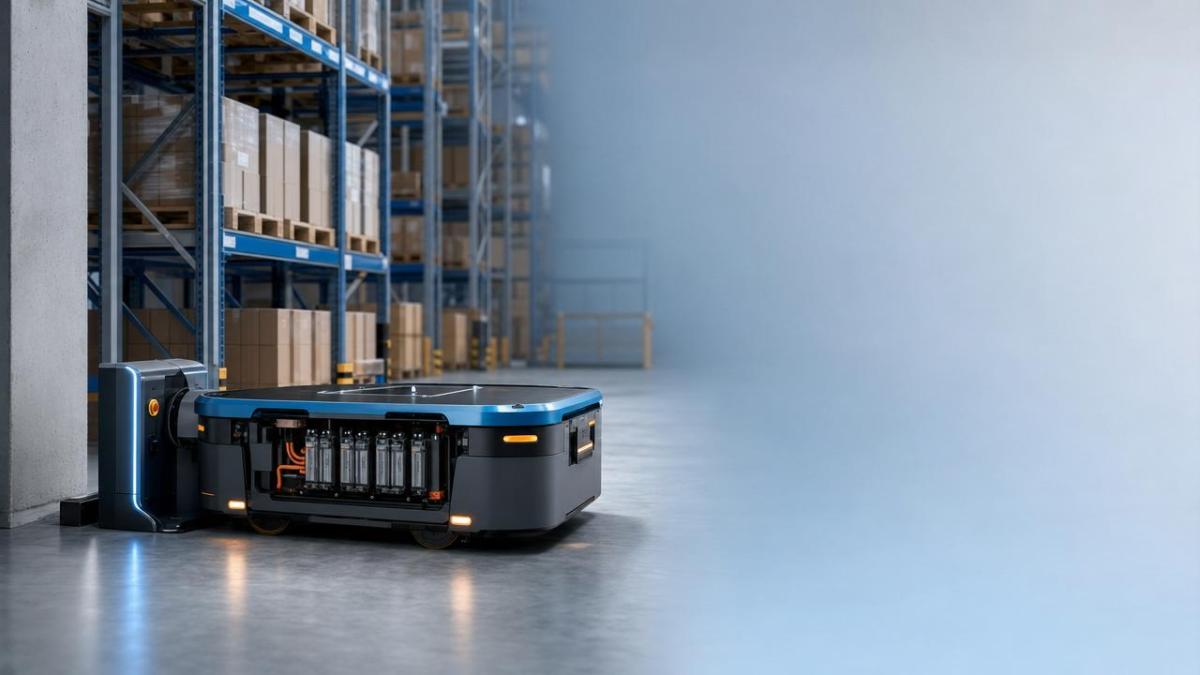
In many automation projects, the first twelve months create the baseline for whether the business case remains credible. Purchase price is visible on day one, but battery wear is a deferred cost. If the agv battery degradation rate is underestimated, finance teams may approve a fleet based on optimistic runtime assumptions and then face earlier replacement cycles, more spare battery purchases, and higher labor costs for charging management.
For AGV fleets operating across general industrial settings—warehousing, light manufacturing, parts distribution, and mixed-material handling—the battery is not just a consumable. It is a financial risk point tied to utilization, throughput continuity, and asset life. A 10% decline in usable capacity may be manageable in a low-duty fleet. The same decline in a high-cycle, multi-shift operation can trigger missed dispatch windows, lower vehicle availability, and unplanned capex.
What finance teams should translate into numbers
- Usable runtime per charge, not just nominal battery capacity stated on brochures.
- Cycle count exposure across one-shift, two-shift, and three-shift operations.
- Charging behavior impact, including fast charging, opportunity charging, and prolonged high state-of-charge storage.
- Temperature stress, payload variation, and route complexity that accelerate battery wear in real facilities.
- The downstream effect on replacement timing, spare stock, service calls, and vehicle scheduling buffers.
This is where TechStat Vanguard’s data-driven lens becomes useful. In hard-tech procurement, marketing language around “long-life batteries” has limited value without engineering context. Financial approvers need parameter-backed assumptions: degradation bands, duty-cycle sensitivity, charge profile effects, and replacement thresholds linked to actual fleet economics.
What is a normal agv battery degradation rate after one year?
There is no single universal number because the agv battery degradation rate depends heavily on chemistry and operating profile. However, after one year, many fleets see a meaningful but not catastrophic decline in usable capacity. The financially relevant question is not whether degradation exists, but whether the observed decline still supports the planned number of missions per shift without operational intervention.
Under moderate use, lithium-based AGV batteries often retain a large share of their original usable capacity after one year. Lead-acid systems may show more noticeable performance drift, especially if charge discipline is inconsistent. Even within lithium categories, degradation varies because high C-rate charging, thermal conditions, and deep discharge behavior all change the outcome.
The table below frames the agv battery degradation rate in practical budgeting terms rather than abstract chemistry language.
The key interpretation is simple: finance should not approve battery assumptions based only on rated cycle life. One-year degradation is operationally relevant long before end-of-life is reached. A fleet can still function while already creating hidden cost through shorter run windows, more charging interruptions, and reduced scheduling flexibility.
Which operating conditions accelerate battery wear in real AGV fleets?
The agv battery degradation rate rises when usage patterns diverge from laboratory assumptions. General industry environments are often harsher than spec sheets suggest. Routes are not always smooth, payloads vary by shift, ambient temperatures fluctuate, and idle time may be lower than expected during peak demand periods.
Common degradation drivers
- High daily cycle count. A fleet running across two or three shifts consumes battery life much faster than a demonstration environment or single-shift pilot.
- Frequent deep discharge. Repeatedly pushing batteries close to empty can accelerate capacity fade and increase thermal stress.
- Aggressive fast charging. Fast charging supports uptime, but poorly optimized charging profiles may trade productivity today for faster degradation tomorrow.
- Heat exposure. Elevated temperatures increase chemical aging and can distort expected one-year performance.
- Heavy payload routes and stop-start motion. High acceleration demand and incline travel raise current draw, which affects effective runtime and long-term battery health.
TSV’s broader hard-tech benchmarking philosophy is useful here: the true cost signal sits in operating thresholds, not generic claims. A vendor may quote theoretical cycle life, but finance should ask for runtime retention under your expected payload, shift structure, charging windows, and ambient temperature band. Those four variables often explain more about the agv battery degradation rate than the battery label alone.
How should financial approvers compare battery options before approving capex?
A sound approval process compares not only chemistry but also the surrounding system design. The battery, charger, battery management system, and AGV duty cycle form one economic unit. Reviewing them separately leads to distorted ROI calculations.
The comparison table below is designed for capital approval discussions where the agv battery degradation rate must be translated into procurement logic.
This comparison approach helps finance teams resist a common trap: choosing the lowest purchase price without testing whether one-year capacity decline will force more chargers, more spares, or more idle vehicles. Lower initial capex can produce higher operating expense if the battery architecture is mismatched to mission intensity.
How does battery degradation change total cost of ownership?
The agv battery degradation rate affects TCO through four channels. First, it changes how long each vehicle can operate before charging. Second, it influences the number of batteries or charge points required to sustain throughput. Third, it alters maintenance workload and service intervention frequency. Fourth, it can shorten the period before replacement spending must be booked.
Cost categories finance should model
- Initial battery and charger capex, including installation and electrical upgrades.
- Productivity loss from shorter runtime windows if one-year degradation exceeds assumptions.
- Replacement reserve for modules, packs, or entire battery assemblies based on expected wear bands.
- Downtime cost if degraded batteries cause dispatch gaps during peak operating hours.
- Labor and safety overhead associated with battery handling, charging management, and diagnostics.
In practical terms, finance should ask when degradation becomes operationally inconvenient, not merely when the battery is technically end-of-life. A fleet that still retains most nominal capacity may already require different charging windows or additional standby units. That threshold is often where the hidden TCO impact begins.
What procurement data should you request before signing?
Because vendor language can blur the difference between rated performance and delivered performance, procurement and finance should request a structured data pack. This is fully aligned with TSV’s principle that engineering truth starts with measurable parameters, not adjectives.
Minimum due diligence checklist
- Expected agv battery degradation rate after one year under a defined duty cycle, including payload, route length, and shift count.
- Recommended charging window logic and the impact of opportunity charging on long-term battery health.
- Battery management system functions, including thermal monitoring, overcharge protection, and state-of-health reporting.
- Service replacement process, expected lead time for battery components, and regional support availability.
- Any relevant safety and system compliance references commonly used in industrial electrical and machinery contexts.
Suppliers that cannot tie battery performance claims to a specific operating profile should be treated with caution. In automation projects, ambiguity is expensive. A finance team does not need a perfect forecast, but it does need bounded assumptions that can be audited against actual performance after deployment.
Are there common mistakes when estimating the agv battery degradation rate?
Yes, and most are avoidable. The first mistake is assuming all lithium solutions behave the same. The second is modeling usage from a pilot line and then scaling that model to full production without adjusting for cycle intensity. The third is ignoring charger strategy. The fourth is treating battery health as a maintenance topic only, when it should be part of capital approval and asset planning from the start.
Another common error is evaluating batteries only by replacement price. A cheaper pack may look favorable in procurement, but if its one-year degradation reduces runtime enough to require extra vehicles or additional charging stops, overall economics can worsen. This is why comparison must connect energy storage behavior to fleet throughput requirements.
Risk signals worth flagging early
- Performance claims are presented without duty-cycle assumptions.
- The supplier emphasizes cycle life but avoids one-year capacity retention discussion.
- No clear explanation is given for charging behavior, downtime planning, or spare strategy.
- Battery health data is not visible through the fleet management or diagnostics layer.
FAQ: practical questions financial approvers ask
How should we interpret a supplier’s battery cycle life claim?
Treat cycle life as a directional indicator, not a budgeting answer. It does not directly tell you the agv battery degradation rate after one year in your site conditions. Ask what capacity retention is expected under your route length, average payload, charging pattern, and daily operating hours. Those inputs are more useful for financial forecasting.
Is a lower one-year degradation rate always worth paying more for?
Not always. The premium is justified when uptime is critical, labor is expensive, or the fleet runs across multiple shifts. In a lighter-duty environment, a lower-cost battery system may still be acceptable if runtime buffers are generous and replacement planning is straightforward. The right answer depends on throughput sensitivity and downtime cost.
Can charging strategy reduce the agv battery degradation rate?
Yes, in many cases. Better charge scheduling, avoiding unnecessary deep discharge, and matching charger output to battery design can improve health retention. However, aggressive opportunity charging can also create trade-offs if not well managed. Finance should request an operating policy, not just hardware specifications.
What is the best time to review battery performance after deployment?
A structured review at three, six, and twelve months is sensible. This allows procurement, operations, and finance to compare real runtime data against the approved model. If the agv battery degradation rate is higher than expected, corrective action can begin before the issue distorts annual budgets or fleet availability.
Why work with a data-driven technical benchmarking partner?
Battery decisions sit at the intersection of automation engineering and capital discipline. That is exactly where independent analysis matters. TechStat Vanguard focuses on stripping away generalized marketing claims and translating technical variables into procurement-grade decision inputs. For AGV and AMR programs, that means looking beyond brochure runtime and into tolerance, failure exposure, charge logic, and measurable lifecycle behavior.
For financial approvers, the benefit is clarity. Instead of comparing vague “high-performance” claims, you can assess battery options against the variables that actually shape one-year outcomes: route demand, shift intensity, charge profile, supportability, and replacement timing. That reduces trial-and-error costs and strengthens internal approval confidence.
What you can discuss with us
- Parameter confirmation for expected agv battery degradation rate under your duty cycle.
- Battery chemistry and charging strategy comparison for different warehouse automation ROI models.
- Replacement planning assumptions, spare strategy, and lifecycle cost scenario building.
- Supplier evaluation criteria, delivery-risk questions, and supportability checkpoints.
- Compliance-related discussion points relevant to industrial electrical safety, system integration, and procurement documentation.
If your team is reviewing an AGV investment and needs a clearer view of battery-driven cost risk, contact us for a structured evaluation framework. We can help you examine performance assumptions, compare solution paths, clarify delivery and replacement variables, and turn the agv battery degradation rate into a decision-ready financial input rather than a hidden post-approval surprise.
Search News
Hot Articles
- Carbon Fiber StructuresHow to Specify Aerospace Carbon Fiber Assemblies for Lightweight, Load-Bearing PartsJul 11, 2026
- Machine VisionXiaomi, Alibaba DAMO Academy Drive Open-Source Robotics Model Ecosystem, Lowering Algorithm Development Barriers for Overseas SMEs Adopting Chinese Robotics SolutionsMar 30, 2026
- Cobots & ArmsShanxi 'AI+' Conference Showcases Embodied Intelligence with Multinational Buyer Engagement: Key Industry ImplicationsMar 30, 2026
Popular Tags
Recommended News
 Jul 11, 2026How to Specify Aerospace Carbon Fiber Assemblies for Lightweight, Load-Bearing PartsAerospace carbon fiber assemblies: learn how to specify laminate design, load data, joining methods, and inspection controls for lighter, reliable load-bearing aerospace parts.Elena Rostova (UAV Systems Researcher)
 Mar 30, 2026Xiaomi, Alibaba DAMO Academy Drive Open-Source Robotics Model Ecosystem, Lowering Algorithm Development Barriers for Overseas SMEs Adopting Chinese Robotics SolutionsXiaomi & Alibaba DAMO Academy's open-source robotics models lower algorithm barriers for global SMEs. Boost efficiency in manufacturing, logistics & smart retail with ROS 2 compatible solutions.TSV Data Lab
 Mar 30, 2026Shanxi 'AI+' Conference Showcases Embodied Intelligence with Multinational Buyer Engagement: Key Industry ImplicationsShanxi 'AI+' Conference highlights embodied intelligence with Tesla, Ubtech & Jiantao showcasing multimodal robotics. 40+ global buyers validated tech on-site, creating new B2B channels for industrial automation & AI solutions.Chen Wei (Automation Lead Engineer)
 Mar 30, 2026Zhongguancun Unveils 6G Integrated Sensing-Computing-Intelligence Platform to Empower Embodied Robots for Global Industrial ApplicationsZhongguancun's new 6G platform revolutionizes industrial robotics with <10ms latency, empowering global automotive, logistics & port automation. Discover how this tech boosts China's smart manufacturing exports.TSV Data Lab
 Mar 30, 2026Mech-Mind Tianjin Embodied Intelligence R&D and Production Base Goes Live, Cutting Delivery Time by 20%–30% for Global Customized AMR+Vision SolutionsMech-Mind's Tianjin AMR+Vision production base cuts delivery time by 20%-30% for欧美 & Latin American markets. Discover how this PLd-certified facility accelerates customized robotics solutions for smart manufacturing and logistics.Chen Wei (Automation Lead Engineer)
 Mar 30, 2026Boao Forum Reveals 'Co-evolution of Big and Small Brains' Trend in Humanoid Robots, China's Embodied Intelligence Accelerates Adaptation to Overseas Manufacturing Service ScenariosDiscover how China's humanoid robots, featuring 'Co-evolution of Big and Small Brains,' are revolutionizing global manufacturing. Learn about Embodied Tian Gong 3.0's ISO compliance and overseas deployment at Boao Forum 2026.Chen Wei (Automation Lead Engineer)
 Mar 30, 2026China Railway Industrial Secures Patent for Embodied Robotics in Material Handling, Boosting High-Precision Delivery Capabilities for Overseas Infrastructure and Manufacturing ProjectsChina Railway Industrial's new patent for embodied robotics in material handling boosts high-precision delivery for global infrastructure & manufacturing. Discover how this innovation enhances logistics accuracy in automotive, rail transit & EPC projects.Chen Wei (Automation Lead Engineer)
 Sep 28, 2026Spindle Runout Measurement in Germany: DIN Standards, Methods, and Acceptance LimitsSpindle runout measurement Germany: explore DIN standards, proven methods, acceptance limits, and audit-ready practices for reliable machining quality.Dr. Marcus Vance
 Sep 27, 2026How to Select Wall-Mount Edge Devices for Space-Constrained Factory NetworksWall mount edge devices for space-constrained factories: evaluate workload, thermal design, power resilience, cable access, and network reliability for smarter deployments.TSV Data Lab
 Sep 26, 2026Machining Tolerance Analysis: How to Set Limits That Meet Function and Cost TargetsMachining tolerance analysis: learn how to set functional limits, control tolerance stacks, reduce inspection risk, and balance precision with production cost.Dr. Marcus Vance
 Sep 25, 2026How to Evaluate an Industrial Infrastructure Data Platform for Multi-Site OperationsIndustrial infrastructure data platform evaluation guide for multi-site operations: compare data quality, edge resilience, interoperability, governance, and scalable proof-of-value criteria.Victor Lin (Chief Software Architect)
 Sep 24, 2026How to Select Machine Vision Optics for Accurate Inspection at Different Working DistancesMachine vision optics selection guide for accurate inspection at every working distance. Compare FOV, pixel scale, DOF, distortion, lighting, and telecentric options.TSV Data Lab
 Sep 23, 2026How to Evaluate a Machine Vision System Integrator for High-Speed Inspection LinesChoose a machine vision system integrator with proven expertise in high-speed inspection, reliable reject timing, robust optics, and measurable acceptance criteria.TSV Data Lab
 Sep 28, 2026When is a SCADA API the right choice for connecting plant systems?SCADA API guide: learn when governed plant data integration improves traceability, security, and scalability—without compromising real-time control.Victor Lin (Chief Software Architect)
 Sep 27, 2026How SCADA data integration improves traceability across production linesSCADA data integration connects production-line data to improve traceability, accelerate quality investigations, and strengthen safety decisions.Victor Lin (Chief Software Architect)
 Sep 26, 2026What to define before starting SCADA integration planningSCADA integration planning starts with clear scope, control boundaries, data models, cybersecurity, and testing. Discover the definitions that reduce risk and costly rework.Victor Lin (Chief Software Architect)
 Sep 25, 2026How a smart factory with Industrial IoT reduces production blind spotsDiscover how a smart factory with Industrial IoT turns real-time machine, quality, and workflow data into actionable insights that reduce production blind spots and delivery risks.Victor Lin (Chief Software Architect)
 Sep 24, 2026When does Industrial IoT make smart manufacturing easier to scale?Smart manufacturing Industrial IoT scales when trusted data, interoperable systems, and secure workflows turn connected assets into measurable gains.TSV Data Lab
 Sep 23, 2026What drives ultra-precision machining cost at 1-micron tolerance?Ultra precision machining cost per part at 1 micron tolerance depends on process, material, metrology, and yield. Learn how to compare quotes confidently.Dr. Marcus Vance
 Sep 22, 2026Drone Engine-T550CC Applications: Build the UAV Power System Around the MissionAn application guide for Drone Engine-T550CC integration, covering payload planning, airframe matching, cooling, fuel, vibration, test procedures, documentation, and service preparation.Elena Rostova (UAV Systems Researcher)
 Sep 22, 2026How to Evaluate Industrial Edge Computing Vendors for Factory DeploymentIndustrial edge computing vendor evaluation guide for factories: compare latency, protocol fit, reliability, security, and lifecycle support before deployment.TSV Data Lab
 Sep 21, 2026Drone Payload Integration: Matching Power, Data, and Center of Gravity for Reliable FlightsDrone payload integration made practical: balance power, data, center of gravity, and endurance to build safer, more reliable mission-ready flights.Elena Rostova (UAV Systems Researcher)
 Sep 20, 2026Autonomous Navigation Pricing: Cost Drivers and Budget Benchmarks for AMR ProjectsAutonomous navigation price explained: compare AMR cost drivers, software, sensors, integration, safety, and lifecycle budgets to build a scalable project plan.Chen Wei (Automation Lead Engineer)
 Sep 19, 2026How to Scope Automation Integration Services for Multi-System Factory ProjectsAutomation integration services: learn how to scope multi-system factory projects with clear workflows, interface contracts, safety boundaries, and acceptance criteria.Victor Lin (Chief Software Architect)