Why Some Fatigue Test Reports Are Hard to Compare Across Suppliers
Publication Date
author
When procurement teams review 5-axis CNC machining fatigue test reports from different suppliers, the numbers often look similar—but the methods behind them can vary enough to distort risk, cost, and long-term performance decisions. Understanding why these reports are hard to compare is essential for identifying real engineering capability, filtering out vague claims, and making supplier choices based on traceable, decision-grade data.
Why do fatigue test reports from different suppliers look comparable at first glance?
For procurement teams, the confusion usually starts with familiar-looking metrics: cycles to failure, stress level, load ratio, surface finish, alloy grade, and pass/fail conclusions. On paper, two suppliers may both submit 5-axis CNC machining fatigue test reports showing similar cycle counts for the same material family. Yet those reports can still describe very different realities.
The reason is simple: fatigue performance is highly sensitive to test design, sample preparation, machining path strategy, fixture constraints, post-processing, and statistical treatment. A report may present a clean chart, but if one supplier used polished specimens machined under tightly controlled tool wear conditions and another used production-representative parts with variable residual stress, the resulting data are not directly equivalent.
This matters even more in 5-axis CNC machining because complex geometries, multi-angle tool engagement, and local thermal effects can influence micro-surface integrity in ways that standard dimensional inspection will not reveal. In procurement, that means a fatigue number is never just a number. It is the outcome of a test system. If the system is inconsistent, the comparison becomes unreliable.
What makes 5-axis CNC machining fatigue test reports especially difficult to compare?
The first challenge is that machining-induced fatigue behavior is not determined by base material alone. Two suppliers can buy the same alloy but produce different fatigue outcomes because of spindle stability, toolpath smoothing, tool condition, coolant delivery, clamping strategy, and post-machining treatments. In other words, 5-axis CNC machining fatigue test reports often reflect the supplier’s process maturity as much as the material’s inherent strength.
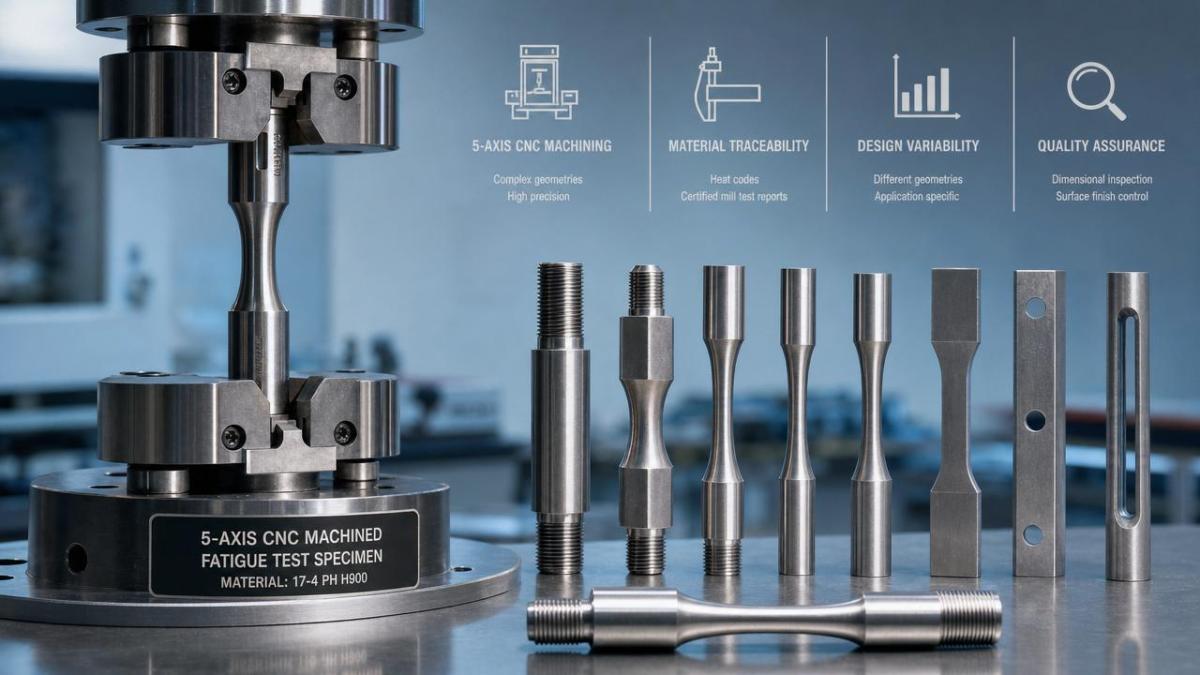
The second challenge is geometry. One report may use standard dog-bone samples, while another may test notched coupons, thin-wall structures, or near-net production features. Standard specimens are useful for baseline material behavior, but procurement teams sourcing aerospace, robotics, UAV, or precision mechanical parts need to know whether the reported fatigue result actually reflects the part they intend to buy.
The third challenge is test environment. Room temperature axial fatigue data cannot automatically predict service life under vibration, thermal cycling, humidity, or corrosive exposure. If Supplier A reports lab-controlled high-cycle fatigue and Supplier B reports a mixed loading spectrum closer to field conditions, the second report may look weaker while actually being more decision-useful.
Finally, reporting formats vary widely. Some suppliers disclose S-N curves, confidence intervals, fracture location, and sample count. Others provide only a summary table with a marketing-style conclusion. That is one of the biggest reasons procurement teams struggle with 5-axis CNC machining fatigue test reports: the data depth is inconsistent, and missing detail often hides the true risk.
Which technical variables should procurement teams check first?
If you want a practical comparison method, start by checking whether the reports align across the following variables. These factors usually explain why apparently similar fatigue claims are not truly comparable.
This table is often more useful than headline fatigue numbers. For buyers, the goal is not to find the biggest cycle count. It is to identify which supplier provides fatigue evidence that is relevant, reproducible, and tied to real manufacturing controls.
Are standards enough to make reports comparable?
Not by themselves. Standards such as ASTM or ISO create a testing framework, but they do not erase all interpretation gaps. Two suppliers can both cite the same standard and still use different specimen preparation methods, acceptance criteria, stress levels, runout definitions, and reporting depth.
This is where many procurement teams make a costly mistake. They see a recognized standard name in 5-axis CNC machining fatigue test reports and assume the reports are directly benchmarkable. In reality, the standard is only the starting point. The comparability depends on how faithfully the method was executed and how transparently the supplier documented deviations, assumptions, and process controls.
A robust report should clearly state material heat lot traceability, machining sequence, post-machining treatment, fixture method, test frequency, environment, and statistical interpretation. If those elements are absent, the report may be technically compliant but commercially weak as a supplier qualification document.
What are the most common red flags in supplier fatigue reports?
Several red flags appear repeatedly in procurement reviews. The first is selective data disclosure. If a report highlights only best-case cycles and omits scatter, failed specimens, or outliers, it may present a distorted picture of process stability.
The second red flag is overreliance on polished laboratory coupons. Those coupons can be useful for material benchmarking, but they may hide the real fatigue penalty caused by tight internal corners, thin sections, or multi-axis tool transitions found in actual production parts.
The third is vague wording. Phrases such as “high fatigue resistance,” “tested to aerospace level,” or “meets customer expectations” have little value unless the report includes exact loads, cycles, geometry, and acceptance logic. Tech-driven procurement should treat adjectives as noise unless backed by traceable engineering data.
The fourth is missing process linkage. Good 5-axis CNC machining fatigue test reports connect fatigue outcomes to specific manufacturing conditions. Weak reports act as if fatigue performance exists independently from toolpath, machine calibration, or finishing controls. That disconnect makes root-cause analysis impossible if field failures occur later.
The fifth red flag is suspiciously clean consistency. Real fatigue data almost always show some scatter. If every point clusters too perfectly without explanation, procurement teams should ask whether the sample count was too low or whether nonrepresentative specimens were chosen.
How should buyers compare reports when test methods are not identical?
In many sourcing projects, perfect alignment is not realistic. Suppliers may already have internal fatigue datasets generated under different programs. In that case, buyers should not force a false apples-to-apples comparison. Instead, use a normalization approach.
First, separate baseline comparability from decision relevance. A report may be less comparable but more relevant if it reflects the target geometry and use case. Second, build a weighted review checklist covering specimen design, machining representativeness, load mode, environmental realism, and statistical strength. Third, score disclosure quality. A supplier that openly explains limitations is often a lower long-term risk than one that presents polished but incomplete claims.
For strategic sourcing, many teams benefit from requesting a common verification plan after the initial screening stage. That plan can define one material lot, one feature geometry, one machining route family, one finishing condition, one load spectrum, and one reporting template. Once all shortlisted suppliers generate data under the same framework, 5-axis CNC machining fatigue test reports become much more actionable for cost-risk tradeoff decisions.
Why do these differences affect total procurement cost, not just technical evaluation?
Poorly comparable fatigue reports can drive hidden costs throughout the sourcing cycle. If a buyer overestimates supplier capability based on incomplete data, the consequences may include qualification delays, redesign loops, extra validation runs, warranty claims, or field reliability issues. In high-value sectors, the largest expense is often not the part price; it is the cost of uncertainty.
On the other hand, a supplier with rigorous but less flattering fatigue data may actually reduce total cost because its report supports faster root-cause tracing, stronger process control, and more predictable scaling. Procurement leaders should therefore judge 5-axis CNC machining fatigue test reports not only by peak performance but by how well the data reduce ambiguity across engineering, quality, and supply chain teams.
This is especially important in multi-site manufacturing, regulated applications, and programs where parts face dynamic loads over long service periods. Decision-grade data shorten qualification cycles because engineering and purchasing can align on the same evidence base.
What questions should procurement teams ask before accepting a fatigue report?
A strong review process starts with direct questions. Ask whether the tested sample reflects production geometry. Confirm whether the machining parameters were production-representative or optimized only for the test batch. Request traceability for material lot, machine platform, cutting tools, setup strategy, and any downstream finishing process.
Then ask for the stress ratio, loading mode, environment, test frequency, sample count, runout threshold, and failure analysis evidence. If the supplier cannot explain how these variables relate to end-use conditions, the report may be unsuitable for final supplier ranking.
It is also wise to ask what the report does not prove. Credible suppliers can define the boundaries of their own data. That kind of transparency is valuable because it helps procurement teams design the next validation step instead of assuming the current document answers every reliability question.
So, how can teams make better use of 5-axis CNC machining fatigue test reports?
The best approach is to treat fatigue reports as structured evidence, not as marketing collateral and not as isolated pass/fail certificates. Procurement teams should compare method quality, process traceability, and application relevance before comparing cycle counts. That shift turns 5-axis CNC machining fatigue test reports into a practical tool for supplier qualification rather than a source of false confidence.
For organizations evaluating multiple machining partners, the next step is to standardize the review template. Define which parameters must be disclosed, which specimen types are acceptable, which loading conditions matter most, and what level of statistical confidence is required. This reduces argument, speeds alignment between engineering and purchasing, and exposes which suppliers truly operate with data discipline.
If you need to move from broad screening to real supplier selection, prioritize these conversations first: what exact geometry should be tested, what service load case should be simulated, what process controls must be frozen, what traceability level is non-negotiable, how many samples are needed, how long verification will take, and how report formats will be standardized across bidders. Those questions create the bridge from generic fatigue claims to procurement decisions grounded in engineering truth.
Search News
Hot Articles
- Carbon Fiber StructuresHow to Specify Aerospace Carbon Fiber Assemblies for Lightweight, Load-Bearing PartsJul 11, 2026
- Machine VisionXiaomi, Alibaba DAMO Academy Drive Open-Source Robotics Model Ecosystem, Lowering Algorithm Development Barriers for Overseas SMEs Adopting Chinese Robotics SolutionsMar 30, 2026
- Cobots & ArmsShanxi 'AI+' Conference Showcases Embodied Intelligence with Multinational Buyer Engagement: Key Industry ImplicationsMar 30, 2026
Popular Tags
Recommended News
 Jul 11, 2026How to Specify Aerospace Carbon Fiber Assemblies for Lightweight, Load-Bearing PartsAerospace carbon fiber assemblies: learn how to specify laminate design, load data, joining methods, and inspection controls for lighter, reliable load-bearing aerospace parts.Elena Rostova (UAV Systems Researcher)
 Mar 30, 2026Xiaomi, Alibaba DAMO Academy Drive Open-Source Robotics Model Ecosystem, Lowering Algorithm Development Barriers for Overseas SMEs Adopting Chinese Robotics SolutionsXiaomi & Alibaba DAMO Academy's open-source robotics models lower algorithm barriers for global SMEs. Boost efficiency in manufacturing, logistics & smart retail with ROS 2 compatible solutions.TSV Data Lab
 Mar 30, 2026Shanxi 'AI+' Conference Showcases Embodied Intelligence with Multinational Buyer Engagement: Key Industry ImplicationsShanxi 'AI+' Conference highlights embodied intelligence with Tesla, Ubtech & Jiantao showcasing multimodal robotics. 40+ global buyers validated tech on-site, creating new B2B channels for industrial automation & AI solutions.Chen Wei (Automation Lead Engineer)
 Mar 30, 2026Zhongguancun Unveils 6G Integrated Sensing-Computing-Intelligence Platform to Empower Embodied Robots for Global Industrial ApplicationsZhongguancun's new 6G platform revolutionizes industrial robotics with <10ms latency, empowering global automotive, logistics & port automation. Discover how this tech boosts China's smart manufacturing exports.TSV Data Lab
 Mar 30, 2026Mech-Mind Tianjin Embodied Intelligence R&D and Production Base Goes Live, Cutting Delivery Time by 20%–30% for Global Customized AMR+Vision SolutionsMech-Mind's Tianjin AMR+Vision production base cuts delivery time by 20%-30% for欧美 & Latin American markets. Discover how this PLd-certified facility accelerates customized robotics solutions for smart manufacturing and logistics.Chen Wei (Automation Lead Engineer)
 Mar 30, 2026Boao Forum Reveals 'Co-evolution of Big and Small Brains' Trend in Humanoid Robots, China's Embodied Intelligence Accelerates Adaptation to Overseas Manufacturing Service ScenariosDiscover how China's humanoid robots, featuring 'Co-evolution of Big and Small Brains,' are revolutionizing global manufacturing. Learn about Embodied Tian Gong 3.0's ISO compliance and overseas deployment at Boao Forum 2026.Chen Wei (Automation Lead Engineer)
 Mar 30, 2026China Railway Industrial Secures Patent for Embodied Robotics in Material Handling, Boosting High-Precision Delivery Capabilities for Overseas Infrastructure and Manufacturing ProjectsChina Railway Industrial's new patent for embodied robotics in material handling boosts high-precision delivery for global infrastructure & manufacturing. Discover how this innovation enhances logistics accuracy in automotive, rail transit & EPC projects.Chen Wei (Automation Lead Engineer)
 Sep 29, 2026ISO 9283 Repeatability: How to Evaluate Cobot Positioning PerformanceISO 9283 cobot repeatability explained: learn how payload, reach, approach direction, and test conditions affect positioning performance and cell capability.Chen Wei (Automation Lead Engineer)
 Sep 28, 2026Spindle Runout Measurement in Germany: DIN Standards, Methods, and Acceptance LimitsSpindle runout measurement Germany: explore DIN standards, proven methods, acceptance limits, and audit-ready practices for reliable machining quality.Dr. Marcus Vance
 Sep 27, 2026How to Select Wall-Mount Edge Devices for Space-Constrained Factory NetworksWall mount edge devices for space-constrained factories: evaluate workload, thermal design, power resilience, cable access, and network reliability for smarter deployments.TSV Data Lab
 Sep 26, 2026Machining Tolerance Analysis: How to Set Limits That Meet Function and Cost TargetsMachining tolerance analysis: learn how to set functional limits, control tolerance stacks, reduce inspection risk, and balance precision with production cost.Dr. Marcus Vance
 Sep 25, 2026How to Evaluate an Industrial Infrastructure Data Platform for Multi-Site OperationsIndustrial infrastructure data platform evaluation guide for multi-site operations: compare data quality, edge resilience, interoperability, governance, and scalable proof-of-value criteria.Victor Lin (Chief Software Architect)
 Sep 24, 2026How to Select Machine Vision Optics for Accurate Inspection at Different Working DistancesMachine vision optics selection guide for accurate inspection at every working distance. Compare FOV, pixel scale, DOF, distortion, lighting, and telecentric options.TSV Data Lab
 Sep 23, 2026How to Evaluate a Machine Vision System Integrator for High-Speed Inspection LinesChoose a machine vision system integrator with proven expertise in high-speed inspection, reliable reject timing, robust optics, and measurable acceptance criteria.TSV Data Lab
 Sep 28, 2026When is a SCADA API the right choice for connecting plant systems?SCADA API guide: learn when governed plant data integration improves traceability, security, and scalability—without compromising real-time control.Victor Lin (Chief Software Architect)
 Sep 27, 2026How SCADA data integration improves traceability across production linesSCADA data integration connects production-line data to improve traceability, accelerate quality investigations, and strengthen safety decisions.Victor Lin (Chief Software Architect)
 Sep 26, 2026What to define before starting SCADA integration planningSCADA integration planning starts with clear scope, control boundaries, data models, cybersecurity, and testing. Discover the definitions that reduce risk and costly rework.Victor Lin (Chief Software Architect)
 Sep 25, 2026How a smart factory with Industrial IoT reduces production blind spotsDiscover how a smart factory with Industrial IoT turns real-time machine, quality, and workflow data into actionable insights that reduce production blind spots and delivery risks.Victor Lin (Chief Software Architect)
 Sep 24, 2026When does Industrial IoT make smart manufacturing easier to scale?Smart manufacturing Industrial IoT scales when trusted data, interoperable systems, and secure workflows turn connected assets into measurable gains.TSV Data Lab
 Sep 23, 2026What drives ultra-precision machining cost at 1-micron tolerance?Ultra precision machining cost per part at 1 micron tolerance depends on process, material, metrology, and yield. Learn how to compare quotes confidently.Dr. Marcus Vance
 Sep 22, 2026Drone Engine-T550CC Applications: Build the UAV Power System Around the MissionAn application guide for Drone Engine-T550CC integration, covering payload planning, airframe matching, cooling, fuel, vibration, test procedures, documentation, and service preparation.Elena Rostova (UAV Systems Researcher)
 Sep 22, 2026How to Evaluate Industrial Edge Computing Vendors for Factory DeploymentIndustrial edge computing vendor evaluation guide for factories: compare latency, protocol fit, reliability, security, and lifecycle support before deployment.TSV Data Lab
 Sep 21, 2026Drone Payload Integration: Matching Power, Data, and Center of Gravity for Reliable FlightsDrone payload integration made practical: balance power, data, center of gravity, and endurance to build safer, more reliable mission-ready flights.Elena Rostova (UAV Systems Researcher)
 Sep 20, 2026Autonomous Navigation Pricing: Cost Drivers and Budget Benchmarks for AMR ProjectsAutonomous navigation price explained: compare AMR cost drivers, software, sensors, integration, safety, and lifecycle budgets to build a scalable project plan.Chen Wei (Automation Lead Engineer)