
Predictive maintenance software for CNC and false alarms
Publication Date
author
For manufacturers evaluating predictive maintenance software for CNC, the real challenge is not collecting more machine data but reducing false alarms without missing early signs of failure. This article examines how signal quality, cnc controller interpolation cycle, industrial iot dashboard visualization, and mes integration with sap erp influence diagnostic accuracy, helping engineers, buyers, and decision-makers separate measurable performance from marketing noise.
In precision machining, a false alarm is not a minor software inconvenience. It can stop a spindle, interrupt a 6-hour production window, trigger unnecessary service calls, and reduce operator trust in the system within 2 to 4 weeks of deployment. On the other hand, a missed alarm may allow bearing wear, servo instability, or thermal drift to damage parts with tolerances measured in microns.
That is why the most useful predictive maintenance software for CNC is not the platform with the most colorful dashboard or the longest feature list. It is the one that converts machine, process, and controller data into reliable maintenance decisions under real shop-floor conditions. For procurement teams, that means evaluating measurable thresholds. For operators, it means fewer nuisance alerts. For plant leadership, it means lower unplanned downtime and a shorter path from pilot to ROI.
Why false alarms dominate CNC predictive maintenance projects
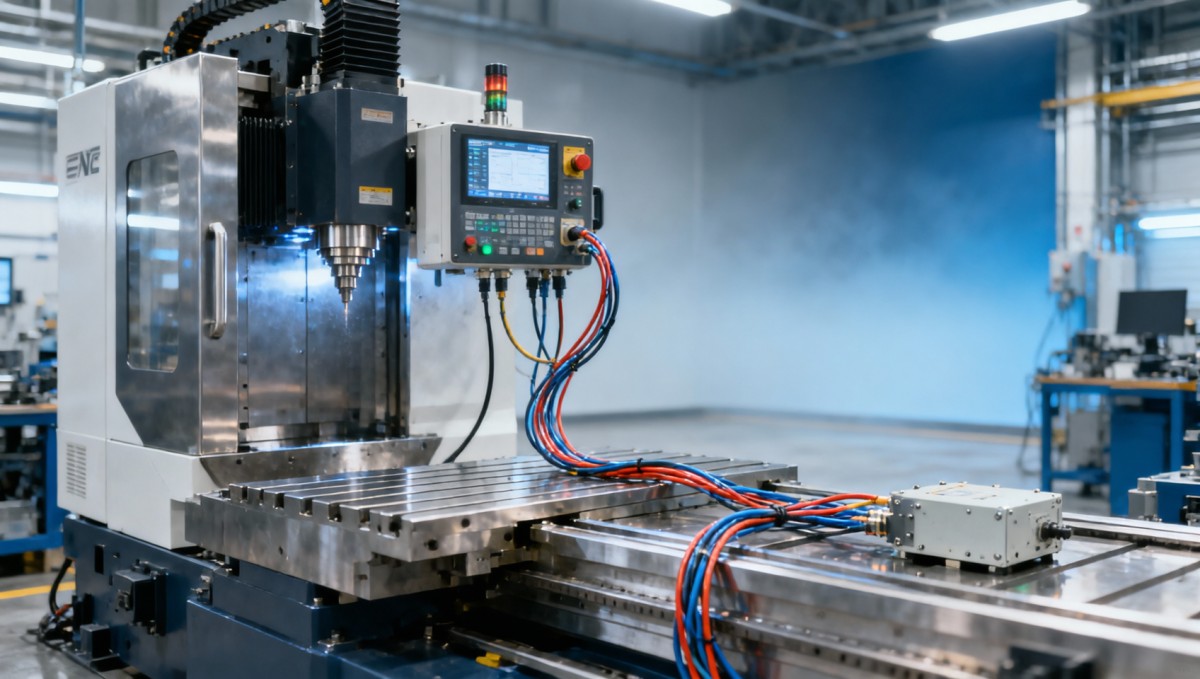
False alarms usually come from a mismatch between data quality and model expectations. A CNC machine can generate spindle load, vibration, current, temperature, axis following error, lubrication status, and alarm history every 10 milliseconds to 1 second depending on the source. But if sampling is inconsistent, time synchronization is poor, or thresholds are copied from a different machine family, the software may classify normal variation as a fault pattern.
This issue is especially common in mixed-machine environments where 3-axis, 5-axis, and turning centers are monitored under the same rule set. A spindle on a high-speed aluminum cell behaves differently from a spindle cutting hardened steel at lower RPM. If the system ignores material, toolpath type, coolant condition, and ambient temperature shifts of 5°C to 12°C, false positives rise quickly.
Operators also create an important feedback loop. If a system generates 8 to 15 low-value alerts per shift, the team starts treating all alerts as background noise. At that point, even a valid warning may be ignored. In practical terms, alarm quality matters more than alarm quantity. A plant is often better served by 2 accurate alerts per week than 25 generic notifications per day.
From a buyer’s perspective, vendors often emphasize AI, cloud analytics, or machine learning models without clearly stating their false alarm handling method. Yet the procurement risk is simple: if the software cannot separate process variation from machine degradation, the plant ends up paying for data infrastructure without operational trust.
Typical sources of false alarms
The most common causes can be grouped into sensing, context, and workflow problems. These are not abstract software defects; they are implementation choices that directly affect maintenance accuracy.
- Sensor noise or poor mounting, especially on vibration channels above 1 kHz.
- Missing production context such as tool change, part program switch, warm-up cycle, or maintenance mode.
- Static thresholds applied to variable duty cycles, for example identical spindle load limits across roughing and finishing operations.
- Weak data alignment between CNC, PLC, MES, and ERP timestamps, often drifting by 1 to 5 seconds.
What experienced teams measure first
Before evaluating advanced analytics, experienced manufacturing teams usually ask four baseline questions: How many alerts per machine per week are expected, what percentage are actionable, what is the average time from alert to inspection, and how often does the alert correspond to a confirmed issue? These four metrics are more informative than generic claims about intelligence.
Signal quality and controller timing: the hidden variables behind diagnostic accuracy
In CNC environments, signal quality is inseparable from controller timing. The cnc controller interpolation cycle, often measured in sub-millisecond to several milliseconds depending on architecture, determines how motion commands are processed and updated. If predictive maintenance software samples too slowly, it misses transient events. If it samples too quickly without context filtering, it may amplify harmless motion dynamics into false alarms.
A practical example is axis following error during aggressive contouring. Short spikes may be normal when the machine executes complex toolpaths, especially in 5-axis simultaneous motion. If the software treats every micro-deviation as a mechanical defect, alarm rates increase with production complexity rather than with machine health deterioration. That is analytically misleading and operationally expensive.
Signal conditioning matters just as much. Vibration data collected from a rigid spindle housing will have different characteristics from vibration data collected near a sheet-metal enclosure or a non-ideal mounting point. Sampling rate, filtering band, and synchronization with spindle speed all affect whether the software sees a useful pattern or pure noise. In many deployments, tuning these three parameters reduces nuisance alerts by 20% to 40% before any model retraining begins.
For plants sourcing software across multiple sites, the key lesson is clear: a vendor must explain not only what data it collects, but at what frequency, with what synchronization logic, and how it maps machine-state transitions. Without that, dashboard sophistication is irrelevant.
Data characteristics that should be validated during pilot testing
The table below highlights data factors that directly influence predictive maintenance software for CNC and false alarms during pilot rollout.
The main conclusion is that reliable diagnosis starts with disciplined signal engineering. Procurement teams should request pilot data schemas, timestamp methods, and sample-rate documentation before committing to a plant-wide rollout.
Minimum technical questions for vendors
- Which machine signals are native from the controller, and which are inferred or estimated?
- How is the cnc controller interpolation cycle incorporated into anomaly detection logic?
- What filtering methods are applied to high-frequency vibration or current signals?
- Can thresholds be configured by machine family, part type, and operating regime within 2 to 3 clicks for shop-floor teams?
Industrial IoT dashboards: visualization can reduce or amplify alarm fatigue
An industrial iot dashboard is often presented as a visibility layer, but in practice it is also a decision layer. Poor visualization causes operators to react to color changes instead of engineering relevance. A dashboard that shows every anomaly in the same visual priority can turn a maintenance system into a distraction engine. For CNC operations, the dashboard must distinguish between immediate machine risk, scheduled inspection, and informational deviation.
The best dashboard designs are role-based. Operators need machine-state context and next action guidance within 5 to 10 seconds. Maintenance technicians need trend overlays, event history, and condition progression over 7 to 30 days. Plant managers need line-level KPIs such as downtime minutes, alert closure rate, and recurring fault categories. One screen cannot serve all three groups equally well.
Visualization also affects trust. If the dashboard can show that spindle vibration increased 18% over the last 12 shifts while ambient temperature and material family remained stable, the alert feels evidence-based. If it only shows a red icon labeled “anomaly detected,” teams have little basis for action. In B2B buying terms, explainability is not optional; it is part of system usability.
For enterprises operating multiple facilities, dashboard governance becomes even more important. Plants often compare machine health scores across different machine models, duty cycles, and product mixes. Unless scoring logic is normalized, cross-site benchmarking can produce misleading conclusions and unfair maintenance priorities.
Features that separate a useful dashboard from a noisy one
The following comparison helps buyers evaluate industrial iot dashboard visualization in the context of CNC predictive maintenance.
In many CNC environments, dashboard redesign improves adoption faster than algorithm changes. When teams can see severity, context, and expected action in one place, the system becomes operational instead of decorative.
A practical dashboard rule
If an operator cannot tell within 10 seconds whether the alert requires stopping production, logging an inspection, or waiting for the next maintenance window, the dashboard is still underdesigned.
MES integration with SAP ERP: where maintenance intelligence becomes actionable
Predictive maintenance software for CNC becomes far more valuable when it is connected to execution and enterprise systems. MES integration with SAP ERP is not just an IT convenience. It determines whether an alert remains a visualization event or becomes a planned maintenance action with traceable cost, work order status, spare parts allocation, and production impact assessment.
Without MES and ERP integration, many plants rely on manual workflows: an alert appears, a supervisor sends a message, maintenance checks the machine, procurement looks for parts, and production planning reacts late. This can turn a 30-minute verification task into a 1- to 2-day disruption. Integration shortens that chain by linking condition alerts to machine availability, maintenance scheduling, and inventory logic.
The integration quality matters as much as the integration label. Some systems only export summary alarms once every few hours. Others can pass structured event data with timestamps, asset identifiers, and severity levels within near-real-time windows. For high-utilization CNC cells, the difference between 5-minute latency and 4-hour batch updates can determine whether maintenance occurs during a planned stop or during a production loss event.
Enterprise buyers should also verify how closed-loop feedback works. If a maintenance team confirms that an alert was false due to a tool change or an atypical job, can that result be fed back into the model or rule set? A system that learns from work-order outcomes is much more likely to reduce false alarms over the first 90 to 180 days.
What procurement and operations should verify before rollout
The checklist below is useful when evaluating mes integration with sap erp for CNC maintenance workflows.
A well-integrated environment does more than detect possible faults. It helps the organization decide who acts, when they act, what parts are needed, and whether the maintenance event should be tied to quality containment, scheduling, or supplier follow-up.
Implementation sequence that works in practice
- Start with 3 to 10 critical machines where downtime cost is clearly visible.
- Validate signal integrity and alert logic for 30 to 60 days before wider rollout.
- Connect alerts to MES maintenance events and production status.
- Extend to SAP ERP for work orders, spare parts, and cost traceability.
- Review false positive rate and confirmed failure capture every month for the first quarter.
How to choose predictive maintenance software for CNC without buying dashboard theater
A sound buying process should focus on measurable operational fit rather than broad digital transformation messaging. For most enterprises, evaluation should combine engineering, maintenance, IT, procurement, and plant management. If any of these groups are excluded, the software may pass a demo but fail in daily use. The right question is not “Does it use AI?” but “Can it reduce unplanned downtime and nuisance alerts on our machine mix within a defined period?”
A realistic pilot target might include a 15% to 30% reduction in nuisance alerts, a documented reduction in diagnostic time, and improved maintenance scheduling accuracy over 60 to 90 days. These are practical benchmarks because they are tied to workflow outcomes rather than abstract innovation language. Buyers should also ask how the system performs on legacy CNC assets, not only on newer connected machines.
Vendor transparency is a strong differentiator. Serious suppliers can explain where their models work well, where they need baseline learning periods of 2 to 6 weeks, and which conditions require customer-side process labeling. Less mature suppliers often overpromise universal coverage while underexplaining setup assumptions. In precision manufacturing, vague claims are procurement risk.
For organizations aligned with the TSV mindset of engineering truth through data, the selection process should prioritize traceable performance: signal definitions, false alarm handling, integration method, workflow impact, and evidence of maintainability. Those parameters determine long-term value.
Shortlist criteria for buyers
- Supports heterogeneous CNC fleets, including older machines with limited native connectivity.
- Uses machine-state context so roughing, finishing, warm-up, and idle states are not treated identically.
- Provides explainable alerts with trend evidence, not just anomaly flags.
- Offers clear paths for MES integration with SAP ERP and maintenance workflow closure.
- Allows site-level and machine-family-level tuning within normal plant governance practices.
FAQ: common buying and deployment questions
How long should a meaningful pilot last? In most CNC environments, 30 days is enough to test connectivity, but 60 to 90 days gives a better view of shift variation, part mix changes, and maintenance response quality.
Which machines should be included first? Start with bottleneck assets, machines with historical spindle or servo issues, or equipment where one hour of downtime has a clear cost impact. Avoid beginning with the easiest machine if it is not business critical.
Can false alarms be eliminated completely? No credible vendor should promise that. The realistic goal is to reduce nuisance alerts while preserving early fault sensitivity, then improve precision through feedback, operating context, and threshold tuning.
Does more data always improve results? Not necessarily. Additional channels help only if they are synchronized, relevant, and interpretable. Poor-quality data at high volume often makes diagnosis worse, not better.
Predictive maintenance software for CNC should be judged by one standard: whether it helps the plant act earlier with fewer false alarms and better coordination across operations, maintenance, and enterprise systems. Signal quality, cnc controller interpolation cycle awareness, industrial iot dashboard visualization, and mes integration with sap erp are not secondary details. They are the foundations of diagnostic credibility.
For engineers, the priority is trustworthy condition interpretation. For operators, it is alert clarity and low disruption. For procurement and leadership teams, it is measurable risk reduction and deployable ROI. If you are comparing platforms, build your shortlist around data fidelity, explainability, workflow integration, and pilot evidence rather than marketing claims.
If your organization needs a more rigorous framework for evaluating CNC predictive maintenance solutions, benchmarking signal assumptions, or defining procurement-ready technical criteria, contact us to discuss a tailored assessment and explore more data-driven manufacturing solutions.
Search News
Hot Articles
- Carbon Fiber StructuresHow to Specify Aerospace Carbon Fiber Assemblies for Lightweight, Load-Bearing PartsJul 11, 2026
- Machine VisionXiaomi, Alibaba DAMO Academy Drive Open-Source Robotics Model Ecosystem, Lowering Algorithm Development Barriers for Overseas SMEs Adopting Chinese Robotics SolutionsMar 30, 2026
- Cobots & ArmsShanxi 'AI+' Conference Showcases Embodied Intelligence with Multinational Buyer Engagement: Key Industry ImplicationsMar 30, 2026
Popular Tags
Recommended News
 Jul 11, 2026How to Specify Aerospace Carbon Fiber Assemblies for Lightweight, Load-Bearing PartsAerospace carbon fiber assemblies: learn how to specify laminate design, load data, joining methods, and inspection controls for lighter, reliable load-bearing aerospace parts.Elena Rostova (UAV Systems Researcher)
 Mar 30, 2026Xiaomi, Alibaba DAMO Academy Drive Open-Source Robotics Model Ecosystem, Lowering Algorithm Development Barriers for Overseas SMEs Adopting Chinese Robotics SolutionsXiaomi & Alibaba DAMO Academy's open-source robotics models lower algorithm barriers for global SMEs. Boost efficiency in manufacturing, logistics & smart retail with ROS 2 compatible solutions.TSV Data Lab
 Mar 30, 2026Shanxi 'AI+' Conference Showcases Embodied Intelligence with Multinational Buyer Engagement: Key Industry ImplicationsShanxi 'AI+' Conference highlights embodied intelligence with Tesla, Ubtech & Jiantao showcasing multimodal robotics. 40+ global buyers validated tech on-site, creating new B2B channels for industrial automation & AI solutions.Chen Wei (Automation Lead Engineer)
 Mar 30, 2026Zhongguancun Unveils 6G Integrated Sensing-Computing-Intelligence Platform to Empower Embodied Robots for Global Industrial ApplicationsZhongguancun's new 6G platform revolutionizes industrial robotics with <10ms latency, empowering global automotive, logistics & port automation. Discover how this tech boosts China's smart manufacturing exports.TSV Data Lab
 Mar 30, 2026Mech-Mind Tianjin Embodied Intelligence R&D and Production Base Goes Live, Cutting Delivery Time by 20%–30% for Global Customized AMR+Vision SolutionsMech-Mind's Tianjin AMR+Vision production base cuts delivery time by 20%-30% for欧美 & Latin American markets. Discover how this PLd-certified facility accelerates customized robotics solutions for smart manufacturing and logistics.Chen Wei (Automation Lead Engineer)
 Mar 30, 2026Boao Forum Reveals 'Co-evolution of Big and Small Brains' Trend in Humanoid Robots, China's Embodied Intelligence Accelerates Adaptation to Overseas Manufacturing Service ScenariosDiscover how China's humanoid robots, featuring 'Co-evolution of Big and Small Brains,' are revolutionizing global manufacturing. Learn about Embodied Tian Gong 3.0's ISO compliance and overseas deployment at Boao Forum 2026.Chen Wei (Automation Lead Engineer)
 Mar 30, 2026China Railway Industrial Secures Patent for Embodied Robotics in Material Handling, Boosting High-Precision Delivery Capabilities for Overseas Infrastructure and Manufacturing ProjectsChina Railway Industrial's new patent for embodied robotics in material handling boosts high-precision delivery for global infrastructure & manufacturing. Discover how this innovation enhances logistics accuracy in automotive, rail transit & EPC projects.Chen Wei (Automation Lead Engineer)
 Oct 14, 2026Drone Frame Composites: Carbon Fiber vs. Fiberglass for Weight and StiffnessExplore drone structural materials composites: compare carbon fiber and fiberglass for weight, stiffness, cost, and antenna compatibility. Find the right material for your drone frame.Elena Rostova (UAV Systems Researcher)
 Oct 13, 2026Smart Cameras vs. PC-Based Machine Vision: Which Fits High-Speed Inspection?This industrial product comparison for machine vision weighs smart cameras vs. PC-based systems on latency, throughput, and cost. Discover your best fit for high-speed inspection.TSV Data Lab
 Oct 12, 2026How to Verify RoHS Compliance in Industrial Sensing Systems Before DeploymentRoHS compliant sensing systems: learn how to verify materials, supplier declarations, testing, and configuration controls before industrial deployment.TSV Data Lab
 Oct 11, 2026How Procurement-Oriented Content Taxonomy Improves B2B Buying JourneysProcurement-oriented content taxonomy streamlines B2B buying journeys with clearer evidence, supplier comparisons, risk visibility, and faster approvals.TSV Data Lab
 Oct 10, 2026How to Select a Machine Performance Monitoring Platform for OEE and Downtime ReductionMachine performance monitoring platform selection guide: validate machine states, OEE data, downtime reasons, integrations, and scalability to reduce losses with confidence.TSV Data Lab
 Oct 08, 2026How to Machine Inconel 625 Blades Without Heat Cracks or Edge ChippingInconel 625 blade machining guide: prevent heat cracks, edge chipping, chatter, and work hardening with proven tooling, cooling, fixturing, and inspection strategies.Dr. Marcus Vance
 Oct 07, 2026How to Evaluate an HMI Panel Distributor for Industrial Automation ProjectsHMI panel distributor evaluation guide: verify technical compatibility, traceability, supply reliability, lifecycle support, and total cost for automation projects.Victor Lin (Chief Software Architect)
 Oct 06, 2026Navigation Fault Tolerance Standards for AMRs: What Safety Teams Must VerifyNavigation fault tolerance standards: learn what AMR safety teams must verify, from localization loss and sensor faults to stopping distance, safe restart, and site-specific validation.Chen Wei (Automation Lead Engineer)
 Oct 05, 2026Calculating Edge Computing Total Cost of Ownership Across Distributed SitesEdge computing ownership cost explained: calculate deployment, energy, connectivity, security, remote support, and refresh costs across distributed sites.TSV Data Lab
 Oct 04, 2026CAD/CAM Benchmarking in the GCC: What Manufacturers Should Ask a ConsultantCAD CAM benchmark consultant GCC guide: learn the key questions manufacturers should ask to validate post-processors, workflows, machine performance, and production risk.Victor Lin (Chief Software Architect)
 Oct 03, 2026Selecting Automotive Radar Sensor Modules for ADAS Range, Resolution, and IntegrationAutomotive radar sensor module selection guide for ADAS: compare range, resolution, field of view, latency, and integration to build safer, reliable vehicle systems.TSV Data Lab
 Oct 02, 2026How to Qualify Machined Parts Suppliers for Hard Tech ProgramsHard tech supply chain machined parts demand rigorous supplier qualification. Learn how to assess capability, traceability, quality controls, and delivery resilience.Dr. Marcus Vance
 Oct 01, 2026How to Select an Outdoor Security Radar Sensor for Perimeter Detection?Outdoor security radar sensor selection guide: compare range, accuracy, false-alarm control, integration, and field testing for reliable perimeter detection.TSV Data Lab
 Sep 30, 2026How to Evaluate Solid-State LiDAR Hardware for Outdoor Autonomous VehiclesSolid state LiDAR hardware evaluation guide for outdoor autonomous vehicles—compare range, point-cloud quality, environmental resilience, integration, and safety.TSV Data Lab
 Sep 29, 2026ISO 9283 Repeatability: How to Evaluate Cobot Positioning PerformanceISO 9283 cobot repeatability explained: learn how payload, reach, approach direction, and test conditions affect positioning performance and cell capability.Chen Wei (Automation Lead Engineer)
 Oct 14, 2026How tight can micro machining aerospace tolerances be in production?Micro machining aerospace tolerances can reach low-micron levels in production. Learn what controls repeatability, inspection confidence, and flight-critical quality.Dr. Marcus Vance
 Oct 13, 2026How to keep an industrial robotic integration project on scheduleIndustrial robotic integration project management: keep automation on schedule with proven controls for interfaces, suppliers, FAT, commissioning, and change risk.Victor Lin (Chief Software Architect)























