
Precision Grinding Surface Roughness What Numbers Actually Affect Fit
Publication Date
author
In precision manufacturing, precision grinding surface roughness is not just a finish metric—it directly affects fit, sealing, friction, wear, and assembly stability. For buyers, engineers, and operators working across precision grinding for aerospace bearings, custom machining for robotics joints, and micro machining for optical components, understanding which roughness numbers truly matter is essential to avoiding costly tolerance mismatches and performance failures.
Which precision grinding surface roughness numbers actually affect fit?
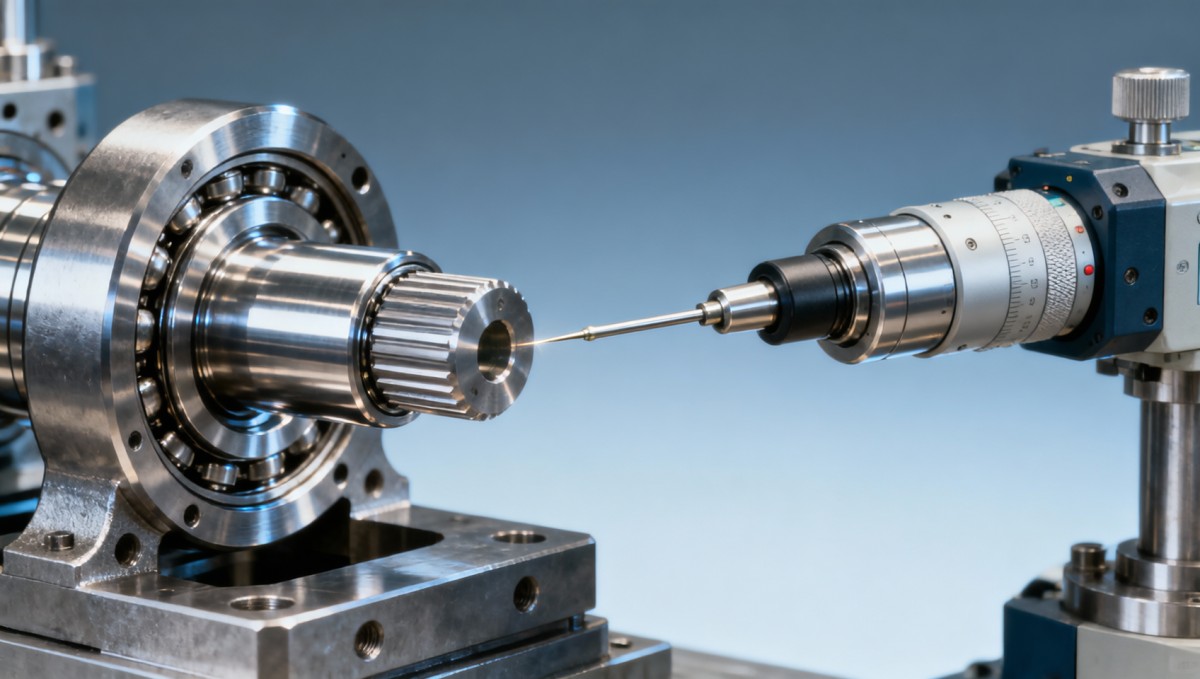
Many sourcing discussions focus on a single roughness value, usually Ra. That shortcut creates risk. In real assemblies, precision grinding surface roughness affects contact ratio, lubrication behavior, sealing integrity, and the way load transfers across a mating surface. A shaft-ground journal at Ra 0.2 µm and another at Ra 0.8 µm may both look polished, yet they can behave very differently in a bearing seat, hydraulic interface, or robotic pivot.
For information researchers and procurement teams, the first practical point is this: roughness numbers matter only in relation to fit type, material pair, operating speed, and tolerance band. A loose sliding fit, an interference fit, and a sealing face do not respond to the same finish target. In many shops, the critical range for precision ground functional surfaces falls between Ra 0.1 µm and Ra 1.6 µm, but the correct value inside that range depends on the application rather than appearance alone.
Operators often see roughness as a post-process inspection item. Decision-makers should treat it as a system variable. Surface texture influences whether a press fit grips consistently, whether a seal lip retains lubricant over 500 to 2,000 operating hours, and whether repeated assembly cycles damage a mating bore. That is why TSV emphasizes engineering truth through measurable parameters instead of vague claims about “smooth finish” or “high quality grinding.”
A second point often missed is that roughness alone does not equal waviness, lay, or form accuracy. Two parts can share the same Ra reading but produce different fit outcomes because peak density, directional lay, or roundness error is different. For high-value B2B procurement, the right question is not “What finish can you achieve?” but “Which roughness parameters are controlled, how are they measured, and how do they relate to the tolerance stack?”
Why Ra is important, but not enough
Ra, the arithmetic average roughness, remains the most widely specified value because it is simple and broadly recognized. It is useful for screening general surface finish levels during supplier qualification. However, Ra compresses the entire profile into a single average. It does not tell a buyer whether the surface has sharp peaks that may wear off during first assembly or deep valleys that can support oil retention.
For fits that must balance retention and assembly force, other parameters become meaningful. Rz can help identify peak-to-valley variation. In sealing or fatigue-sensitive parts, a lower peak height may matter more than a low average roughness. For functional evaluation, engineering teams often review at least 3 categories together: average roughness, profile height distribution, and geometry error such as cylindricity or flatness.
Core roughness metrics that influence fit decisions
- Ra: Useful for baseline specification and quick supplier comparison, especially in drawings for shafts, seats, and general precision grinding.
- Rz: More sensitive to high peaks and deep valleys, helpful where insertion force, seal contact, or surface damage risk must be checked.
- Rt or total profile height: Relevant when isolated extremes can trigger leakage, local stress, or early wear.
- Lay direction and waviness: Important in dynamic seals, sliding interfaces, and optical or metrology-related surfaces where directionality changes performance.
How roughness changes performance across aerospace, robotics, and micro machining
The same precision grinding surface roughness target does not serve every industry segment. Aerospace bearing seats, robotic joint pins, medical-grade shafts, and optical component interfaces experience different motion profiles, loading conditions, and contamination risks. A practical evaluation should connect the roughness requirement to the function of the mating pair, not just the machine capability of the supplier.
In aerospace-related applications, fit reliability under thermal cycling and vibration is often more important than visual smoothness. Ground surfaces may need tight coordination between dimensional tolerance, roundness, and roughness to avoid micro-movement under load. In robotic joints, friction stability and repeatability matter. Too rough a surface can increase wear and backlash growth; too smooth a surface may alter lubrication behavior or retention characteristics depending on the design.
In micro machining and optical component support structures, very low roughness values are often requested, but not always for the same reason. Sometimes the goal is low scatter, stable contact, or reduced particle generation during assembly. Other times, the roughness target is simply inherited from a legacy drawing and may be stricter than needed. That is where data-based review can reduce both cost and overprocessing.
For procurement teams comparing vendors across 2 to 4 candidate process routes, surface roughness should be reviewed alongside material hardness, grinding wheel strategy, coolant control, and measurement method. A part quoted with Ra 0.2 µm from one supplier may not be equivalent to another unless the inspection cutoff, sampling length, and fixturing conditions are aligned.
Typical application ranges and what they mean
The table below summarizes typical functional interpretations of precision grinding surface roughness ranges. These are general engineering ranges rather than universal rules, and they should always be verified against the fit, material, speed, and compliance requirements of the final assembly.
These ranges show why “lower is always better” is a poor rule. A surface refined from Ra 0.4 µm to Ra 0.1 µm may increase grinding time, inspection cost, and scrap exposure without improving function. In some cases, it can even shift lubrication or retention behavior in ways the drawing owner did not intend.
Where users and operators feel the difference first
Operators usually detect a wrong surface finish before managers see the cost impact. Common field symptoms include unstable insertion force, stick-slip motion, premature seal marking, heat rise during run-in, and inconsistent torque after assembly. These signals often appear within the first 10 to 50 cycles of testing, long before a formal failure report is issued.
For that reason, TSV recommends linking roughness review to actual use conditions: dry assembly versus lubricated assembly, low-speed indexing versus continuous rotation, and ambient room use versus high-temperature service. Surface numbers become decision-ready only when tied to the operating scenario.
What should buyers compare when evaluating grinding suppliers?
For procurement professionals, the most expensive mistake is comparing precision grinding quotes on price and Ra alone. Supplier A may promise Ra 0.2 µm but measure it on a short sample length with favorable setup. Supplier B may quote Ra 0.4 µm but control cylindricity, burn risk, and process repeatability much better. If the part is used in aerospace, robotics, or medical-adjacent assemblies, those differences directly affect qualification time and downstream risk.
A robust RFQ should ask for at least 5 checks: controlled roughness metric, tolerance capability, measurement method, material-specific process experience, and inspection reporting format. Where applicable, buyers should also request whether the surface is plunge ground, traverse ground, lapped, honed, or superfinished after grinding. Different routes can produce similar average roughness but different functional behavior.
Lead time also matters. A general precision ground part may move from process planning to delivery in 7 to 15 working days for prototype batches, while tighter surfaces requiring extra spark-out, post-process inspection, or controlled environmental measurement may extend to 2 to 4 weeks. Buyers should clarify whether the quoted schedule includes first article inspection, profile measurement, and packaging requirements that protect the finished surface.
At TSV, we encourage supplier evaluation through parameter transparency. In hard-tech procurement, terms like “fine finish” do not shorten qualification cycles. Inspection traceability, profile clarity, and application-fit relevance do.
Procurement checklist for functional surface finish
The following comparison table helps teams screen grinding suppliers beyond marketing language and focus on what actually affects fit, assembly, and validation outcomes.
This checklist helps procurement teams reduce supplier qualification loops. It also supports internal alignment between engineering, quality, and purchasing by translating a surface finish requirement into inspectable and comparable decision points.
Three questions to ask before approving a quote
- Is the specified precision grinding surface roughness linked to actual function, or copied from a legacy drawing without review?
- Will the supplier provide inspection data that covers both roughness and geometry, especially for close-tolerance fits such as H7/g6 or interference assemblies?
- Does the quoted lead time include validation steps such as sample approval, first article documentation, and packaging control for finished surfaces?
Common mistakes: when a low roughness number still leads to poor fit
A low surface roughness value can create false confidence. One common mistake is specifying an aggressive Ra target while ignoring tolerance interaction. If a shaft is undersized by a few microns, achieving Ra 0.1 µm will not restore the intended fit. Another mistake is requiring a very smooth surface on a part that depends on lubricant retention or controlled bedding during first operation.
Another frequent issue is measurement inconsistency. A supplier may inspect along the lay direction while another measures across it, generating different values for the same nominal surface. This matters in grinding because the directional pattern can influence friction and sealing. For critical projects, teams should define not only the target value but also the measurement orientation and reporting format.
There is also a cost trap. Pursuing ultra-low roughness on every precision component increases process time, wheel wear, inspection effort, and rejection risk. In many industrial programs, the better decision is to classify surfaces into 3 groups: functional critical, assembly related, and cosmetic or non-critical. Only the first group should receive the tightest grinding and inspection controls.
TSV sees this pattern across hard-tech supply chains: vague finish requirements slow down procurement, while overstrict finish requirements inflate cost without improving performance. Better specifications shorten trial-and-error loops and help both buyers and suppliers focus on meaningful controls.
FAQ and practical clarifications
Is Ra the best number for interference fits?
Ra is a useful starting point, but interference fits often need more than an average value. Peak height distribution and geometry control can influence real contact and insertion force. If the assembly is sensitive, combine Ra with Rz and dimensional data, especially when tolerance bands are in the low-micron range.
How smooth should a precision ground shaft be for bearings?
Many bearing seat applications operate in a practical range around Ra 0.1–0.4 µm, but the correct value depends on bearing type, fit class, rotational speed, and material. The roughness target should be reviewed together with roundness and size tolerance, not treated as a standalone requirement.
Does lower roughness always reduce friction?
No. Friction depends on contact mechanics, material pairing, lubrication, load, and speed. In some sliding systems, an extremely smooth surface may reduce oil retention or change running behavior. Functional testing under realistic operating conditions is more reliable than assuming the lowest number is automatically better.
What documents should buyers request with a precision grinding order?
For critical components, buyers should request drawing confirmation, roughness definition, measurement method, dimensional inspection results, and where needed, first article or process capability evidence. For regulated sectors, additional traceability and packaging controls may also be necessary.
Why data-driven evaluation matters before sourcing or redesign
When teams source precision ground parts globally, information noise becomes a real commercial risk. Suppliers may use similar language but control very different process variables. TSV’s approach is to strip decisions back to measurable engineering truth: what roughness parameter is being promised, how it is inspected, what tolerance it supports, and whether it matches the functional load case.
For R&D engineers, this reduces redesign cycles. For operators, it reduces assembly variability. For procurement leaders, it shortens supplier qualification by focusing technical reviews on 4 practical domains: fit function, measurement credibility, process stability, and compliance readiness. This is especially important when comparing suppliers across robotics, aerospace, sensor hardware, and other precision machining benchmarks.
If you are reviewing a drawing, RFQ, or supplier sample for precision grinding surface roughness, we can help you evaluate whether the specified numbers are functionally justified, commercially efficient, and inspection-ready. Discussion topics can include parameter confirmation, roughness versus fit relationship, process route comparison, sample review, expected lead time, and documentation requirements for qualification.
Contact TSV when you need a clearer basis for product selection, supplier screening, custom machining decisions, or benchmarking across hard-tech supply chains. The most useful conversation starts with concrete data: the fit type, target roughness range, material, tolerance band, application load, and required delivery window. From there, engineering judgment becomes faster, cleaner, and easier to defend.
Search News
Hot Articles
- Carbon Fiber StructuresHow to Specify Aerospace Carbon Fiber Assemblies for Lightweight, Load-Bearing PartsJul 11, 2026
- Machine VisionXiaomi, Alibaba DAMO Academy Drive Open-Source Robotics Model Ecosystem, Lowering Algorithm Development Barriers for Overseas SMEs Adopting Chinese Robotics SolutionsMar 30, 2026
- Cobots & ArmsShanxi 'AI+' Conference Showcases Embodied Intelligence with Multinational Buyer Engagement: Key Industry ImplicationsMar 30, 2026
Popular Tags
Recommended News
 Jul 11, 2026How to Specify Aerospace Carbon Fiber Assemblies for Lightweight, Load-Bearing PartsAerospace carbon fiber assemblies: learn how to specify laminate design, load data, joining methods, and inspection controls for lighter, reliable load-bearing aerospace parts.Elena Rostova (UAV Systems Researcher)
 Mar 30, 2026Xiaomi, Alibaba DAMO Academy Drive Open-Source Robotics Model Ecosystem, Lowering Algorithm Development Barriers for Overseas SMEs Adopting Chinese Robotics SolutionsXiaomi & Alibaba DAMO Academy's open-source robotics models lower algorithm barriers for global SMEs. Boost efficiency in manufacturing, logistics & smart retail with ROS 2 compatible solutions.TSV Data Lab
 Mar 30, 2026Shanxi 'AI+' Conference Showcases Embodied Intelligence with Multinational Buyer Engagement: Key Industry ImplicationsShanxi 'AI+' Conference highlights embodied intelligence with Tesla, Ubtech & Jiantao showcasing multimodal robotics. 40+ global buyers validated tech on-site, creating new B2B channels for industrial automation & AI solutions.Chen Wei (Automation Lead Engineer)
 Mar 30, 2026Zhongguancun Unveils 6G Integrated Sensing-Computing-Intelligence Platform to Empower Embodied Robots for Global Industrial ApplicationsZhongguancun's new 6G platform revolutionizes industrial robotics with <10ms latency, empowering global automotive, logistics & port automation. Discover how this tech boosts China's smart manufacturing exports.TSV Data Lab
 Mar 30, 2026Mech-Mind Tianjin Embodied Intelligence R&D and Production Base Goes Live, Cutting Delivery Time by 20%–30% for Global Customized AMR+Vision SolutionsMech-Mind's Tianjin AMR+Vision production base cuts delivery time by 20%-30% for欧美 & Latin American markets. Discover how this PLd-certified facility accelerates customized robotics solutions for smart manufacturing and logistics.Chen Wei (Automation Lead Engineer)
 Mar 30, 2026Boao Forum Reveals 'Co-evolution of Big and Small Brains' Trend in Humanoid Robots, China's Embodied Intelligence Accelerates Adaptation to Overseas Manufacturing Service ScenariosDiscover how China's humanoid robots, featuring 'Co-evolution of Big and Small Brains,' are revolutionizing global manufacturing. Learn about Embodied Tian Gong 3.0's ISO compliance and overseas deployment at Boao Forum 2026.Chen Wei (Automation Lead Engineer)
 Mar 30, 2026China Railway Industrial Secures Patent for Embodied Robotics in Material Handling, Boosting High-Precision Delivery Capabilities for Overseas Infrastructure and Manufacturing ProjectsChina Railway Industrial's new patent for embodied robotics in material handling boosts high-precision delivery for global infrastructure & manufacturing. Discover how this innovation enhances logistics accuracy in automotive, rail transit & EPC projects.Chen Wei (Automation Lead Engineer)
 Oct 14, 2026Drone Frame Composites: Carbon Fiber vs. Fiberglass for Weight and StiffnessExplore drone structural materials composites: compare carbon fiber and fiberglass for weight, stiffness, cost, and antenna compatibility. Find the right material for your drone frame.Elena Rostova (UAV Systems Researcher)
 Oct 13, 2026Smart Cameras vs. PC-Based Machine Vision: Which Fits High-Speed Inspection?This industrial product comparison for machine vision weighs smart cameras vs. PC-based systems on latency, throughput, and cost. Discover your best fit for high-speed inspection.TSV Data Lab
 Oct 12, 2026How to Verify RoHS Compliance in Industrial Sensing Systems Before DeploymentRoHS compliant sensing systems: learn how to verify materials, supplier declarations, testing, and configuration controls before industrial deployment.TSV Data Lab
 Oct 11, 2026How Procurement-Oriented Content Taxonomy Improves B2B Buying JourneysProcurement-oriented content taxonomy streamlines B2B buying journeys with clearer evidence, supplier comparisons, risk visibility, and faster approvals.TSV Data Lab
 Oct 10, 2026How to Select a Machine Performance Monitoring Platform for OEE and Downtime ReductionMachine performance monitoring platform selection guide: validate machine states, OEE data, downtime reasons, integrations, and scalability to reduce losses with confidence.TSV Data Lab
 Oct 08, 2026How to Machine Inconel 625 Blades Without Heat Cracks or Edge ChippingInconel 625 blade machining guide: prevent heat cracks, edge chipping, chatter, and work hardening with proven tooling, cooling, fixturing, and inspection strategies.Dr. Marcus Vance
 Oct 07, 2026How to Evaluate an HMI Panel Distributor for Industrial Automation ProjectsHMI panel distributor evaluation guide: verify technical compatibility, traceability, supply reliability, lifecycle support, and total cost for automation projects.Victor Lin (Chief Software Architect)
 Oct 06, 2026Navigation Fault Tolerance Standards for AMRs: What Safety Teams Must VerifyNavigation fault tolerance standards: learn what AMR safety teams must verify, from localization loss and sensor faults to stopping distance, safe restart, and site-specific validation.Chen Wei (Automation Lead Engineer)
 Oct 05, 2026Calculating Edge Computing Total Cost of Ownership Across Distributed SitesEdge computing ownership cost explained: calculate deployment, energy, connectivity, security, remote support, and refresh costs across distributed sites.TSV Data Lab
 Oct 04, 2026CAD/CAM Benchmarking in the GCC: What Manufacturers Should Ask a ConsultantCAD CAM benchmark consultant GCC guide: learn the key questions manufacturers should ask to validate post-processors, workflows, machine performance, and production risk.Victor Lin (Chief Software Architect)
 Oct 03, 2026Selecting Automotive Radar Sensor Modules for ADAS Range, Resolution, and IntegrationAutomotive radar sensor module selection guide for ADAS: compare range, resolution, field of view, latency, and integration to build safer, reliable vehicle systems.TSV Data Lab
 Oct 02, 2026How to Qualify Machined Parts Suppliers for Hard Tech ProgramsHard tech supply chain machined parts demand rigorous supplier qualification. Learn how to assess capability, traceability, quality controls, and delivery resilience.Dr. Marcus Vance
 Oct 01, 2026How to Select an Outdoor Security Radar Sensor for Perimeter Detection?Outdoor security radar sensor selection guide: compare range, accuracy, false-alarm control, integration, and field testing for reliable perimeter detection.TSV Data Lab
 Sep 30, 2026How to Evaluate Solid-State LiDAR Hardware for Outdoor Autonomous VehiclesSolid state LiDAR hardware evaluation guide for outdoor autonomous vehicles—compare range, point-cloud quality, environmental resilience, integration, and safety.TSV Data Lab
 Sep 29, 2026ISO 9283 Repeatability: How to Evaluate Cobot Positioning PerformanceISO 9283 cobot repeatability explained: learn how payload, reach, approach direction, and test conditions affect positioning performance and cell capability.Chen Wei (Automation Lead Engineer)
 Oct 14, 2026How tight can micro machining aerospace tolerances be in production?Micro machining aerospace tolerances can reach low-micron levels in production. Learn what controls repeatability, inspection confidence, and flight-critical quality.Dr. Marcus Vance
 Oct 13, 2026How to keep an industrial robotic integration project on scheduleIndustrial robotic integration project management: keep automation on schedule with proven controls for interfaces, suppliers, FAT, commissioning, and change risk.Victor Lin (Chief Software Architect)























