RTOS benchmark results that hide scheduling problems
Publication Date
author
Many real time operating system rtos benchmark reports celebrate context-switch speed and interrupt latency, yet overlook the scheduling failures that surface in real factories. For engineers, buyers, and decision-makers comparing edge AI inference latency industrial workloads, opc ua server response time, or ethercat cycle time benchmark data, this article shows how polished numbers can mask priority inversion, jitter, and deadline misses that directly impact control reliability.
That gap matters because an RTOS is rarely purchased, qualified, or integrated for a single synthetic test. It is selected to sustain mixed workloads: motion control at 250 μs to 1 ms cycles, OPC UA communication in parallel with data logging, edge vision inference bursts, and fault handling under abnormal I/O load. A benchmark that looks impressive in isolation can still fail when the scheduler meets real contention.
For TSV’s audience, the practical question is not which benchmark chart has the smallest number. The real question is which benchmark reveals whether the platform can keep deadlines when interrupts stack, shared resources block, and network traffic peaks. That distinction affects machine uptime, procurement risk, and the cost of post-deployment debugging.
Why Popular RTOS Benchmarks Often Miss the Real Scheduling Story
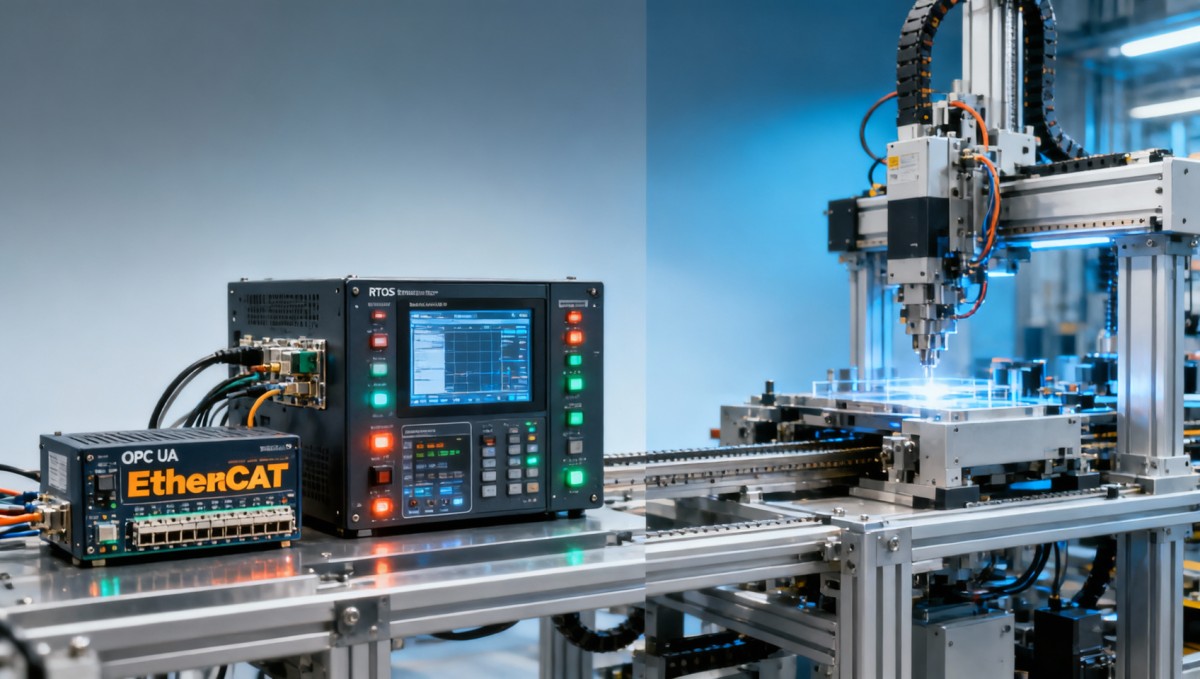
A large share of RTOS benchmark results are built around two attractive metrics: interrupt latency and context-switch time. These are useful, but they are incomplete. A reported 2 μs interrupt latency or a 600 ns task switch does not prove the scheduler will behave correctly when 8 to 12 tasks compete for CPU time, memory buses, DMA completion events, and shared locks.
In factory and edge environments, scheduling quality is shaped by more than raw speed. It depends on priority inheritance, timer granularity, preemption behavior, interrupt nesting policy, CPU affinity on SMP systems, and what happens when one low-priority task holds a resource needed by a high-priority control loop. A benchmark that does not create contention can hide a serious priority inversion problem.
Another issue is test duration. A 30-second benchmark may look clean, while a 72-hour soak test reveals burst jitter every 15 to 20 minutes under logging, diagnostics, or network polling. For buyers evaluating industrial controllers, gateways, or machine vision nodes, the long-tail behavior matters more than the single best-case number displayed on a product sheet.
This is especially relevant in mixed-criticality systems. A PLC-adjacent controller may run a hard real-time motion task at 500 μs, a soft real-time HMI update at 50 ms, and background file writes every few seconds. If the benchmark isolates only the control task, the scheduler appears stable. Once all services are enabled, missed deadlines may rise from 0 to 5 per hour, which is unacceptable in synchronized automation cells.
Common Benchmark Design Shortcuts
The following shortcuts frequently produce optimistic RTOS benchmark results that are hard to trust for procurement or system design decisions.
- Single-core tests that do not reflect SMP locking overhead or cache interference.
- Idle or near-idle CPU conditions below 20% utilization, while field systems often run at 60% to 85% average load.
- No shared mutexes, message queues, or memory pool contention.
- Best-case reporting only, without 99.9th percentile latency or worst-case execution time windows.
- Short tests that exclude thermal drift, DMA bursts, storage writes, or network storms.
When a benchmark uses three or more of these shortcuts, the results may still be technically correct, but operationally misleading. Engineers should treat such data as a narrow microbenchmark, not a proof of scheduling robustness.
The Scheduling Failures Hidden Behind Good-Looking Numbers
The most dangerous benchmark blind spot is that the scheduler can fail functionally while still looking fast statistically. In practical deployments, the visible symptoms are not always a system crash. More often, they appear as sporadic EtherCAT frame timing drift, delayed OPC UA responses above 40 ms, edge inference bursts that block control tasks, or periodic watchdog near-misses that never show up in marketing charts.
Priority inversion is one classic example. If a low-priority logging thread holds a mutex for 800 μs and a high-priority motion thread needs that same resource every 1 ms, one blocked cycle is enough to create unacceptable servo jitter. If a medium-priority communication task keeps running meanwhile, the inversion becomes longer and harder to detect unless the benchmark explicitly models it.
Jitter is another hidden problem. A benchmark may report average task wake-up latency of 4 μs, but if the 99.99th percentile reaches 180 μs during storage flushes or interrupt bursts, deterministic control quality degrades. In systems coordinating multi-axis motion, even tens of microseconds can matter when several distributed nodes must stay phase-aligned.
Deadline misses are the final layer. A task with a 2 ms period and 300 μs execution time seems safe on paper. Yet once cache misses, network ISR load, and lock contention are introduced, that same task may miss 1 in every 50,000 periods. In a lab, that is easy to overlook. On a 24/7 production line, it can translate into repeated nuisance faults across a 3-shift operation.
What to Measure Instead of Best-Case Latency Alone
A stronger evaluation framework compares the metrics below across idle, nominal, and stress conditions. This gives procurement teams and system architects a truer picture of risk.
The key takeaway is simple: the average tells you how the scheduler behaves when conditions are favorable. Percentiles, blocking times, and deadline counts tell you what happens when the plant is busy, noisy, and commercially relevant.
Why This Matters for Edge AI, OPC UA, and EtherCAT
In edge AI systems, inference tasks can consume CPU, memory bandwidth, and accelerator interrupts in bursts. A benchmark may show 12 ms average inference latency, but fail to disclose that concurrent control task jitter rises from 15 μs to 130 μs during model swaps or tensor pre-processing. That is a scheduler integration issue, not merely an AI throughput issue.
For OPC UA, the concern is response consistency under concurrent publishing, encryption, and historian writes. A server that responds in 8 ms under light load may exceed 50 ms once 200 tags are polled alongside motion tasks. In procurement terms, this can mean the platform is acceptable for monitoring but unsuitable for supervisory control coordination.
For EtherCAT, cycle time numbers alone are also incomplete. A system advertised at 250 μs cycle capability still needs evidence that jitter remains controlled, distributed clocks stay aligned, and the RTOS can service network and local control deadlines simultaneously. Without that, the benchmark describes lab potential, not line-ready determinism.
How Engineers and Buyers Should Read RTOS Benchmark Reports
An RTOS benchmark becomes decision-grade only when the test conditions are transparent. Procurement teams should ask whether the platform was measured on a single core or multiple cores, whether background services were enabled, what CPU utilization range was maintained, and whether the results include worst-case behavior. Without those details, numerical comparisons across vendors are weak.
For engineering teams, the most useful reports separate microbenchmark data from system-level benchmark data. Microbenchmarks answer narrow questions such as ISR latency or semaphore handoff cost. System-level tests answer the larger question: can the scheduler maintain deterministic service while control, communication, logging, and analytics run at the same time for 24 hours or more?
For decision-makers, benchmark interpretation should align with the intended use case. A machine vision inspection node, an autonomous mobile robot controller, and a deterministic motion gateway all have different tolerance for jitter, recovery delay, and deadline miss rates. One benchmark report cannot support all three procurement decisions equally well.
A Practical Evaluation Checklist
Before relying on a benchmark for platform selection, review these six points with the supplier or internal validation team.
- Confirm whether results include average, 99th, 99.9th, and worst-case latency values.
- Check if tests ran for at least 24 hours under realistic load rather than a 1 to 5 minute demo window.
- Verify contention scenarios: mutexes, queues, DMA events, network interrupts, and file writes.
- Ask whether priority inheritance or ceiling protocols were enabled and measured.
- Review whether the benchmark reflects your target cycle time, such as 250 μs, 500 μs, 1 ms, or 10 ms.
- Request evidence of deadline miss counts, watchdog events, and recovery behavior during overload.
This checklist helps both users and purchasing teams filter out benchmark reports that are mathematically neat but operationally shallow.
Benchmark Questions That Change Procurement Outcomes
When comparing suppliers, the difference between a strong and weak benchmark report often comes down to a handful of questions. Was the system tested with OPC UA security enabled? Were Ethernet traffic bursts injected? Did the team measure scheduler behavior while storage logging occurred every 100 ms or 1 s? Were AI inference and motion tasks executed together, or separately?
Answers to those questions affect integration cost. A platform with attractive synthetic latency but poor mixed-workload behavior may require redesign of task priorities, partitioning across processors, or external co-processors. That can add 4 to 12 weeks to commissioning, plus extra validation effort.
A Better RTOS Benchmark Framework for Industrial and Hard-Tech Systems
A more credible RTOS benchmark should be scenario-based. Instead of asking only how fast the kernel switches tasks, it should ask how well the full stack holds timing guarantees under representative industrial loads. That means testing not one loop, but a workload mix similar to what real products execute in robotics, edge gateways, aerospace subsystems, and precision automation.
At TSV, the useful benchmarking mindset is to move from isolated speed toward engineering truth. A benchmark should disclose test topology, task set, periods, priorities, CPU loading method, interrupt sources, communication stack activity, and soak duration. If two vendors report 3 μs average interrupt latency but one shows stable 99.9th percentile behavior under 70% load and the other does not, they are not operationally equivalent.
The framework below summarizes the difference between a cosmetic benchmark and a decision-ready benchmark.
The most important conclusion is that benchmark structure drives benchmark honesty. If the structure does not expose contention, preemption edge cases, and long-duration drift, the final numbers may still look clean while hiding the very scheduling problems that matter in deployment.
Recommended Test Scenarios
For industrial and hard-tech products, a balanced validation program should cover at least four scenario groups.
- Nominal load: 40% to 60% CPU, normal network traffic, baseline control loops.
- Peak load: 70% to 85% CPU, storage writes, alarm floods, and communication bursts.
- Contention stress: shared mutexes, memory pressure, DMA completions, and timer coalescing.
- Fault recovery: dropped packets, delayed peripherals, and watchdog threshold tests.
This approach gives both technical and commercial stakeholders a more useful answer: not whether the RTOS is fast in a brochure, but whether it is stable in a plant, vehicle, or edge appliance where timing errors cost real money.
FAQ for Selection, Validation, and Deployment
How much jitter is acceptable in industrial control?
It depends on the loop period and control architecture. For a 1 ms motion loop, engineers often want application-level jitter far below 100 μs, and in tighter systems below 25 μs. For HMI refresh or supervisory monitoring at 50 ms to 200 ms cycles, tolerance is much wider. The benchmark should always be judged against the actual task period, not a generic latency target.
Are context-switch benchmarks still useful?
Yes, but only as one layer of evaluation. They help compare kernel overhead, especially in microcontroller-class systems. However, they should represent no more than one part of the selection package. For Linux-RT, SMP RTOS platforms, or mixed edge workloads, system-level scheduling behavior is usually more important than a tiny difference between 0.8 μs and 1.4 μs switch time.
What should buyers request from vendors before approval?
Ask for the exact benchmark method, hardware configuration, task mix, load level, and duration. Request percentile latency data, deadline miss logs, and evidence from at least one 24-hour run. If your application depends on OPC UA, EtherCAT, or edge AI inference, ask to see those functions active during the benchmark rather than tested separately.
When should a team run its own benchmark instead of trusting supplier data?
Internal validation is strongly recommended when the deployment has hard cycle constraints below 1 ms, safety implications, or high qualification cost. It is also important when one platform will be scaled across multiple product lines. A 2 to 3 week internal benchmark effort can prevent months of integration rework later.
The strongest RTOS benchmark result is not the one with the smallest headline number. It is the one that survives realistic scheduling stress, exposes worst-case behavior, and aligns with the intended industrial workload. For engineers, operators, procurement teams, and executives, that is the difference between benchmarking a kernel and validating a deployable system.
TechStat Vanguard focuses on this engineering-first standard: parameters over slogans, traceable test structure over polished claims, and benchmark evidence that can actually reduce qualification risk. If you are evaluating RTOS platforms, industrial edge controllers, or timing-sensitive hard-tech systems, contact TSV to review benchmark methodology, compare decision-grade metrics, and get a more reliable basis for supplier selection and system design.
Search News
Hot Articles
- Carbon Fiber StructuresHow to Specify Aerospace Carbon Fiber Assemblies for Lightweight, Load-Bearing PartsJul 11, 2026
- Machine VisionXiaomi, Alibaba DAMO Academy Drive Open-Source Robotics Model Ecosystem, Lowering Algorithm Development Barriers for Overseas SMEs Adopting Chinese Robotics SolutionsMar 30, 2026
- Cobots & ArmsShanxi 'AI+' Conference Showcases Embodied Intelligence with Multinational Buyer Engagement: Key Industry ImplicationsMar 30, 2026
Popular Tags
Recommended News
 Jul 11, 2026How to Specify Aerospace Carbon Fiber Assemblies for Lightweight, Load-Bearing PartsAerospace carbon fiber assemblies: learn how to specify laminate design, load data, joining methods, and inspection controls for lighter, reliable load-bearing aerospace parts.Elena Rostova (UAV Systems Researcher)
 Mar 30, 2026Xiaomi, Alibaba DAMO Academy Drive Open-Source Robotics Model Ecosystem, Lowering Algorithm Development Barriers for Overseas SMEs Adopting Chinese Robotics SolutionsXiaomi & Alibaba DAMO Academy's open-source robotics models lower algorithm barriers for global SMEs. Boost efficiency in manufacturing, logistics & smart retail with ROS 2 compatible solutions.TSV Data Lab
 Mar 30, 2026Shanxi 'AI+' Conference Showcases Embodied Intelligence with Multinational Buyer Engagement: Key Industry ImplicationsShanxi 'AI+' Conference highlights embodied intelligence with Tesla, Ubtech & Jiantao showcasing multimodal robotics. 40+ global buyers validated tech on-site, creating new B2B channels for industrial automation & AI solutions.Chen Wei (Automation Lead Engineer)
 Mar 30, 2026Zhongguancun Unveils 6G Integrated Sensing-Computing-Intelligence Platform to Empower Embodied Robots for Global Industrial ApplicationsZhongguancun's new 6G platform revolutionizes industrial robotics with <10ms latency, empowering global automotive, logistics & port automation. Discover how this tech boosts China's smart manufacturing exports.TSV Data Lab
 Mar 30, 2026Mech-Mind Tianjin Embodied Intelligence R&D and Production Base Goes Live, Cutting Delivery Time by 20%–30% for Global Customized AMR+Vision SolutionsMech-Mind's Tianjin AMR+Vision production base cuts delivery time by 20%-30% for欧美 & Latin American markets. Discover how this PLd-certified facility accelerates customized robotics solutions for smart manufacturing and logistics.Chen Wei (Automation Lead Engineer)
 Mar 30, 2026Boao Forum Reveals 'Co-evolution of Big and Small Brains' Trend in Humanoid Robots, China's Embodied Intelligence Accelerates Adaptation to Overseas Manufacturing Service ScenariosDiscover how China's humanoid robots, featuring 'Co-evolution of Big and Small Brains,' are revolutionizing global manufacturing. Learn about Embodied Tian Gong 3.0's ISO compliance and overseas deployment at Boao Forum 2026.Chen Wei (Automation Lead Engineer)
 Mar 30, 2026China Railway Industrial Secures Patent for Embodied Robotics in Material Handling, Boosting High-Precision Delivery Capabilities for Overseas Infrastructure and Manufacturing ProjectsChina Railway Industrial's new patent for embodied robotics in material handling boosts high-precision delivery for global infrastructure & manufacturing. Discover how this innovation enhances logistics accuracy in automotive, rail transit & EPC projects.Chen Wei (Automation Lead Engineer)
 Oct 13, 2026Smart Cameras vs. PC-Based Machine Vision: Which Fits High-Speed Inspection?This industrial product comparison for machine vision weighs smart cameras vs. PC-based systems on latency, throughput, and cost. Discover your best fit for high-speed inspection.TSV Data Lab
 Oct 12, 2026How to Verify RoHS Compliance in Industrial Sensing Systems Before DeploymentRoHS compliant sensing systems: learn how to verify materials, supplier declarations, testing, and configuration controls before industrial deployment.TSV Data Lab
 Oct 11, 2026How Procurement-Oriented Content Taxonomy Improves B2B Buying JourneysProcurement-oriented content taxonomy streamlines B2B buying journeys with clearer evidence, supplier comparisons, risk visibility, and faster approvals.TSV Data Lab
 Oct 10, 2026How to Select a Machine Performance Monitoring Platform for OEE and Downtime ReductionMachine performance monitoring platform selection guide: validate machine states, OEE data, downtime reasons, integrations, and scalability to reduce losses with confidence.TSV Data Lab
 Oct 08, 2026How to Machine Inconel 625 Blades Without Heat Cracks or Edge ChippingInconel 625 blade machining guide: prevent heat cracks, edge chipping, chatter, and work hardening with proven tooling, cooling, fixturing, and inspection strategies.Dr. Marcus Vance
 Oct 07, 2026How to Evaluate an HMI Panel Distributor for Industrial Automation ProjectsHMI panel distributor evaluation guide: verify technical compatibility, traceability, supply reliability, lifecycle support, and total cost for automation projects.Victor Lin (Chief Software Architect)
 Oct 06, 2026Navigation Fault Tolerance Standards for AMRs: What Safety Teams Must VerifyNavigation fault tolerance standards: learn what AMR safety teams must verify, from localization loss and sensor faults to stopping distance, safe restart, and site-specific validation.Chen Wei (Automation Lead Engineer)
 Oct 05, 2026Calculating Edge Computing Total Cost of Ownership Across Distributed SitesEdge computing ownership cost explained: calculate deployment, energy, connectivity, security, remote support, and refresh costs across distributed sites.TSV Data Lab
 Oct 04, 2026CAD/CAM Benchmarking in the GCC: What Manufacturers Should Ask a ConsultantCAD CAM benchmark consultant GCC guide: learn the key questions manufacturers should ask to validate post-processors, workflows, machine performance, and production risk.Victor Lin (Chief Software Architect)
 Oct 03, 2026Selecting Automotive Radar Sensor Modules for ADAS Range, Resolution, and IntegrationAutomotive radar sensor module selection guide for ADAS: compare range, resolution, field of view, latency, and integration to build safer, reliable vehicle systems.TSV Data Lab
 Oct 02, 2026How to Qualify Machined Parts Suppliers for Hard Tech ProgramsHard tech supply chain machined parts demand rigorous supplier qualification. Learn how to assess capability, traceability, quality controls, and delivery resilience.Dr. Marcus Vance
 Oct 01, 2026How to Select an Outdoor Security Radar Sensor for Perimeter Detection?Outdoor security radar sensor selection guide: compare range, accuracy, false-alarm control, integration, and field testing for reliable perimeter detection.TSV Data Lab
 Sep 30, 2026How to Evaluate Solid-State LiDAR Hardware for Outdoor Autonomous VehiclesSolid state LiDAR hardware evaluation guide for outdoor autonomous vehicles—compare range, point-cloud quality, environmental resilience, integration, and safety.TSV Data Lab
 Sep 29, 2026ISO 9283 Repeatability: How to Evaluate Cobot Positioning PerformanceISO 9283 cobot repeatability explained: learn how payload, reach, approach direction, and test conditions affect positioning performance and cell capability.Chen Wei (Automation Lead Engineer)
 Oct 13, 2026How to keep an industrial robotic integration project on scheduleIndustrial robotic integration project management: keep automation on schedule with proven controls for interfaces, suppliers, FAT, commissioning, and change risk.Victor Lin (Chief Software Architect)
 Oct 12, 2026What should be included in predictive maintenance pricing for factories?Predictive maintenance pricing for factories: compare sensors, software, integration, support, and total cost to secure measurable uptime gains and avoid hidden expenses.TSV Data Lab
 Oct 11, 2026How payload and reach change the cost of an industrial robotCost of industrial robot systems depends heavily on payload and reach. Learn how sizing, torque, tooling, safety, and lifecycle factors shape smarter automation investments.Chen Wei (Automation Lead Engineer)