Predictive Maintenance Software Price Comparison: Cost Drivers, Licensing Models, and ROI Checks
Publication Date
author
Predictive Maintenance Software Price Comparison: Cost Drivers, Licensing Models, and ROI Checks
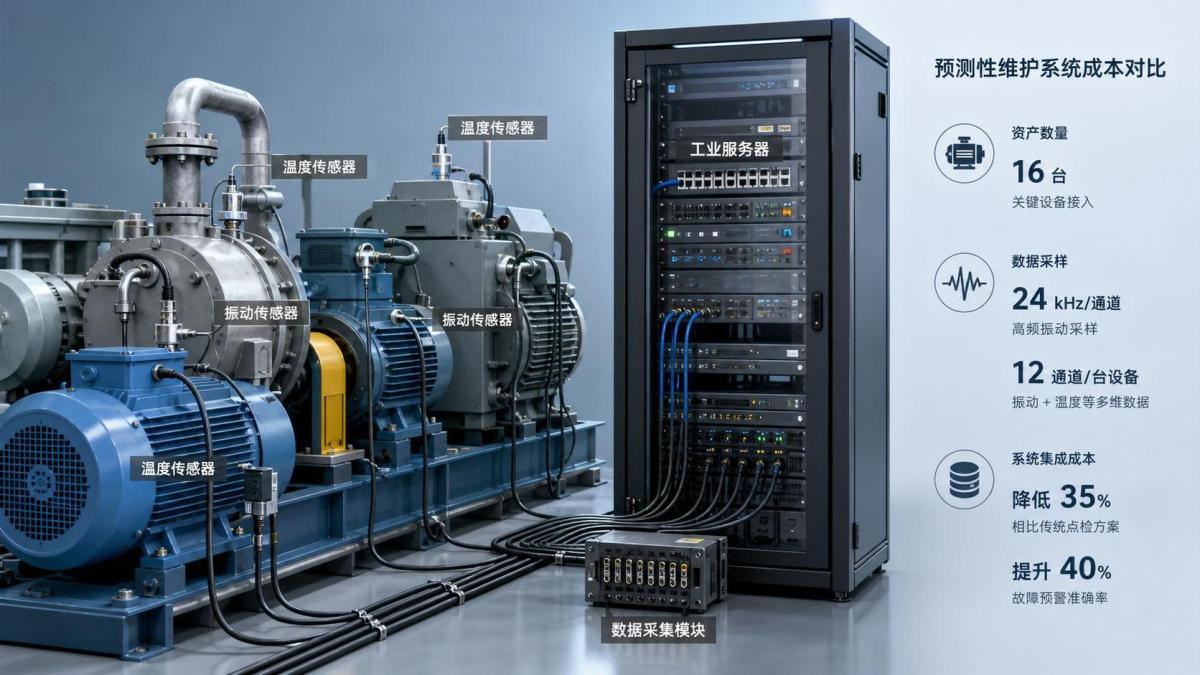
For procurement teams comparing vendors, a predictive maintenance software price comparison only matters when it reaches total cost, not just subscription headlines.
That means checking licensing logic, asset scope, integrations, data quality, deployment effort, and the path to measurable returns.
In actual buying cycles, the cheapest quote often becomes expensive after connectors, onboarding, model tuning, and support tiers are added.
A better approach is to compare vendors the way engineers compare systems: by parameters, constraints, and operating conditions.
For organizations following TSV’s data-first mindset, this is where a predictive maintenance software price comparison becomes a useful procurement tool.
Why Headline Pricing Rarely Tells the Full Story
Most vendors promote a clean starting price. That number usually reflects a narrow usage band or a basic monitoring package.
The real spend depends on how many machines, sites, users, and data streams must be covered from day one.
It also depends on whether the platform supports condition monitoring only, or full failure prediction with workflows and analytics.
From a procurement view, a predictive maintenance software price comparison should separate software price from solution delivery cost.
That includes setup services, sensor compatibility checks, historian access, API work, cybersecurity review, and internal labor.
More importantly, cost must be matched against operational value. A low fee is weak if alerts arrive late or create false positives.
Main Cost Drivers in a Predictive Maintenance Software Price Comparison
Several variables move pricing faster than buyers expect. These drivers should be isolated early in the sourcing process.
1. Asset Count and Asset Criticality
Some vendors charge per asset. Others charge more for critical assets with higher data frequency or advanced diagnostic models.
A compressor, spindle, or turbine usually carries a different pricing profile from a low-risk auxiliary motor.
2. Data Volume and Sampling Frequency
High-resolution vibration, thermal, and current data can increase storage and processing charges quickly.
This is a common blind spot in a predictive maintenance software price comparison, especially across multi-plant environments.
3. Integration Depth
Connecting to CMMS, ERP, MES, SCADA, historians, and edge gateways can be simple or highly custom.
The deeper the workflow integration, the higher the implementation effort and support dependency.
4. Analytics Maturity
Rules-based alerts are cheaper than machine learning models trained on historical failure patterns.
If the vendor promises prescriptive maintenance, ask what portion is included and what requires premium services.
5. Deployment Model
Cloud deployments often reduce startup friction. On-premise or hybrid models can raise security, hardware, and maintenance costs.
For regulated manufacturing, deployment constraints can decide the true price more than the license itself.
Common Licensing Models Buyers Need to Decode
Licensing structure shapes both budget control and expansion risk. Here are the models seen most often.
Per Asset
This model is easy to compare at pilot stage. It becomes costly when thousands of monitored assets are added.
Per Site or Plant
Useful for enterprises with variable asset counts. Still, check user caps, data caps, and module exclusions.
Per User
This looks familiar to software buyers, but it can distort adoption if operations teams limit access to save budget.
Usage-Based
Charges may follow data ingestion, API calls, compute time, or storage. Flexibility is high, predictability is lower.
Enterprise License
This can look expensive upfront, but it may reduce marginal cost during global rollout.
A solid predictive maintenance software price comparison should model all five structures over a three-year horizon.
A Practical Cost Comparison Table
This table helps turn a predictive maintenance software price comparison into a more disciplined sourcing exercise.
How to Run ROI Checks Before Signing
ROI should be grounded in operational data, not vendor slides. Start with a limited but meaningful business case.
The strongest cases usually focus on assets with known downtime cost, expensive spare parts, or unstable failure behavior.
Key ROI Inputs
- Unplanned downtime hours per year
- Hourly production loss or service interruption cost
- Maintenance labor spent on reactive interventions
- Inventory carrying cost for emergency spares
- Scrap, quality loss, or energy waste linked to late detection
Then compare those values against three cost layers: annual license, one-time deployment, and internal resource commitment.
A credible predictive maintenance software price comparison should include best-case, base-case, and conservative ROI assumptions.
If a vendor cannot support value modeling with reference metrics, treat that as a commercial warning sign.
Questions That Expose Hidden Cost and Risk
Shortlists often look similar on paper. The better signal comes from targeted commercial and technical questions.
- Which modules are standard, and which require separate licensing?
- What data sources are supported out of the box?
- How are asset additions priced after pilot completion?
- What is the expected timeline for one plant versus multiple plants?
- Are model tuning, retraining, and false-positive reduction included?
- What happens to pricing if retention periods or data rates increase?
- What exit support is available if migration becomes necessary?
These questions make a predictive maintenance software price comparison more realistic and much harder to manipulate with surface-level discounts.
What Strong Buyers Do Differently
Strong procurement teams avoid comparing vendors through a single annual number. They compare operating models.
They also define the target state early: pilot only, site standardization, or enterprise rollout.
That decision changes the preferred licensing model, implementation structure, and negotiation leverage.
In sectors influenced by TSV’s engineering logic, buyers also ask for parameter-level proof.
They want alert precision, lead time before failure, integration stability, and model performance by asset type.
That is how a predictive maintenance software price comparison moves from software shopping to risk-managed capital discipline.
Final Buying View
A useful predictive maintenance software price comparison should answer three things clearly.
First, what will the platform really cost across deployment, scaling, and support.
Second, which licensing model best fits asset growth, plant count, and internal operating structure.
Third, whether the expected ROI survives conservative assumptions and real integration constraints.
When those checks are done with discipline, the final choice becomes simpler, more defensible, and more aligned with long-term plant performance.
Use the next vendor round to request line-item pricing, scaling scenarios, and evidence-backed ROI inputs before moving forward.
Search News
Hot Articles
- Carbon Fiber StructuresHow to Specify Aerospace Carbon Fiber Assemblies for Lightweight, Load-Bearing PartsJul 11, 2026
- Machine VisionXiaomi, Alibaba DAMO Academy Drive Open-Source Robotics Model Ecosystem, Lowering Algorithm Development Barriers for Overseas SMEs Adopting Chinese Robotics SolutionsMar 30, 2026
- Cobots & ArmsShanxi 'AI+' Conference Showcases Embodied Intelligence with Multinational Buyer Engagement: Key Industry ImplicationsMar 30, 2026
Popular Tags
Recommended News
 Jul 11, 2026How to Specify Aerospace Carbon Fiber Assemblies for Lightweight, Load-Bearing PartsAerospace carbon fiber assemblies: learn how to specify laminate design, load data, joining methods, and inspection controls for lighter, reliable load-bearing aerospace parts.Elena Rostova (UAV Systems Researcher)
 Mar 30, 2026Xiaomi, Alibaba DAMO Academy Drive Open-Source Robotics Model Ecosystem, Lowering Algorithm Development Barriers for Overseas SMEs Adopting Chinese Robotics SolutionsXiaomi & Alibaba DAMO Academy's open-source robotics models lower algorithm barriers for global SMEs. Boost efficiency in manufacturing, logistics & smart retail with ROS 2 compatible solutions.TSV Data Lab
 Mar 30, 2026Shanxi 'AI+' Conference Showcases Embodied Intelligence with Multinational Buyer Engagement: Key Industry ImplicationsShanxi 'AI+' Conference highlights embodied intelligence with Tesla, Ubtech & Jiantao showcasing multimodal robotics. 40+ global buyers validated tech on-site, creating new B2B channels for industrial automation & AI solutions.Chen Wei (Automation Lead Engineer)
 Mar 30, 2026Zhongguancun Unveils 6G Integrated Sensing-Computing-Intelligence Platform to Empower Embodied Robots for Global Industrial ApplicationsZhongguancun's new 6G platform revolutionizes industrial robotics with <10ms latency, empowering global automotive, logistics & port automation. Discover how this tech boosts China's smart manufacturing exports.TSV Data Lab
 Mar 30, 2026Mech-Mind Tianjin Embodied Intelligence R&D and Production Base Goes Live, Cutting Delivery Time by 20%–30% for Global Customized AMR+Vision SolutionsMech-Mind's Tianjin AMR+Vision production base cuts delivery time by 20%-30% for欧美 & Latin American markets. Discover how this PLd-certified facility accelerates customized robotics solutions for smart manufacturing and logistics.Chen Wei (Automation Lead Engineer)
 Mar 30, 2026Boao Forum Reveals 'Co-evolution of Big and Small Brains' Trend in Humanoid Robots, China's Embodied Intelligence Accelerates Adaptation to Overseas Manufacturing Service ScenariosDiscover how China's humanoid robots, featuring 'Co-evolution of Big and Small Brains,' are revolutionizing global manufacturing. Learn about Embodied Tian Gong 3.0's ISO compliance and overseas deployment at Boao Forum 2026.Chen Wei (Automation Lead Engineer)
 Mar 30, 2026China Railway Industrial Secures Patent for Embodied Robotics in Material Handling, Boosting High-Precision Delivery Capabilities for Overseas Infrastructure and Manufacturing ProjectsChina Railway Industrial's new patent for embodied robotics in material handling boosts high-precision delivery for global infrastructure & manufacturing. Discover how this innovation enhances logistics accuracy in automotive, rail transit & EPC projects.Chen Wei (Automation Lead Engineer)
 Oct 13, 2026Smart Cameras vs. PC-Based Machine Vision: Which Fits High-Speed Inspection?This industrial product comparison for machine vision weighs smart cameras vs. PC-based systems on latency, throughput, and cost. Discover your best fit for high-speed inspection.TSV Data Lab
 Oct 12, 2026How to Verify RoHS Compliance in Industrial Sensing Systems Before DeploymentRoHS compliant sensing systems: learn how to verify materials, supplier declarations, testing, and configuration controls before industrial deployment.TSV Data Lab
 Oct 11, 2026How Procurement-Oriented Content Taxonomy Improves B2B Buying JourneysProcurement-oriented content taxonomy streamlines B2B buying journeys with clearer evidence, supplier comparisons, risk visibility, and faster approvals.TSV Data Lab
 Oct 10, 2026How to Select a Machine Performance Monitoring Platform for OEE and Downtime ReductionMachine performance monitoring platform selection guide: validate machine states, OEE data, downtime reasons, integrations, and scalability to reduce losses with confidence.TSV Data Lab
 Oct 08, 2026How to Machine Inconel 625 Blades Without Heat Cracks or Edge ChippingInconel 625 blade machining guide: prevent heat cracks, edge chipping, chatter, and work hardening with proven tooling, cooling, fixturing, and inspection strategies.Dr. Marcus Vance
 Oct 07, 2026How to Evaluate an HMI Panel Distributor for Industrial Automation ProjectsHMI panel distributor evaluation guide: verify technical compatibility, traceability, supply reliability, lifecycle support, and total cost for automation projects.Victor Lin (Chief Software Architect)
 Oct 06, 2026Navigation Fault Tolerance Standards for AMRs: What Safety Teams Must VerifyNavigation fault tolerance standards: learn what AMR safety teams must verify, from localization loss and sensor faults to stopping distance, safe restart, and site-specific validation.Chen Wei (Automation Lead Engineer)
 Oct 05, 2026Calculating Edge Computing Total Cost of Ownership Across Distributed SitesEdge computing ownership cost explained: calculate deployment, energy, connectivity, security, remote support, and refresh costs across distributed sites.TSV Data Lab
 Oct 04, 2026CAD/CAM Benchmarking in the GCC: What Manufacturers Should Ask a ConsultantCAD CAM benchmark consultant GCC guide: learn the key questions manufacturers should ask to validate post-processors, workflows, machine performance, and production risk.Victor Lin (Chief Software Architect)
 Oct 03, 2026Selecting Automotive Radar Sensor Modules for ADAS Range, Resolution, and IntegrationAutomotive radar sensor module selection guide for ADAS: compare range, resolution, field of view, latency, and integration to build safer, reliable vehicle systems.TSV Data Lab
 Oct 02, 2026How to Qualify Machined Parts Suppliers for Hard Tech ProgramsHard tech supply chain machined parts demand rigorous supplier qualification. Learn how to assess capability, traceability, quality controls, and delivery resilience.Dr. Marcus Vance
 Oct 01, 2026How to Select an Outdoor Security Radar Sensor for Perimeter Detection?Outdoor security radar sensor selection guide: compare range, accuracy, false-alarm control, integration, and field testing for reliable perimeter detection.TSV Data Lab
 Sep 30, 2026How to Evaluate Solid-State LiDAR Hardware for Outdoor Autonomous VehiclesSolid state LiDAR hardware evaluation guide for outdoor autonomous vehicles—compare range, point-cloud quality, environmental resilience, integration, and safety.TSV Data Lab
 Sep 29, 2026ISO 9283 Repeatability: How to Evaluate Cobot Positioning PerformanceISO 9283 cobot repeatability explained: learn how payload, reach, approach direction, and test conditions affect positioning performance and cell capability.Chen Wei (Automation Lead Engineer)
 Oct 13, 2026How to keep an industrial robotic integration project on scheduleIndustrial robotic integration project management: keep automation on schedule with proven controls for interfaces, suppliers, FAT, commissioning, and change risk.Victor Lin (Chief Software Architect)
 Oct 12, 2026What should be included in predictive maintenance pricing for factories?Predictive maintenance pricing for factories: compare sensors, software, integration, support, and total cost to secure measurable uptime gains and avoid hidden expenses.TSV Data Lab
 Oct 11, 2026How payload and reach change the cost of an industrial robotCost of industrial robot systems depends heavily on payload and reach. Learn how sizing, torque, tooling, safety, and lifecycle factors shape smarter automation investments.Chen Wei (Automation Lead Engineer)