Fatigue test reports can expose weak points in 5-axis machining
Publication Date
author
In high-precision manufacturing, weak points rarely appear in brochures—they emerge under stress. 5-axis CNC machining fatigue test reports help quality control and safety managers uncover hidden risks in toolpaths, material behavior, and tolerance stability before parts fail in service. For teams responsible for reliability, compliance, and supplier evaluation, data-driven fatigue analysis turns machining performance into engineering truth.
That is why fatigue documentation matters far beyond the machine shop. In aerospace, medical devices, robotics, UAV structures, and other high-consequence applications, a part that passes dimensional inspection on day one can still fail after 10,000, 100,000, or 1,000,000 load cycles if the machining process introduces subsurface damage, residual stress imbalance, or unfavorable grain response.
For quality control managers, safety officers, and supplier qualification teams, 5-axis CNC machining fatigue test reports are not just lab records. They are decision tools. They reveal whether a supplier can consistently control contour transitions, maintain edge integrity, preserve tolerance under cyclic loading, and produce parts that survive real service conditions rather than only static inspection.
Why fatigue test reports matter in 5-axis machining quality assurance
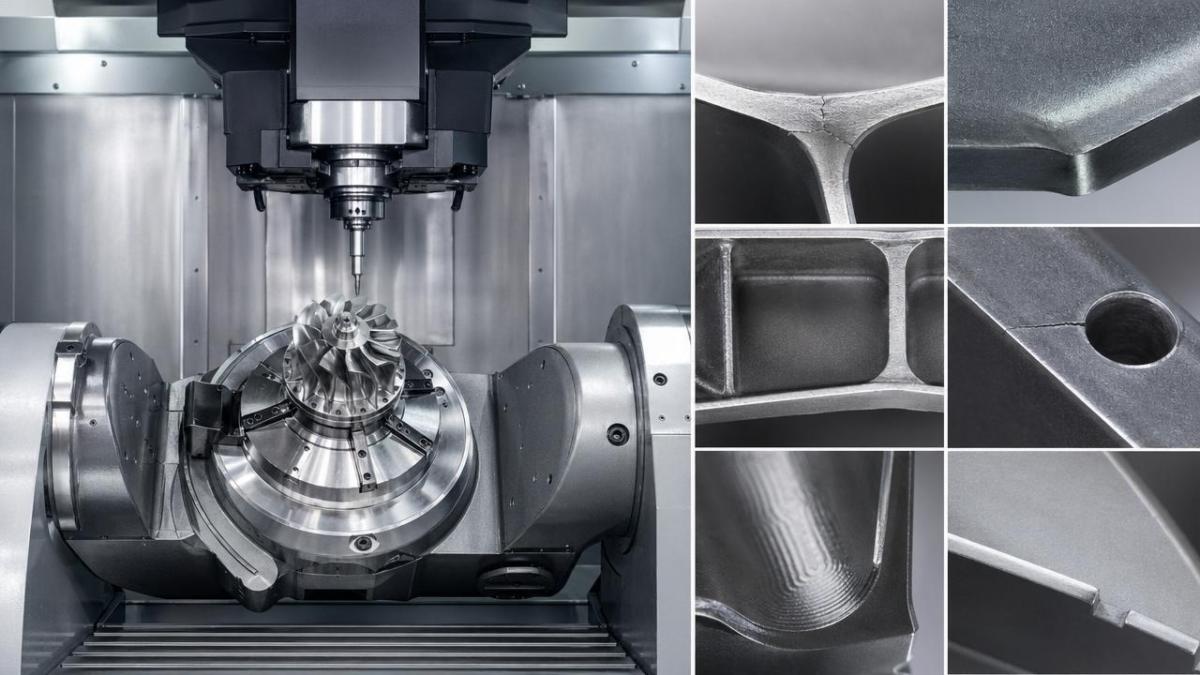
5-axis machining enables complex geometry, reduced setups, and tighter positional relationships across multiple surfaces. However, those same advantages also create more variables. Tool orientation changes, surface blending, cutter engagement variation, and local heat generation can all influence fatigue performance even when nominal dimensions remain within ±0.01 mm or tighter.
A conventional first article inspection may confirm diameter, flatness, and profile tolerance. It will not always show whether a fillet root contains micro-tearing, whether a swarf-cut wall has directional stress concentration, or whether a thin-web feature begins to lose stability after repeated vibration at 20 Hz to 80 Hz. This gap is exactly where 5-axis CNC machining fatigue test reports provide measurable value.
What these reports usually reveal
In mature supplier evaluation workflows, fatigue reports are used to connect machining inputs with structural outcomes. A credible report often includes specimen geometry, alloy condition, surface roughness range, stress ratio, cycle count, failure mode, and post-test microscopy notes. Without these elements, fatigue data is difficult to compare across batches or suppliers.
- Cycle-to-failure behavior under representative loads, such as 104, 105, or 106 cycles
- Crack initiation zones around fillets, pockets, corners, or transition surfaces
- Surface finish influence, for example Ra 0.4 µm versus Ra 1.6 µm
- Heat-affected or residual-stress-sensitive regions caused by aggressive cutting parameters
- Batch-to-batch repeatability for critical parts supplied over 3 to 12 months
Why brochure claims are not enough
Many suppliers can state that they machine titanium, aluminum, stainless steel, or high-performance polymers on 5-axis equipment. That statement alone does not tell a buyer whether the process protects fatigue strength. A test report showing stable endurance across 30 specimens provides more value than generic claims about “precision capability” or “advanced equipment.”
For TSV-aligned procurement logic, the critical question is simple: can the machining process preserve engineering intent under service loads? If not, a dimensional pass at incoming inspection may become a field failure cost later, with consequences that include recall exposure, audit findings, and supplier requalification delays of 4 to 12 weeks.
Three risk categories fatigue reports can expose early
- Geometry-driven risk: thin walls, deep cavities, blended radii, and intersecting features that amplify local stress.
- Process-driven risk: tool wear, chatter, feed variation, coolant inconsistency, and poor fixture stability.
- Material-driven risk: anisotropy, inclusion sensitivity, residual stress response, and hardness variation after machining.
Weak points that fatigue reports commonly uncover in 5-axis machined parts
The most useful 5-axis CNC machining fatigue test reports do not merely state pass or fail. They map failure back to a feature, a process condition, or a tolerance interaction. This makes them practical for corrective action, supplier comparison, and risk-based inspection planning.
1. Toolpath transition zones
When the machine changes cutter orientation across a freeform surface, the local scallop pattern can shift. If cusp height, tool engagement, or feed per tooth is not controlled, small surface discontinuities may form. These become common crack initiation points under cyclic bending or torsion, especially in load-bearing brackets and lightweight structural housings.
2. Fillets, corners, and blended radii
A nominal radius may still perform poorly if the actual blend contains micro-notches or if cutter access forced a compromise in path strategy. In fatigue testing, these areas often fail earlier than flat reference sections. A part may hold ±0.02 mm profile tolerance yet still lose 15% to 30% of expected fatigue life because the transition geometry is too sharp in microscopic terms.
3. Thin-wall distortion and stress retention
Thin sections below 2.0 mm to 3.0 mm are especially sensitive. Even if they spring back into dimensional tolerance after machining, internal stress can remain trapped. Under repeated vibration, that stress may combine with service load and produce crack growth far earlier than static verification predicts.
The table below summarizes weak-point categories that quality and safety teams should connect to fatigue data during supplier review and process approval.
The key takeaway is that fatigue performance is feature-specific. Two parts made from the same alloy on the same 5-axis machine can behave very differently if the toolpath, fixture access, or stock removal sequence changes. That is why fatigue test interpretation should always be tied back to actual geometry and process context.
How quality and safety managers should read 5-axis CNC machining fatigue test reports
A report is only valuable if it can be used to make a decision. For procurement approval, PPAP-style review, supplier corrective action, or internal process release, quality and safety managers should evaluate fatigue reports using a structured checklist rather than a single pass/fail headline.
Essential fields to verify before accepting the data
At minimum, the report should define material grade, heat treatment condition, test orientation, specimen source location, stress ratio, loading frequency, environment, number of samples, and failure criterion. If 8 samples were tested but 3 came from a different stock condition, the dataset may not support a clean supplier comparison.
Minimum review checklist
- Was the sample geometry representative of the final part or only a simplified coupon?
- Were parts tested in the as-machined state, polished state, or after secondary finishing?
- Did the report capture surface roughness, such as Ra 0.8 µm or Rz values?
- Was the loading mode axial, bending, torsional, or combined?
- How many specimens were tested per condition: 5, 10, or more?
- Were failure surfaces inspected to identify machining marks as crack starters?
Interpreting the difference between dimensional compliance and durability
A recurring mistake in supplier approval is assuming that CMM data and fatigue performance are interchangeable indicators. They are not. Dimensional compliance confirms the shape at one point in time. Fatigue performance evaluates how the part behaves over time under repeated stress. For mission-critical assemblies, both are necessary, but neither replaces the other.
For example, a machined linkage with true position within 0.015 mm may still fail prematurely if chatter marks at a shoulder edge raise local stress concentration. Likewise, a polished test coupon may show excellent endurance while a real production part with internal corners and interrupted toolpaths performs worse. Report context matters as much as the numeric result.
The matrix below helps convert raw fatigue data into supplier qualification actions and inspection priorities.
This kind of interpretation is especially useful when comparing two suppliers that both meet drawing requirements. The better supplier is often the one whose fatigue data shows narrower variability, clearer traceability, and stronger correlation between process controls and structural performance.
How to use fatigue reports in supplier selection, compliance, and corrective action
For procurement and compliance teams, the practical value of 5-axis CNC machining fatigue test reports lies in how they shorten decision cycles. Instead of relying only on machine lists, certifications, or sample appearance, teams can use fatigue evidence to rank suppliers by process maturity and failure risk.
A 4-step decision framework
- Screen for relevance: confirm that the tested material, geometry, and loading mode resemble the target application.
- Check repeatability: review at least 2 to 3 batches if the part supports long-term production.
- Trace findings to controls: ensure the report connects results to tooling, coolant, inspection, and finishing steps.
- Set acceptance thresholds: define internal triggers for rework, retest, process change review, or supplier escalation.
Where fatigue data reduces risk fastest
The highest return typically appears in safety-critical or high-cost assemblies: aircraft brackets, UAV structural connectors, robotic end-effector arms, medical housings, sensor mounts, and precision motion parts. In these cases, a single field failure can cost far more than the added effort of early fatigue validation during sourcing or process transfer.
Common implementation mistakes to avoid
- Accepting one successful lab test as proof of production consistency
- Reviewing fatigue results without the corresponding machining route sheet
- Ignoring surface condition changes after deburring, polishing, or coating
- Using generic coupons when the real part contains thin ribs, pockets, or blended intersections
- Failing to update control plans after fatigue reports reveal a recurring weak point
For organizations aligned with TSV’s engineering-first approach, the best practice is to treat fatigue reports as part of an integrated qualification package. They should sit beside dimensional inspection, material certification, process capability evidence, and failure analysis records. Parameters do not lie, but they must be interpreted in full context.
When used correctly, 5-axis CNC machining fatigue test reports help quality control and safety managers move from reactive inspection to predictive assurance. They identify weak points before a product enters service, reduce supplier ambiguity, and support more defensible decisions during audits, design transfer, and new vendor onboarding.
If your team is evaluating complex machined components for aerospace, robotics, UAV, medical, or other advanced manufacturing programs, now is the time to make fatigue evidence part of your sourcing and quality benchmark strategy. Contact TSV to discuss technical evaluation criteria, request a tailored benchmarking framework, or learn more solutions for data-driven supplier assessment.
Search News
Hot Articles
- Carbon Fiber StructuresHow to Specify Aerospace Carbon Fiber Assemblies for Lightweight, Load-Bearing PartsJul 11, 2026
- Machine VisionXiaomi, Alibaba DAMO Academy Drive Open-Source Robotics Model Ecosystem, Lowering Algorithm Development Barriers for Overseas SMEs Adopting Chinese Robotics SolutionsMar 30, 2026
- Cobots & ArmsShanxi 'AI+' Conference Showcases Embodied Intelligence with Multinational Buyer Engagement: Key Industry ImplicationsMar 30, 2026
Popular Tags
Recommended News
 Jul 11, 2026How to Specify Aerospace Carbon Fiber Assemblies for Lightweight, Load-Bearing PartsAerospace carbon fiber assemblies: learn how to specify laminate design, load data, joining methods, and inspection controls for lighter, reliable load-bearing aerospace parts.Elena Rostova (UAV Systems Researcher)
 Mar 30, 2026Xiaomi, Alibaba DAMO Academy Drive Open-Source Robotics Model Ecosystem, Lowering Algorithm Development Barriers for Overseas SMEs Adopting Chinese Robotics SolutionsXiaomi & Alibaba DAMO Academy's open-source robotics models lower algorithm barriers for global SMEs. Boost efficiency in manufacturing, logistics & smart retail with ROS 2 compatible solutions.TSV Data Lab
 Mar 30, 2026Shanxi 'AI+' Conference Showcases Embodied Intelligence with Multinational Buyer Engagement: Key Industry ImplicationsShanxi 'AI+' Conference highlights embodied intelligence with Tesla, Ubtech & Jiantao showcasing multimodal robotics. 40+ global buyers validated tech on-site, creating new B2B channels for industrial automation & AI solutions.Chen Wei (Automation Lead Engineer)
 Mar 30, 2026Zhongguancun Unveils 6G Integrated Sensing-Computing-Intelligence Platform to Empower Embodied Robots for Global Industrial ApplicationsZhongguancun's new 6G platform revolutionizes industrial robotics with <10ms latency, empowering global automotive, logistics & port automation. Discover how this tech boosts China's smart manufacturing exports.TSV Data Lab
 Mar 30, 2026Mech-Mind Tianjin Embodied Intelligence R&D and Production Base Goes Live, Cutting Delivery Time by 20%–30% for Global Customized AMR+Vision SolutionsMech-Mind's Tianjin AMR+Vision production base cuts delivery time by 20%-30% for欧美 & Latin American markets. Discover how this PLd-certified facility accelerates customized robotics solutions for smart manufacturing and logistics.Chen Wei (Automation Lead Engineer)
 Mar 30, 2026Boao Forum Reveals 'Co-evolution of Big and Small Brains' Trend in Humanoid Robots, China's Embodied Intelligence Accelerates Adaptation to Overseas Manufacturing Service ScenariosDiscover how China's humanoid robots, featuring 'Co-evolution of Big and Small Brains,' are revolutionizing global manufacturing. Learn about Embodied Tian Gong 3.0's ISO compliance and overseas deployment at Boao Forum 2026.Chen Wei (Automation Lead Engineer)
 Mar 30, 2026China Railway Industrial Secures Patent for Embodied Robotics in Material Handling, Boosting High-Precision Delivery Capabilities for Overseas Infrastructure and Manufacturing ProjectsChina Railway Industrial's new patent for embodied robotics in material handling boosts high-precision delivery for global infrastructure & manufacturing. Discover how this innovation enhances logistics accuracy in automotive, rail transit & EPC projects.Chen Wei (Automation Lead Engineer)
 Sep 28, 2026Spindle Runout Measurement in Germany: DIN Standards, Methods, and Acceptance LimitsSpindle runout measurement Germany: explore DIN standards, proven methods, acceptance limits, and audit-ready practices for reliable machining quality.Dr. Marcus Vance
 Sep 27, 2026How to Select Wall-Mount Edge Devices for Space-Constrained Factory NetworksWall mount edge devices for space-constrained factories: evaluate workload, thermal design, power resilience, cable access, and network reliability for smarter deployments.TSV Data Lab
 Sep 26, 2026Machining Tolerance Analysis: How to Set Limits That Meet Function and Cost TargetsMachining tolerance analysis: learn how to set functional limits, control tolerance stacks, reduce inspection risk, and balance precision with production cost.Dr. Marcus Vance
 Sep 25, 2026How to Evaluate an Industrial Infrastructure Data Platform for Multi-Site OperationsIndustrial infrastructure data platform evaluation guide for multi-site operations: compare data quality, edge resilience, interoperability, governance, and scalable proof-of-value criteria.Victor Lin (Chief Software Architect)
 Sep 24, 2026How to Select Machine Vision Optics for Accurate Inspection at Different Working DistancesMachine vision optics selection guide for accurate inspection at every working distance. Compare FOV, pixel scale, DOF, distortion, lighting, and telecentric options.TSV Data Lab
 Sep 23, 2026How to Evaluate a Machine Vision System Integrator for High-Speed Inspection LinesChoose a machine vision system integrator with proven expertise in high-speed inspection, reliable reject timing, robust optics, and measurable acceptance criteria.TSV Data Lab
 Sep 28, 2026When is a SCADA API the right choice for connecting plant systems?SCADA API guide: learn when governed plant data integration improves traceability, security, and scalability—without compromising real-time control.Victor Lin (Chief Software Architect)
 Sep 27, 2026How SCADA data integration improves traceability across production linesSCADA data integration connects production-line data to improve traceability, accelerate quality investigations, and strengthen safety decisions.Victor Lin (Chief Software Architect)
 Sep 26, 2026What to define before starting SCADA integration planningSCADA integration planning starts with clear scope, control boundaries, data models, cybersecurity, and testing. Discover the definitions that reduce risk and costly rework.Victor Lin (Chief Software Architect)
 Sep 25, 2026How a smart factory with Industrial IoT reduces production blind spotsDiscover how a smart factory with Industrial IoT turns real-time machine, quality, and workflow data into actionable insights that reduce production blind spots and delivery risks.Victor Lin (Chief Software Architect)
 Sep 24, 2026When does Industrial IoT make smart manufacturing easier to scale?Smart manufacturing Industrial IoT scales when trusted data, interoperable systems, and secure workflows turn connected assets into measurable gains.TSV Data Lab
 Sep 23, 2026What drives ultra-precision machining cost at 1-micron tolerance?Ultra precision machining cost per part at 1 micron tolerance depends on process, material, metrology, and yield. Learn how to compare quotes confidently.Dr. Marcus Vance
 Sep 22, 2026Drone Engine-T550CC Applications: Build the UAV Power System Around the MissionAn application guide for Drone Engine-T550CC integration, covering payload planning, airframe matching, cooling, fuel, vibration, test procedures, documentation, and service preparation.Elena Rostova (UAV Systems Researcher)
 Sep 22, 2026How to Evaluate Industrial Edge Computing Vendors for Factory DeploymentIndustrial edge computing vendor evaluation guide for factories: compare latency, protocol fit, reliability, security, and lifecycle support before deployment.TSV Data Lab
 Sep 21, 2026Drone Payload Integration: Matching Power, Data, and Center of Gravity for Reliable FlightsDrone payload integration made practical: balance power, data, center of gravity, and endurance to build safer, more reliable mission-ready flights.Elena Rostova (UAV Systems Researcher)
 Sep 20, 2026Autonomous Navigation Pricing: Cost Drivers and Budget Benchmarks for AMR ProjectsAutonomous navigation price explained: compare AMR cost drivers, software, sensors, integration, safety, and lifecycle budgets to build a scalable project plan.Chen Wei (Automation Lead Engineer)
 Sep 19, 2026How to Scope Automation Integration Services for Multi-System Factory ProjectsAutomation integration services: learn how to scope multi-system factory projects with clear workflows, interface contracts, safety boundaries, and acceptance criteria.Victor Lin (Chief Software Architect)