Agricultural drone for crop spraying: coverage beats tank size
Publication Date
author
In agricultural drone for crop spraying, the biggest productivity mistake is judging performance by tank capacity alone. A larger tank may reduce refill frequency, but it does not automatically increase hectares sprayed per hour. What actually determines output is field coverage: effective spray width, flight speed under load, battery-change rhythm, route efficiency, refill turnaround, and how well the aircraft works with a uav fleet management system and drone photogrammetry software integration. For operators, buyers, researchers, and executives, the practical benchmark is simple: compare real treated area per hour and mission consistency, not just liters carried.
Why coverage matters more than tank size in agricultural drone for crop spraying
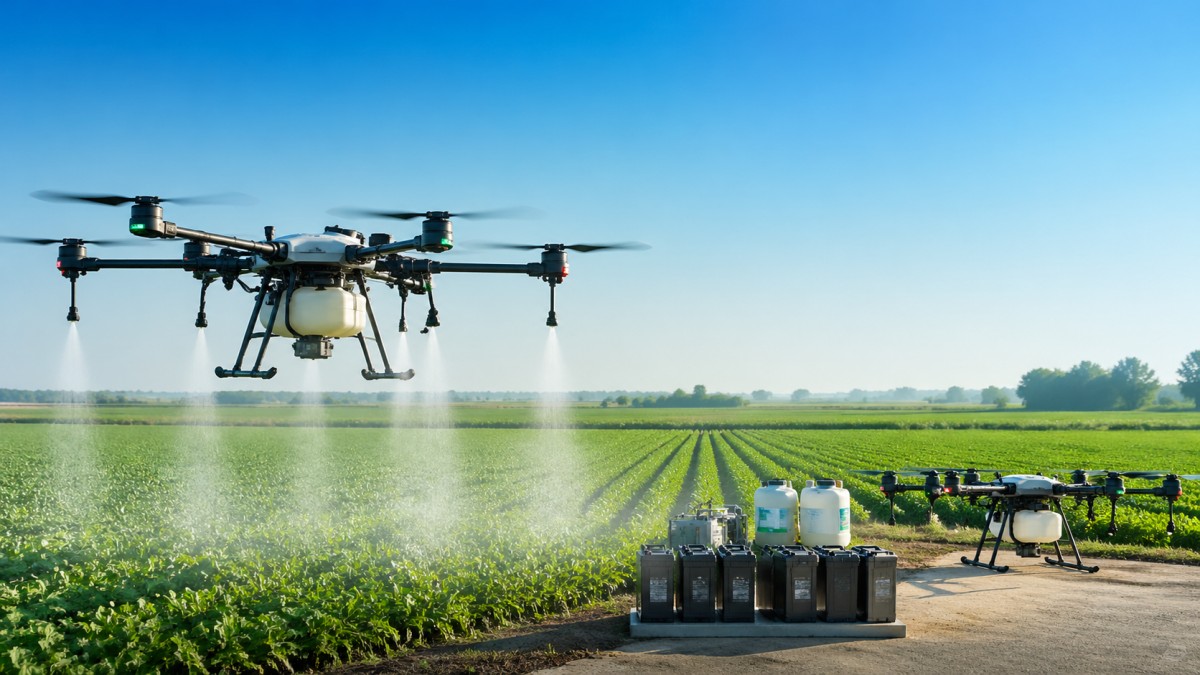
Users searching this topic usually want one answer: which metric best predicts real spraying productivity in the field. The answer is coverage efficiency, because tank size is only one variable inside a larger operating system.
Two drones can carry similar liquid volumes yet deliver very different daily output. The higher-performing platform is often the one that maintains stable spray width, follows precise routes, minimizes overlap, shortens refill cycles, and returns to work faster. In practice, hectare output depends on the combination of:
- Effective spray width in actual field conditions
- Forward speed without sacrificing droplet deposition quality
- Battery endurance under payload
- Refill and battery swap time
- Navigation accuracy on irregular fields
- Terrain-following stability
- Downtime from maintenance or calibration
This is why a drone with a smaller tank can outperform a bigger model across a full workday. If it flies cleaner lines, wastes less spray through overlap, and spends less time on the ground, its total treated area may be higher.
What researchers, operators, buyers, and decision-makers really need to compare
Each audience segment cares about the same system from a different angle.
Information researchers typically want comparable metrics instead of marketing claims. They need operational data such as hectares per hour, refill downtime, spray uniformity, and route repeatability.
Operators care about whether the drone can finish work reliably in real farm conditions. They focus on ease of mission planning, pump consistency, terrain adaptation, battery logistics, maintenance burden, and stable coverage in wind or uneven crop height.
Procurement teams need a fair framework for vendor comparison. They should look beyond payload and ask for verified benchmarks on field efficiency, consumable costs, operator training requirements, spare parts access, software compatibility, and fleet scaling.
Business decision-makers care about output, utilization, and risk. Their question is not “Which drone has the biggest tank?” but “Which system gives the best cost per hectare with acceptable operational risk?”
For all four groups, the most useful comparison metrics are:
- Actual hectares covered per hour and per day
- Coverage consistency across different field shapes
- Refill plus battery swap cycle time
- Spray accuracy and overlap control
- Reliability across a season
- Integration with planning, mapping, and reporting tools
How to evaluate real hectare output instead of advertised payload
If you are selecting an agricultural drone for crop spraying, treat advertised tank volume as secondary evidence. The primary evaluation should be a field productivity model.
A practical method is to estimate mission output using five layers:
- Nominal treatment width: the claimed spray swath under ideal conditions
- Effective field width: the realistic width after overlap, wind, and edge losses
- Loaded flight time: usable working minutes with spray system active
- Turnaround time: refill, battery replacement, and restart delay
- Field complexity factor: losses from irregular boundaries, obstacles, and elevation changes
This approach gives a much better estimate of productivity than payload alone. A bigger tank may extend each sortie, but if the drone becomes less agile, needs longer charging logistics, or loses spray uniformity at speed, the gain may be smaller than expected.
For procurement and benchmarking, ask suppliers for test results under conditions close to your own operation:
- Flat row crops vs. orchards or mixed terrain
- Short shuttle distance vs. long return path
- Low-wind vs. moderate-wind operation
- Single-drone use vs. coordinated fleet use
Without this context, payload claims are often incomplete and sometimes misleading.
Why software integration changes productivity more than many buyers expect
Hardware efficiency is only part of the equation. In large-scale spraying operations, software integration often decides whether the aircraft performs like a tool or like a scalable production asset.
A strong uav fleet management system improves dispatching, battery rotation, mission scheduling, pilot workload, and operational visibility. This matters especially when managing multiple drones across separate plots. Instead of treating each aircraft as a stand-alone machine, the operation becomes coordinated and measurable.
Likewise, drone photogrammetry software integration adds value before and after spraying. Before application, field maps can improve route planning, boundary accuracy, obstacle detection, and treatment-zone definition. After application, data can support traceability, compliance records, and performance review.
For buyers and enterprise teams, software questions should be part of the procurement checklist:
- Can flight planning import field boundaries from mapping workflows?
- Can mission logs be exported for compliance and reporting?
- Does the fleet platform track utilization, downtime, and operator performance?
- Can it support variable-rate or zone-based spraying in future workflows?
- How easy is it to integrate with existing farm management or GIS systems?
When two spraying drones appear similar on paper, the one with better data integration may produce lower total operating cost and better decision support over time.
Common buying mistakes when comparing crop spraying drones
The most frequent market mistake is equating bigger capacity with better productivity. But several other errors also distort buying decisions:
- Ignoring refill ecosystem: Ground support design, mixing workflow, and battery logistics strongly affect daily output.
- Overlooking droplet quality: Fast coverage is meaningless if deposition is poor or drift risk is high.
- Using only ideal-condition demos: Real performance should be evaluated in representative crop and terrain conditions.
- Undervaluing operator usability: A complex platform can reduce consistency, especially with seasonal staff or multi-team deployment.
- Skipping lifecycle support review: Spare parts lead time, local service, and software updates directly affect uptime.
For enterprise procurement, these mistakes create hidden costs that do not show up in the original equipment quote but appear later as lower utilization, delayed treatment windows, or uneven application quality.
What a better decision framework looks like
A smarter evaluation model for agricultural drone for crop spraying should rank systems by operational outcome, not by headline specification. A practical shortlist framework includes:
- Coverage productivity: hectares per hour and per day
- Mission efficiency: route quality, overlap reduction, and field adaptability
- Ground-cycle efficiency: refill and battery turnaround
- Application quality: spray uniformity, drift control, and terrain following
- System intelligence: uav fleet management system capability and software interoperability
- Total cost of operation: labor, consumables, downtime, maintenance, and training
- Scalability: suitability for expanding acreage or multi-drone deployment
This framework is especially useful for organizations that need repeatable decision logic across multiple regions, suppliers, or crop types. It also aligns with a data-first procurement approach: remove marketing noise, define comparable operating metrics, and judge platforms by measurable output.
Conclusion: the best spraying drone is the one that treats more area reliably
The central takeaway is clear: in agricultural drone for crop spraying, coverage beats tank size because productivity is a system-level result. Tank volume matters, but only as one contributor among spray width, mission speed, turnaround time, route precision, and software integration.
For researchers, the right lens is comparable field-performance data. For operators, it is reliable mission flow and application consistency. For procurement teams, it is cost per hectare and supportability. For executives, it is scalable output with lower risk.
If you want a sound buying or benchmarking decision, compare drones by actual hectare delivery, refill downtime, and data integration readiness. That is the metric set most likely to reveal real value and avoid oversized claims built around tank capacity alone.
Search News
Hot Articles
- Carbon Fiber StructuresHow to Specify Aerospace Carbon Fiber Assemblies for Lightweight, Load-Bearing PartsJul 11, 2026
- Machine VisionXiaomi, Alibaba DAMO Academy Drive Open-Source Robotics Model Ecosystem, Lowering Algorithm Development Barriers for Overseas SMEs Adopting Chinese Robotics SolutionsMar 30, 2026
- Cobots & ArmsShanxi 'AI+' Conference Showcases Embodied Intelligence with Multinational Buyer Engagement: Key Industry ImplicationsMar 30, 2026
Popular Tags
Recommended News
 Jul 11, 2026How to Specify Aerospace Carbon Fiber Assemblies for Lightweight, Load-Bearing PartsAerospace carbon fiber assemblies: learn how to specify laminate design, load data, joining methods, and inspection controls for lighter, reliable load-bearing aerospace parts.Elena Rostova (UAV Systems Researcher)
 Mar 30, 2026Xiaomi, Alibaba DAMO Academy Drive Open-Source Robotics Model Ecosystem, Lowering Algorithm Development Barriers for Overseas SMEs Adopting Chinese Robotics SolutionsXiaomi & Alibaba DAMO Academy's open-source robotics models lower algorithm barriers for global SMEs. Boost efficiency in manufacturing, logistics & smart retail with ROS 2 compatible solutions.TSV Data Lab
 Mar 30, 2026Shanxi 'AI+' Conference Showcases Embodied Intelligence with Multinational Buyer Engagement: Key Industry ImplicationsShanxi 'AI+' Conference highlights embodied intelligence with Tesla, Ubtech & Jiantao showcasing multimodal robotics. 40+ global buyers validated tech on-site, creating new B2B channels for industrial automation & AI solutions.Chen Wei (Automation Lead Engineer)
 Mar 30, 2026Zhongguancun Unveils 6G Integrated Sensing-Computing-Intelligence Platform to Empower Embodied Robots for Global Industrial ApplicationsZhongguancun's new 6G platform revolutionizes industrial robotics with <10ms latency, empowering global automotive, logistics & port automation. Discover how this tech boosts China's smart manufacturing exports.TSV Data Lab
 Mar 30, 2026Mech-Mind Tianjin Embodied Intelligence R&D and Production Base Goes Live, Cutting Delivery Time by 20%–30% for Global Customized AMR+Vision SolutionsMech-Mind's Tianjin AMR+Vision production base cuts delivery time by 20%-30% for欧美 & Latin American markets. Discover how this PLd-certified facility accelerates customized robotics solutions for smart manufacturing and logistics.Chen Wei (Automation Lead Engineer)
 Mar 30, 2026Boao Forum Reveals 'Co-evolution of Big and Small Brains' Trend in Humanoid Robots, China's Embodied Intelligence Accelerates Adaptation to Overseas Manufacturing Service ScenariosDiscover how China's humanoid robots, featuring 'Co-evolution of Big and Small Brains,' are revolutionizing global manufacturing. Learn about Embodied Tian Gong 3.0's ISO compliance and overseas deployment at Boao Forum 2026.Chen Wei (Automation Lead Engineer)
 Mar 30, 2026China Railway Industrial Secures Patent for Embodied Robotics in Material Handling, Boosting High-Precision Delivery Capabilities for Overseas Infrastructure and Manufacturing ProjectsChina Railway Industrial's new patent for embodied robotics in material handling boosts high-precision delivery for global infrastructure & manufacturing. Discover how this innovation enhances logistics accuracy in automotive, rail transit & EPC projects.Chen Wei (Automation Lead Engineer)
 Oct 25, 2026Hesai Leads Global ADAS Main Lidar Shipments in Yole’s 2026 ReportHesai led global ADAS main lidar shipments with a 43% share in 2025, according to Yole’s 2026 report. Explore what this ranking reveals about its automotive market position.TSV Data Lab
 Oct 25, 2026Choosing an Aerospace Materials Manufacturer: Quality and Traceability ChecksChoosing an aerospace materials manufacturer? Learn how to verify certifications, test reports, and lot traceability to qualify suppliers confidently and reduce costly sourcing risks.Dr. Marcus Vance
 Oct 24, 2026Guotai Haitong: Global Entry-Level 3D Printer Shipments Rose 39% in Q1 2026Entry-level 3D printer shipments rose 39% in Q1 2026, Guotai Haitong reports. Explore how AI, multicolor printing and print farms are shaping market growth.Dr. Marcus Vance
 Oct 24, 2026Choosing an Industrial Vision Inspection Supplier: Acceptance Tests That MatterChoose an industrial vision inspection supplier with confidence. Discover acceptance tests for defect detection, false rejects, production speed, and reliable part rejection before you buy.TSV Data Lab
 Oct 23, 2026US Navy Raises Gecko Robotics Contract Ceiling to $300M for Robotic Fleet MaintenanceUS Navy raises Gecko Robotics’ contract ceiling to $300M for Pacific Fleet robotic inspections. Explore potential opportunities for maintenance suppliers and key procurement considerations.Chen Wei (Automation Lead Engineer)
 Oct 23, 2026Choosing Industrial Sensing Systems for Global Plants: Protocol CompatibilityCompare industrial sensing systems international buyers can trust. Explore protocol compatibility, reduce integration risks, and select proven configurations for reliable global plant deployments.TSV Data Lab
 Oct 22, 2026KUKA Showcases Physical AI and iiQKA.AI Vision at NVIDIA GTC BerlinExplore KUKA’s Physical AI showcase at NVIDIA GTC Berlin and discover how iiQKA.AI Vision aims to simplify robotic vision integration and improve 2D and 3D scene recognition.TSV Data Lab
 Oct 22, 2026Robotic Machining of Advanced Composites: What Tolerances Are Achievable?Explore advanced materials machining robotics: discover what drives achievable composite tolerances and how to validate accuracy before investing in your next machining system.Dr. Marcus Vance
 Oct 21, 2026China’s Industrial Robot Exports Near RMB 10 Billion in First Nine Months of 2026China’s industrial robot exports neared RMB 10 billion in January–September 2026, with value rising faster than volume. Explore the data and what it could mean for suppliers.Chen Wei (Automation Lead Engineer)
 Oct 21, 2026Low-Latency Industrial Data Processing: Pricing and Key Cost DriversExplore industrial data latency price drivers, from edge hardware to integration and support. Learn how to compare quotes, verify performance, and avoid unnecessary costs.TSV Data Lab
 Oct 20, 2026KUKA Launches iiQKA.AI Vision to Simplify Industrial Image ProcessingKUKA iiQKA.AI Vision simplifies industrial image processing with controller-based 2D and 3D vision. Explore drag-and-drop setup for vision-guided automation.TSV Data Lab
 Oct 20, 2026Smart Industrial Edge Devices: Key Criteria for Legacy PLC IntegrationChoose smart industrial edge devices for legacy PLC integration. Discover key criteria for compatibility, data quality, security, and reliable collection without disrupting control.TSV Data Lab
 Oct 19, 2026Choosing a Radar Sensor by Application: Range, Resolution, and Field of ViewSimplify radar sensor application based product selection. Compare range, resolution, and field of view to avoid blind spots and choose with confidence. Explore the guide.TSV Data Lab
 Oct 18, 2026Comparing Material Options for Procurement: Specs, Costs, and Supply RisksExplore procurement oriented technical content on material options, specs, costs, and supply risks. Compare alternatives to cut hidden expenses and make confident sourcing decisions.Dr. Marcus Vance
 Oct 17, 20265-Axis CNC Positioning Accuracy: How to Interpret ISO 230-2 Test ResultsAssess 5 axis CNC machining positioning accuracy with ISO 230-2. Learn to interpret repeatability, reversal error, and test conditions to compare suppliers and make confident acceptance decisions.Dr. Marcus Vance
 Oct 16, 2026Choosing a Rugged Edge AI Box Supplier: Thermal Tests and Lifecycle SupportChoose a rugged edge AI box supplier with proven thermal performance and reliable lifecycle support. Discover the tests and commitments to verify before you buy.TSV Data Lab
 Oct 15, 2026R&D Cost Reduction Services: How to Evaluate Fees, Savings, and ROIEvaluate R&D cost reduction services with confidence. Compare fees, verify savings, and calculate ROI without compromising performance. Discover how to choose a provider that delivers real value.Chen Wei (Automation Lead Engineer)