How Point Cloud Density Affects Solid State LiDAR Accuracy in Mapping and Inspection
Publication Date
author
Why Point Cloud Density Matters More Than the Headline Spec
For mapping and inspection, density is not a vanity number. It shapes what the sensor can truly resolve, verify, and defend in a technical review.
That is why solid state lidar point cloud density deserves careful analysis. A dense cloud can reveal fine edges, subtle warpage, and small discontinuities.
But density alone never tells the full story. A high count of points can still produce weak results if angular sampling, noise control, and motion compensation are poor.
In practice, technical teams need to ask a harder question. How does solid state lidar point cloud density affect usable accuracy under real operating conditions?
This distinction is important in TSV’s engineering view. Parameters only matter when they stay meaningful across speed, distance, material variation, and environmental interference.
From recent market shifts, the clearer signal is simple. Buyers are moving away from broad marketing claims and toward measurable point cloud performance.
Defining Solid State LiDAR Point Cloud Density in Practical Terms
Point cloud density usually describes how many points fall within a defined area or volume. In field work, that density changes with distance, scan pattern, and target orientation.
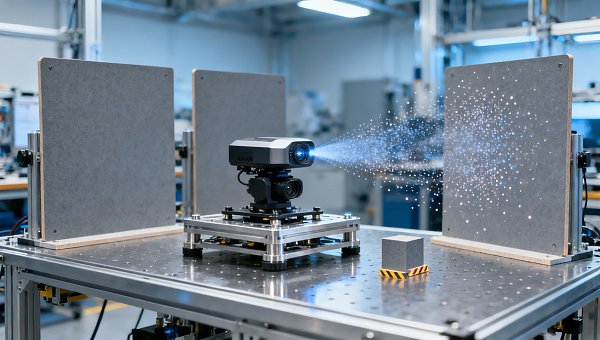
For solid-state systems, the pattern is often nonuniform. Some zones receive stronger sampling, while edge regions may become sparse or less consistent.
This is where confusion starts. Vendors may publish points per second, but that figure does not equal local spatial density on the object being measured.
A sensor generating many points can still miss small pits, narrow seams, or thin edges if the effective spacing between adjacent points is too large.
So the useful evaluation metric is not only total output. It is the effective solid state lidar point cloud density on the target surface at the working distance.
That also means density should be connected to mission geometry. Corridor mapping, tank inspection, façade scanning, and UAV surveying all stress the sensor differently.
Key factors behind usable density
- Angular resolution determines how tightly the beams sample neighboring locations.
- Range changes point spacing quickly, especially on distant or tilted surfaces.
- Platform speed can stretch sampling intervals during mobile mapping.
- Surface reflectivity influences return confidence and point retention.
- Filtering algorithms may remove noisy points and reduce final density.
How Density Influences Accuracy in Mapping
In mapping, accuracy is not only about absolute position error. It is also about how faithfully the scene geometry is reconstructed between measured points.
Higher solid state lidar point cloud density generally improves surface continuity. Roads, retaining walls, utility poles, and curb lines become easier to model with fewer interpolation gaps.
This becomes more obvious at boundaries. Sparse sampling softens edges, shifts breaklines, and reduces confidence in extracted dimensions.
For topographic products, low density can also distort small elevation transitions. Drainage channels, shoulder drops, and shallow depressions may be underrepresented.
Yet there is a practical limit. Once density exceeds the feature scale required by the deliverable, more points may increase processing cost without a proportional accuracy gain.
This is why engineering teams should define minimum feature size first. Then they can judge whether the solid state lidar point cloud density is truly sufficient.
Mapping effects seen in the field
- Better breakline extraction for roads, roofs, and embankments.
- Improved registration stability across overlapping passes.
- Higher confidence in contour generation and mesh creation.
- Reduced risk of false smoothness in terrain models.
How Density Affects Inspection Performance
Inspection tasks usually demand tighter evidence. Teams are not just mapping a surface. They are trying to confirm defects, deviations, and compliance against tolerances.
Here, solid state lidar point cloud density directly affects defect visibility. Small dents, weld inconsistencies, edge chips, and deformation zones require enough sampling to appear distinctly.
If only one or two points touch a feature, detection becomes fragile. The software may smooth it away, classify it as noise, or miss it entirely.
More importantly, density supports statistical confidence. When multiple neighboring points confirm the same local geometry, evaluators can trust the result more easily.
This matters in industrial assets with reflective coatings, dark materials, or curved profiles. Those surfaces often challenge return consistency and weaken effective point coverage.
In actual procurement reviews, the smarter question is not “How many points per second?” It is “How many reliable points land on the defect-sized feature?”
Inspection risks when density is too low
- False negatives on narrow cracks, shallow pits, or seam offsets.
- Weak edge reconstruction around cutouts and brackets.
- Lower repeatability between scans of the same part.
- Higher dependence on aggressive interpolation.
- Reduced confidence during pass or fail decisions.
Why High Density Does Not Automatically Mean High Accuracy
This is where many comparisons go wrong. Dense data can still be inaccurate if the points are noisy, biased, duplicated, or spatially unstable.
A useful mental model is simple. Density improves the opportunity to describe geometry, while accuracy depends on whether each point is placed correctly.
For example, motion distortion can smear a dense cloud. Calibration drift can shift every point. Multi-path reflections can create believable but false surfaces.
Likewise, onboard filtering may retain many points but compress local detail. The result looks rich in volume, yet weak in metrological trust.
That is why TSV recommends linking solid state lidar point cloud density to three companion metrics: range precision, repeatability, and spatial uniformity.
When these metrics move together, dense point clouds become technically valuable. When they do not, the density figure can hide real performance weakness.
A better evaluation set
How to Evaluate Solid State LiDAR Point Cloud Density During Selection
A more disciplined selection process starts with the inspection or mapping objective. Define the smallest feature that must be captured with confidence.
Then convert that feature into required point spacing. If the spacing is too coarse, the sensor is disqualified before broader integration work begins.
Next, verify density at realistic standoff distances, target angles, and vehicle speeds. Bench tests at ideal geometry rarely represent field performance.
It also helps to separate raw density from retained density. Some systems look strong initially but lose many points after filtering and registration.
In supplier discussions, request evidence instead of adjectives. Ask for spatial density maps, edge-resolution tests, and repeated scans on representative materials.
This approach aligns with the broader procurement shift. Decision-makers now want traceable engineering proof, not generalized claims about sensor superiority.
Practical evaluation checklist
- Define smallest detectable feature and tolerance threshold.
- Measure solid state lidar point cloud density on actual target materials.
- Test across near, mid, and maximum working distances.
- Compare stationary and motion scenarios.
- Review density uniformity across the full scan field.
- Confirm repeatability over multiple scan cycles.
- Check retained data after filtering and meshing.
Final Takeaway for Mapping and Inspection Decisions
Solid state lidar point cloud density matters because it defines how much geometric evidence reaches the model, the measurement, and the final decision.
For mapping, it strengthens surface continuity, breakline fidelity, and terrain interpretation. For inspection, it supports defect visibility, repeatability, and confidence in tolerance judgments.
Still, density should never be read in isolation. The more reliable signal comes from combining density with range precision, uniformity, and real-world repeatability.
That is the practical path through market noise. Focus on measurable feature coverage, not oversized marketing language or abstract point-count claims.
When teams evaluate solid state lidar point cloud density this way, they make faster, cleaner, and more defensible sensor decisions grounded in engineering truth.
Search News
Hot Articles
- Carbon Fiber StructuresHow to Specify Aerospace Carbon Fiber Assemblies for Lightweight, Load-Bearing PartsJul 11, 2026
- Machine VisionXiaomi, Alibaba DAMO Academy Drive Open-Source Robotics Model Ecosystem, Lowering Algorithm Development Barriers for Overseas SMEs Adopting Chinese Robotics SolutionsMar 30, 2026
- Cobots & ArmsShanxi 'AI+' Conference Showcases Embodied Intelligence with Multinational Buyer Engagement: Key Industry ImplicationsMar 30, 2026
Popular Tags
Recommended News
 Jul 11, 2026How to Specify Aerospace Carbon Fiber Assemblies for Lightweight, Load-Bearing PartsAerospace carbon fiber assemblies: learn how to specify laminate design, load data, joining methods, and inspection controls for lighter, reliable load-bearing aerospace parts.Elena Rostova (UAV Systems Researcher)
 Mar 30, 2026Xiaomi, Alibaba DAMO Academy Drive Open-Source Robotics Model Ecosystem, Lowering Algorithm Development Barriers for Overseas SMEs Adopting Chinese Robotics SolutionsXiaomi & Alibaba DAMO Academy's open-source robotics models lower algorithm barriers for global SMEs. Boost efficiency in manufacturing, logistics & smart retail with ROS 2 compatible solutions.TSV Data Lab
 Mar 30, 2026Shanxi 'AI+' Conference Showcases Embodied Intelligence with Multinational Buyer Engagement: Key Industry ImplicationsShanxi 'AI+' Conference highlights embodied intelligence with Tesla, Ubtech & Jiantao showcasing multimodal robotics. 40+ global buyers validated tech on-site, creating new B2B channels for industrial automation & AI solutions.Chen Wei (Automation Lead Engineer)
 Mar 30, 2026Zhongguancun Unveils 6G Integrated Sensing-Computing-Intelligence Platform to Empower Embodied Robots for Global Industrial ApplicationsZhongguancun's new 6G platform revolutionizes industrial robotics with <10ms latency, empowering global automotive, logistics & port automation. Discover how this tech boosts China's smart manufacturing exports.TSV Data Lab
 Mar 30, 2026Mech-Mind Tianjin Embodied Intelligence R&D and Production Base Goes Live, Cutting Delivery Time by 20%–30% for Global Customized AMR+Vision SolutionsMech-Mind's Tianjin AMR+Vision production base cuts delivery time by 20%-30% for欧美 & Latin American markets. Discover how this PLd-certified facility accelerates customized robotics solutions for smart manufacturing and logistics.Chen Wei (Automation Lead Engineer)
 Mar 30, 2026Boao Forum Reveals 'Co-evolution of Big and Small Brains' Trend in Humanoid Robots, China's Embodied Intelligence Accelerates Adaptation to Overseas Manufacturing Service ScenariosDiscover how China's humanoid robots, featuring 'Co-evolution of Big and Small Brains,' are revolutionizing global manufacturing. Learn about Embodied Tian Gong 3.0's ISO compliance and overseas deployment at Boao Forum 2026.Chen Wei (Automation Lead Engineer)
 Mar 30, 2026China Railway Industrial Secures Patent for Embodied Robotics in Material Handling, Boosting High-Precision Delivery Capabilities for Overseas Infrastructure and Manufacturing ProjectsChina Railway Industrial's new patent for embodied robotics in material handling boosts high-precision delivery for global infrastructure & manufacturing. Discover how this innovation enhances logistics accuracy in automotive, rail transit & EPC projects.Chen Wei (Automation Lead Engineer)
 Oct 23, 2026US Navy Raises Gecko Robotics Contract Ceiling to $300M for Robotic Fleet MaintenanceUS Navy raises Gecko Robotics’ contract ceiling to $300M for Pacific Fleet robotic inspections. Explore potential opportunities for maintenance suppliers and key procurement considerations.Chen Wei (Automation Lead Engineer)
 Oct 23, 2026Choosing Industrial Sensing Systems for Global Plants: Protocol CompatibilityCompare industrial sensing systems international buyers can trust. Explore protocol compatibility, reduce integration risks, and select proven configurations for reliable global plant deployments.TSV Data Lab
 Oct 22, 2026KUKA Showcases Physical AI and iiQKA.AI Vision at NVIDIA GTC BerlinExplore KUKA’s Physical AI showcase at NVIDIA GTC Berlin and discover how iiQKA.AI Vision aims to simplify robotic vision integration and improve 2D and 3D scene recognition.TSV Data Lab
 Oct 22, 2026Robotic Machining of Advanced Composites: What Tolerances Are Achievable?Explore advanced materials machining robotics: discover what drives achievable composite tolerances and how to validate accuracy before investing in your next machining system.Dr. Marcus Vance
 Oct 21, 2026China’s Industrial Robot Exports Near RMB 10 Billion in First Nine Months of 2026China’s industrial robot exports neared RMB 10 billion in January–September 2026, with value rising faster than volume. Explore the data and what it could mean for suppliers.Chen Wei (Automation Lead Engineer)
 Oct 21, 2026Low-Latency Industrial Data Processing: Pricing and Key Cost DriversExplore industrial data latency price drivers, from edge hardware to integration and support. Learn how to compare quotes, verify performance, and avoid unnecessary costs.TSV Data Lab
 Oct 20, 2026KUKA Launches iiQKA.AI Vision to Simplify Industrial Image ProcessingKUKA iiQKA.AI Vision simplifies industrial image processing with controller-based 2D and 3D vision. Explore drag-and-drop setup for vision-guided automation.TSV Data Lab
 Oct 20, 2026Smart Industrial Edge Devices: Key Criteria for Legacy PLC IntegrationChoose smart industrial edge devices for legacy PLC integration. Discover key criteria for compatibility, data quality, security, and reliable collection without disrupting control.TSV Data Lab
 Oct 19, 2026Choosing a Radar Sensor by Application: Range, Resolution, and Field of ViewSimplify radar sensor application based product selection. Compare range, resolution, and field of view to avoid blind spots and choose with confidence. Explore the guide.TSV Data Lab
 Oct 18, 2026Comparing Material Options for Procurement: Specs, Costs, and Supply RisksExplore procurement oriented technical content on material options, specs, costs, and supply risks. Compare alternatives to cut hidden expenses and make confident sourcing decisions.Dr. Marcus Vance
 Oct 17, 20265-Axis CNC Positioning Accuracy: How to Interpret ISO 230-2 Test ResultsAssess 5 axis CNC machining positioning accuracy with ISO 230-2. Learn to interpret repeatability, reversal error, and test conditions to compare suppliers and make confident acceptance decisions.Dr. Marcus Vance
 Oct 16, 2026Choosing a Rugged Edge AI Box Supplier: Thermal Tests and Lifecycle SupportChoose a rugged edge AI box supplier with proven thermal performance and reliable lifecycle support. Discover the tests and commitments to verify before you buy.TSV Data Lab
 Oct 15, 2026R&D Cost Reduction Services: How to Evaluate Fees, Savings, and ROIEvaluate R&D cost reduction services with confidence. Compare fees, verify savings, and calculate ROI without compromising performance. Discover how to choose a provider that delivers real value.Chen Wei (Automation Lead Engineer)
 Oct 23, 2026How Do You Evaluate Solid-State LiDAR Point Cloud Density?Evaluate solid-state LiDAR point cloud density using valid returns, angular spacing, and real-world coverage. Discover how to compare sensors and choose the right fit for your application.TSV Data Lab
 Oct 22, 2026How Do You Test AMR Navigation Accuracy in a Warehouse?Test AMR navigation accuracy in warehouses with practical methods for localization, path tracking, and docking. Learn to set tolerances and compare robots before deployment.Chen Wei (Automation Lead Engineer)
 Oct 21, 2026How Should You Balance Cobot Payload Against Reach?Explore cobot payload versus reach to choose the right robot. Learn how tooling, load limits, workspace, and cycle time affect performance—and avoid costly selection mistakes.Chen Wei (Automation Lead Engineer)
 Oct 20, 2026How Do You Measure Industrial IoT Gateway Latency Under Load?Measure industrial IoT gateway latency under load with reliable timestamps, realistic traffic, and tail-latency analysis. Discover how to expose bottlenecks and choose the right gateway.TSV Data Lab