
Slow OPC UA server response is not always a network issue
Publication Date
author
When troubleshooting slow OPC UA server response time, many teams immediately blame switches, bandwidth, or routing. In reality, the root cause may lie deeper—in mqtt broker payload size limit settings, edge processing delays, or overloaded industrial iot dashboard visualization workflows. For engineers, operators, buyers, and decision-makers, understanding why response lag is not always a network issue is essential to making faster, data-driven automation decisions.
Why a slow OPC UA server response often starts above the network layer
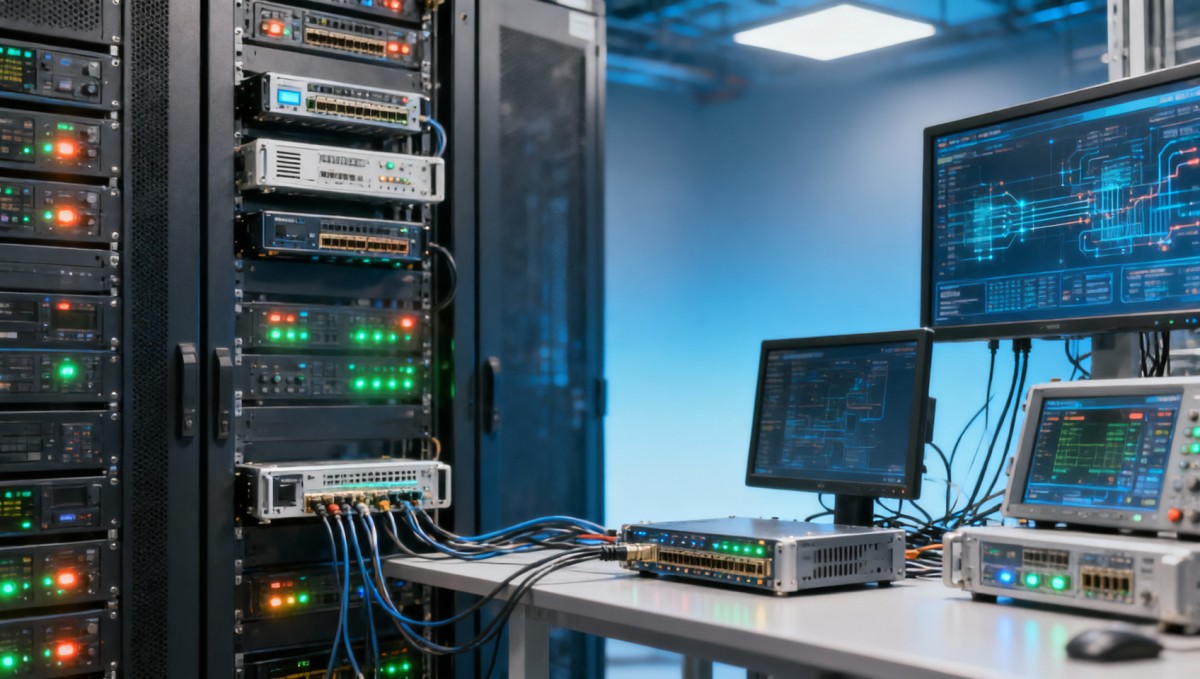
In industrial environments, an OPC UA server sits between field data, applications, historians, MES platforms, SCADA clients, and cloud connectors. When response time increases from a normal sub-second level to 2–5 seconds or more, the network is only one possible factor. In many projects, transport quality remains acceptable, while delays build up in data modeling, polling logic, security negotiation, middleware queues, or edge-to-cloud translation.
This distinction matters because the wrong diagnosis leads to the wrong budget. A procurement team may approve new switches, VLAN redesign, or higher-bandwidth uplinks, yet operators still face lagging tags and delayed alarms. For a plant running 24/7, even a seemingly small delay of 800 ms to 1.5 s can affect HMI trust, troubleshooting speed, and reaction quality during process deviations.
At TechStat Vanguard, the focus is not on generic claims but on measurable bottlenecks. Parameters do not lie. If an OPC UA server performs poorly, engineers should separate transport latency from application latency, payload handling, CPU contention, subscription design, and visualization overhead. That discipline reduces trial-and-error cycles and shortens supplier evaluation from weeks to focused technical review sessions.
A practical starting point is to divide the end-to-end path into 4 layers: device acquisition, OPC UA processing, message brokering or edge computing, and dashboard or application rendering. Once that map exists, teams can test each layer within a 15–30 minute measurement window and identify where delays accumulate instead of assuming the problem lives in cabling or routing.
- Device layer: PLC scan time, driver refresh interval, serial or fieldbus gateway conversion time.
- OPC UA layer: session count, namespace complexity, certificate checks, subscription and monitored item load.
- Edge or broker layer: mqtt broker payload size limit, topic fan-out, data transformation rules, and queue backpressure.
- Application layer: industrial iot dashboard rendering, polling frequency, historical queries, and browser-side scripting load.
Which non-network bottlenecks most often cause OPC UA response lag?
The most common hidden cause is server-side workload imbalance. An OPC UA server can appear connected and healthy while being overloaded by too many sessions, too many monitored items, or poorly grouped subscriptions. For example, 5 clients each requesting 2,000 tags at aggressive update intervals can create a very different load profile from 1 client requesting 10,000 tags in a structured subscription model.
A second cause is excessive data transformation at the edge. Many plants now bridge OPC UA to MQTT, REST APIs, data lakes, or analytics pipelines. If the edge node performs JSON expansion, topic remapping, filtering, and encryption on limited hardware, latency can rise sharply during shift change, batch transitions, or alarm storms. In those cases, the network may still show low packet loss and stable throughput.
A third cause is visualization overhead. An industrial iot dashboard can become the bottleneck when dozens of widgets refresh every 1–2 seconds, trend charts query long time ranges, and users open multiple browser tabs at once. Teams then report “slow OPC UA server response,” but the real issue is front-end rendering or back-end query contention rather than raw OPC UA transport.
The table below separates frequent bottlenecks by symptom and where buyers should ask for evidence. This is especially useful during vendor discussions, FAT planning, or edge gateway selection, because it turns a vague complaint into testable engineering checkpoints.
For buyers and engineering managers, this comparison prevents a costly misstep: replacing network hardware before proving whether the bottleneck appears in session handling, broker limits, or dashboard architecture. A structured verification process can reduce unnecessary infrastructure spend and clarify whether a software, edge hardware, or configuration change will deliver the better return.
Why payload handling and edge logic deserve closer scrutiny
In hybrid architectures, OPC UA data rarely travels unchanged from machine to user interface. It may pass through protocol converters, normalization engines, MQTT brokers, alerting services, and data storage layers. Each hop can add 50–200 ms, and under burst conditions the cumulative delay may exceed 1 second without any visible fault on the switch port or WAN link.
This is why TSV emphasizes engineering benchmarking over marketing language. A vendor saying an edge gateway is “optimized for Industry 4.0” is less useful than knowing its tested throughput range, transformation latency under load, and behavior when payload size exceeds configured broker thresholds. Those are the details that influence uptime, alarm relevance, and dashboard freshness.
For operators, the takeaway is simple: if slow OPC UA server response appears only after adding dashboards, cloud connectors, or analytics apps, the network is not the first thing to blame. Start by measuring message size, queue time, and update interval interaction across the software chain.
How should engineers and buyers diagnose the real root cause?
A useful diagnostic method is to move from the simplest direct path to the full production path. First, test the OPC UA server with one controlled client on the same local segment for 10–15 minutes. Then repeat the test through the edge layer, then through MQTT or middleware, and finally through the industrial iot dashboard. This staged comparison reveals whether delay appears at hop 1, hop 2, hop 3, or only at the user interface.
The next step is to define 5 core measurements: read latency, write acknowledgment time, subscription update interval consistency, CPU and memory usage, and queue or payload rejection events. These measurements should be logged during normal load and peak load. In many plants, the gap between off-peak and peak behavior is what exposes the real weakness in the architecture.
Procurement teams should insist on traceable test conditions. If a supplier quotes good response time, ask under what tag count, what client concurrency, what security mode, and what payload size. A claim measured at 500 tags and one client may not hold at 10,000 tags, 8 clients, signed-and-encrypted sessions, and multi-dashboard usage during a morning shift startup.
The checklist below helps cross-functional teams align. It is useful for pre-purchase qualification, retrofit planning, or vendor comparison in manufacturing, utilities, process automation, or mixed OT-IT environments where response lag affects operations and decision confidence.
- Measure direct OPC UA client response on the local network before involving dashboards or cloud services.
- Record tag volume ranges such as 500, 2,000, and 10,000 monitored items to see scaling behavior.
- Compare update intervals at 250 ms, 1 s, and 5 s to understand whether the system degrades nonlinearly.
- Check mqtt broker payload size limit, dropped-message counters, and edge queue depth during burst events.
- Review dashboard polling logic, concurrent user count, and historical query windows such as last 1 hour versus last 30 days.
- Separate network metrics from application metrics so remediation budgets target the actual source of delay.
A practical comparison framework for selection and retrofit
The table below supports procurement and engineering review by comparing where intervention usually happens. It is not a universal rule set, but it reflects common plant-level decision logic. The aim is to reduce ambiguity before approving upgrades or negotiating solution scope with system integrators and platform vendors.
This comparison helps decision-makers assign budget in the right order. In many cases, the most cost-effective step is not a broad hardware refresh but a 2–4 week validation phase, followed by targeted tuning of subscriptions, broker limits, or dashboard queries. That approach aligns with TSV’s data-first philosophy: define the bottleneck with measurable evidence, then invest where the evidence points.
What standards and technical references should teams keep in view?
When evaluating OPC UA response behavior, teams should consider interoperability, security mode selection, certificate lifecycle handling, and gateway compatibility with broader industrial architectures. In regulated or high-reliability sectors, it is also good practice to document test procedures, change controls, and acceptance thresholds as part of commissioning or supplier qualification files.
Where MQTT is involved, payload limits, retention logic, QoS strategy, and session persistence settings should be reviewed in parallel with OPC UA settings. A strong architecture is not one protocol in isolation; it is the complete chain working within defined limits and tested under realistic duty cycles.
What do operators, procurement teams, and executives each need to know?
Operators need clarity on symptoms. If trends freeze, values update in bursts, or write commands feel delayed, they should record when the issue happens and what applications are active. A response issue that appears only during report generation, dashboard-heavy use, or batch transitions points toward software load interaction, not necessarily switch or cable failure.
Procurement teams need measurable selection criteria. Instead of asking only for protocol support, ask for tested tag volume ranges, client concurrency, update interval behavior, hardware resource requirements, and expected integration boundaries. A quotation without these details may hide future change orders, troubleshooting time, or edge hardware replacement costs.
Executives need risk framing in business terms. Slow OPC UA server response can lengthen root-cause analysis, reduce trust in dashboards, delay maintenance actions, and distort KPI visibility. In distributed manufacturing, even a 3–7 day delay in identifying the real bottleneck can slow rollout plans across multiple lines or sites and inflate engineering support costs.
For all three groups, the most valuable question is not “Is the network bad?” but “Where is latency introduced, under what load, and what is the least disruptive corrective action?” That question leads to better technical conversations and more defensible capital allocation.
- For operators: log symptom timing, affected screens, and whether direct machine data looks fresher than dashboards.
- For buyers: request benchmark data at realistic workloads, not only nominal laboratory conditions.
- For decision-makers: compare the cost of diagnostic clarity against the cost of an incorrect infrastructure upgrade.
Common misconceptions that delay the fix
One misconception is that if pings are fast, the whole system is healthy. Ping tests prove little about application-layer behavior, subscription design, or dashboard rendering. Another misconception is that more bandwidth automatically means better response. If the bottleneck is CPU saturation or payload rejection, additional bandwidth may change nothing.
A third misconception is that all slowdowns are server faults. In practice, client polling logic, unoptimized dashboards, and poorly designed middleware can make a healthy server appear slow. The fourth misconception is that protocol conversion is negligible. Under light load it often is; under burst conditions it may become the main source of lag.
These misconceptions persist because industrial teams often receive fragmented information from separate vendors. TSV’s role as a data-driven hard-tech filter is to reframe the discussion around parameters, test windows, thresholds, and observable behavior rather than vendor-specific slogans.
FAQ: how to evaluate slow OPC UA server response before spending budget
How can I tell whether slow OPC UA server response is a network issue or an application issue?
Start with a direct local test using a single OPC UA client on the same segment as the server. If response remains stable there but worsens through the dashboard or edge stack, the problem is likely above the network layer. Compare at least 3 states: direct local access, access through middleware, and access through the final dashboard. This isolates where latency first appears.
What should procurement teams ask vendors before buying an OPC UA-related solution?
Ask for tested workload conditions, not broad compatibility statements. Key questions include supported monitored item ranges, expected client concurrency, response behavior at 250 ms versus 1 s update intervals, edge CPU requirements, and any mqtt broker payload size limit that may affect burst traffic. Also ask how the solution behaves during alarms, batch transitions, or dashboard peaks.
Can an industrial iot dashboard really make an OPC UA server seem slow?
Yes. A dashboard can create the appearance of server lag when it polls too aggressively, runs multiple heavy trend queries, or refreshes many widgets at the same time. If direct OPC UA tests show acceptable performance but the dashboard still lags, review polling frequency, query windows, caching, and concurrent users before changing network hardware.
What is a reasonable implementation path for fixing these issues?
A practical path usually has 3 phases. Phase 1 is baseline measurement over 2–5 days. Phase 2 is targeted tuning of subscriptions, payload policies, or dashboard queries over 1–2 weeks. Phase 3 is infrastructure change only if evidence still points to hardware or topology constraints. This staged path reduces disruption and helps justify spending with engineering evidence.
Why work with a data-driven technical partner before changing your architecture?
In complex automation systems, the expensive mistake is not only a slow OPC UA server response. The bigger mistake is solving the wrong problem. TechStat Vanguard approaches industrial performance questions through benchmark logic, traceable parameters, and technical context across robotics, edge AI, industrial gateways, and broader advanced manufacturing infrastructure.
That matters for information researchers comparing architectures, operators escalating recurring lag, procurement teams preparing RFQs, and executives deciding where modernization budgets should go. Instead of relying on vague claims, you can structure discussions around 4 practical areas: parameter confirmation, solution selection, delivery scope, and risk control in real operating conditions.
If your team is evaluating whether the issue sits in the OPC UA server, the edge layer, mqtt broker payload size limit settings, or industrial iot dashboard design, a focused technical review can shorten decision cycles. It can also help define test conditions for supplier comparison, pilot validation, or rollout planning across multiple lines and facilities.
Contact us to discuss response-time diagnostics, architecture comparison, parameter review, integration boundaries, delivery timing, and supplier evaluation criteria. Typical consultation topics include tag volume planning, edge gateway selection, dashboard load strategy, protocol handoff design, acceptance test checkpoints, customization scope, and quotation alignment for multi-site industrial projects.
Search News
Hot Articles
- Carbon Fiber StructuresHow to Specify Aerospace Carbon Fiber Assemblies for Lightweight, Load-Bearing PartsJul 11, 2026
- Machine VisionXiaomi, Alibaba DAMO Academy Drive Open-Source Robotics Model Ecosystem, Lowering Algorithm Development Barriers for Overseas SMEs Adopting Chinese Robotics SolutionsMar 30, 2026
- Cobots & ArmsShanxi 'AI+' Conference Showcases Embodied Intelligence with Multinational Buyer Engagement: Key Industry ImplicationsMar 30, 2026
Popular Tags
Recommended News
 Jul 11, 2026How to Specify Aerospace Carbon Fiber Assemblies for Lightweight, Load-Bearing PartsAerospace carbon fiber assemblies: learn how to specify laminate design, load data, joining methods, and inspection controls for lighter, reliable load-bearing aerospace parts.Elena Rostova (UAV Systems Researcher)
 Mar 30, 2026Xiaomi, Alibaba DAMO Academy Drive Open-Source Robotics Model Ecosystem, Lowering Algorithm Development Barriers for Overseas SMEs Adopting Chinese Robotics SolutionsXiaomi & Alibaba DAMO Academy's open-source robotics models lower algorithm barriers for global SMEs. Boost efficiency in manufacturing, logistics & smart retail with ROS 2 compatible solutions.TSV Data Lab
 Mar 30, 2026Shanxi 'AI+' Conference Showcases Embodied Intelligence with Multinational Buyer Engagement: Key Industry ImplicationsShanxi 'AI+' Conference highlights embodied intelligence with Tesla, Ubtech & Jiantao showcasing multimodal robotics. 40+ global buyers validated tech on-site, creating new B2B channels for industrial automation & AI solutions.Chen Wei (Automation Lead Engineer)
 Mar 30, 2026Zhongguancun Unveils 6G Integrated Sensing-Computing-Intelligence Platform to Empower Embodied Robots for Global Industrial ApplicationsZhongguancun's new 6G platform revolutionizes industrial robotics with <10ms latency, empowering global automotive, logistics & port automation. Discover how this tech boosts China's smart manufacturing exports.TSV Data Lab
 Mar 30, 2026Mech-Mind Tianjin Embodied Intelligence R&D and Production Base Goes Live, Cutting Delivery Time by 20%–30% for Global Customized AMR+Vision SolutionsMech-Mind's Tianjin AMR+Vision production base cuts delivery time by 20%-30% for欧美 & Latin American markets. Discover how this PLd-certified facility accelerates customized robotics solutions for smart manufacturing and logistics.Chen Wei (Automation Lead Engineer)
 Mar 30, 2026Boao Forum Reveals 'Co-evolution of Big and Small Brains' Trend in Humanoid Robots, China's Embodied Intelligence Accelerates Adaptation to Overseas Manufacturing Service ScenariosDiscover how China's humanoid robots, featuring 'Co-evolution of Big and Small Brains,' are revolutionizing global manufacturing. Learn about Embodied Tian Gong 3.0's ISO compliance and overseas deployment at Boao Forum 2026.Chen Wei (Automation Lead Engineer)
 Mar 30, 2026China Railway Industrial Secures Patent for Embodied Robotics in Material Handling, Boosting High-Precision Delivery Capabilities for Overseas Infrastructure and Manufacturing ProjectsChina Railway Industrial's new patent for embodied robotics in material handling boosts high-precision delivery for global infrastructure & manufacturing. Discover how this innovation enhances logistics accuracy in automotive, rail transit & EPC projects.Chen Wei (Automation Lead Engineer)
 Oct 14, 2026Drone Frame Composites: Carbon Fiber vs. Fiberglass for Weight and StiffnessExplore drone structural materials composites: compare carbon fiber and fiberglass for weight, stiffness, cost, and antenna compatibility. Find the right material for your drone frame.Elena Rostova (UAV Systems Researcher)
 Oct 13, 2026Smart Cameras vs. PC-Based Machine Vision: Which Fits High-Speed Inspection?This industrial product comparison for machine vision weighs smart cameras vs. PC-based systems on latency, throughput, and cost. Discover your best fit for high-speed inspection.TSV Data Lab
 Oct 12, 2026How to Verify RoHS Compliance in Industrial Sensing Systems Before DeploymentRoHS compliant sensing systems: learn how to verify materials, supplier declarations, testing, and configuration controls before industrial deployment.TSV Data Lab
 Oct 11, 2026How Procurement-Oriented Content Taxonomy Improves B2B Buying JourneysProcurement-oriented content taxonomy streamlines B2B buying journeys with clearer evidence, supplier comparisons, risk visibility, and faster approvals.TSV Data Lab
 Oct 10, 2026How to Select a Machine Performance Monitoring Platform for OEE and Downtime ReductionMachine performance monitoring platform selection guide: validate machine states, OEE data, downtime reasons, integrations, and scalability to reduce losses with confidence.TSV Data Lab
 Oct 08, 2026How to Machine Inconel 625 Blades Without Heat Cracks or Edge ChippingInconel 625 blade machining guide: prevent heat cracks, edge chipping, chatter, and work hardening with proven tooling, cooling, fixturing, and inspection strategies.Dr. Marcus Vance
 Oct 07, 2026How to Evaluate an HMI Panel Distributor for Industrial Automation ProjectsHMI panel distributor evaluation guide: verify technical compatibility, traceability, supply reliability, lifecycle support, and total cost for automation projects.Victor Lin (Chief Software Architect)
 Oct 06, 2026Navigation Fault Tolerance Standards for AMRs: What Safety Teams Must VerifyNavigation fault tolerance standards: learn what AMR safety teams must verify, from localization loss and sensor faults to stopping distance, safe restart, and site-specific validation.Chen Wei (Automation Lead Engineer)
 Oct 05, 2026Calculating Edge Computing Total Cost of Ownership Across Distributed SitesEdge computing ownership cost explained: calculate deployment, energy, connectivity, security, remote support, and refresh costs across distributed sites.TSV Data Lab
 Oct 04, 2026CAD/CAM Benchmarking in the GCC: What Manufacturers Should Ask a ConsultantCAD CAM benchmark consultant GCC guide: learn the key questions manufacturers should ask to validate post-processors, workflows, machine performance, and production risk.Victor Lin (Chief Software Architect)
 Oct 03, 2026Selecting Automotive Radar Sensor Modules for ADAS Range, Resolution, and IntegrationAutomotive radar sensor module selection guide for ADAS: compare range, resolution, field of view, latency, and integration to build safer, reliable vehicle systems.TSV Data Lab
 Oct 02, 2026How to Qualify Machined Parts Suppliers for Hard Tech ProgramsHard tech supply chain machined parts demand rigorous supplier qualification. Learn how to assess capability, traceability, quality controls, and delivery resilience.Dr. Marcus Vance
 Oct 01, 2026How to Select an Outdoor Security Radar Sensor for Perimeter Detection?Outdoor security radar sensor selection guide: compare range, accuracy, false-alarm control, integration, and field testing for reliable perimeter detection.TSV Data Lab
 Sep 30, 2026How to Evaluate Solid-State LiDAR Hardware for Outdoor Autonomous VehiclesSolid state LiDAR hardware evaluation guide for outdoor autonomous vehicles—compare range, point-cloud quality, environmental resilience, integration, and safety.TSV Data Lab
 Sep 29, 2026ISO 9283 Repeatability: How to Evaluate Cobot Positioning PerformanceISO 9283 cobot repeatability explained: learn how payload, reach, approach direction, and test conditions affect positioning performance and cell capability.Chen Wei (Automation Lead Engineer)
 Oct 14, 2026How tight can micro machining aerospace tolerances be in production?Micro machining aerospace tolerances can reach low-micron levels in production. Learn what controls repeatability, inspection confidence, and flight-critical quality.Dr. Marcus Vance
 Oct 13, 2026How to keep an industrial robotic integration project on scheduleIndustrial robotic integration project management: keep automation on schedule with proven controls for interfaces, suppliers, FAT, commissioning, and change risk.Victor Lin (Chief Software Architect)























