Harmonic drive gear backlash test results can look better than reality
Publication Date
author
Harmonic drive gear backlash test results can appear cleaner than real-world performance, especially when setup methods, load states, and reporting windows are optimized. For engineers, buyers, and decision-makers comparing a harmonic drive gear backlash test with servo motor mtbf data, cobot repeatability tolerance, or 6 axis robot calibration methods, the real question is not the headline number—but whether it reflects operating truth under production conditions.
In robotics, automation, aerospace motion systems, and precision positioning equipment, backlash is rarely judged in isolation. It interacts with torsional stiffness, encoder resolution, thermal drift, servo tuning, load direction changes, and installation geometry. A harmonic drive that looks excellent in a low-load bench test may behave very differently after 8-hour duty cycles, bidirectional indexing, shock loading, or repeated stop-start motion.
That distinction matters for four groups at once: information researchers screening technical claims, operators responsible for stable machine output, procurement teams comparing suppliers, and executives trying to reduce qualification risk. At TechStat Vanguard, the practical issue is not whether a supplier can publish a small backlash number such as 1 arc-min or 30 arc-sec. The issue is whether the test method reveals engineering truth.
Why harmonic drive backlash figures often look better than production reality
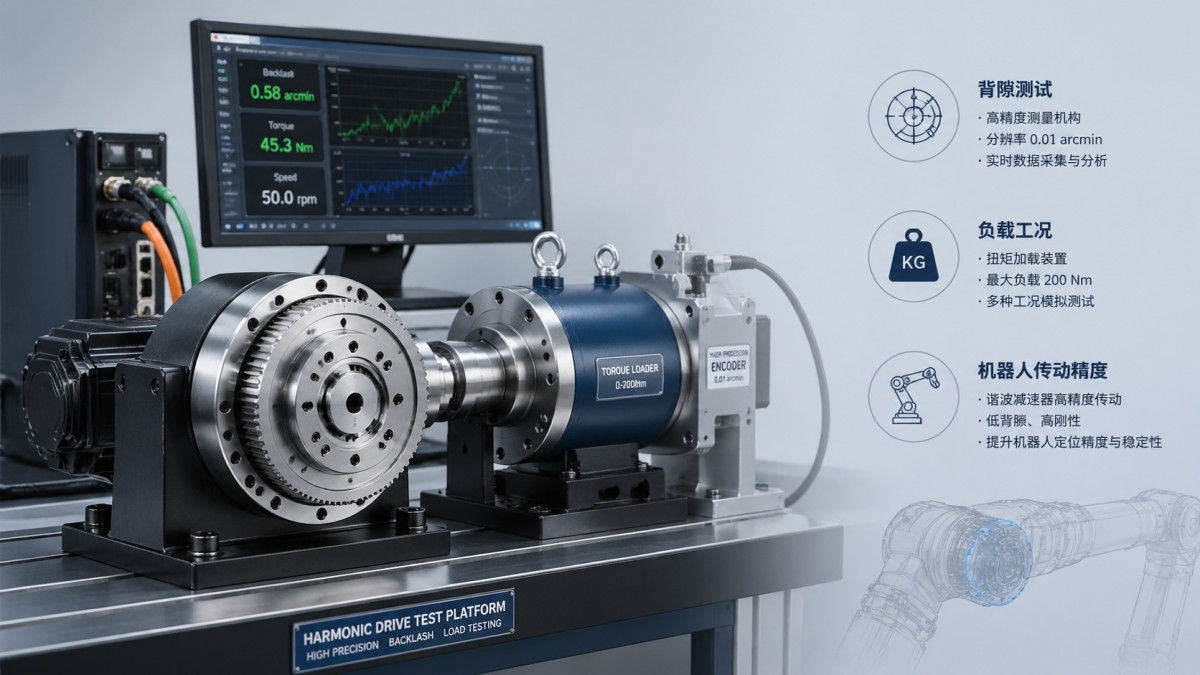
A harmonic drive gear backlash test can be influenced by at least 5 setup variables before a motor ever turns in a real machine: preload condition, applied output torque, measurement direction, temperature state, and angular sampling window. If those conditions are tuned to minimize visible lash, the published result may be technically valid for that exact setup while still being misleading for real operation.
One common issue is low-load testing. Under near-zero output torque, elastic deformation in the flexspline and wave generator may not fully appear. Once the unit sees 20%, 40%, or 60% of rated torque in a robot joint or indexing table, the measured lost motion can rise. For systems that reverse direction hundreds or thousands of times per shift, the practical error budget is shaped by dynamic reversal behavior, not static no-load data alone.
Another issue is reporting window selection. Some test reports focus on a narrow angular segment where the transmission behaves most favorably. But a 360-degree sweep, or at least a multi-position test across 8 to 12 angular stations, often reveals variation caused by assembly stack-up, bearing influence, encoder coupling, and mounting flatness. For procurement teams, a single “best case” figure should never be treated as a system-wide truth.
Temperature also matters more than many catalog readers expect. In compact servo-driven joints, gearbox temperature can move from 22°C ambient to 50°C or even 70°C in enclosed duty cycles. Material expansion, grease behavior, and preload shift can all affect the feel of backlash and hysteresis. A backlash value measured after 3 minutes on a room-temperature bench is not equivalent to a stabilized result after 45 to 90 minutes of thermal soak.
Static backlash is not the same as dynamic lost motion
Many users mix three different ideas: static backlash, lost motion, and repeatability. Static backlash usually refers to mechanical free play under defined conditions. Lost motion includes elastic compliance, friction effects, and directional reversal delay. Repeatability measures how closely the system returns to the same commanded point over many cycles. A harmonic drive can show very small static backlash yet still produce poorer dynamic positioning when the whole drivetrain is loaded.
Key reasons published values may understate field behavior
- Tests are run at near-zero torque rather than at 30% to 50% of rated operating load.
- Direction reversal is measured over only 1 to 3 cycles instead of 100 to 500 cycles.
- Data is taken before thermal stabilization, often within the first 10 minutes.
- Only one angular position is reported instead of a full rotation map.
- Fixture rigidity is much higher than the actual machine-side mounting structure.
For B2B buyers, the practical takeaway is simple: backlash values are useful only when tied to test conditions. If the conditions are incomplete, the number is incomplete.
How to read a harmonic drive gear backlash test report without being misled
A credible report should disclose not just the final value but the test framework behind it. Engineers evaluating robotics joints, UAV gimbal drives, semiconductor positioning axes, or medical automation platforms should ask whether the data reflects bench idealization or production-equivalent stress. In many cases, a report becomes decision-grade only when it includes at least 6 pieces of context: load, speed, temperature, cycle count, mounting method, and measurement instrument resolution.
The table below highlights how report quality changes decision quality. This is especially important when harmonic drive results are being compared against servo motor MTBF, cobot repeatability tolerance, or 6 axis robot calibration records in a multi-vendor sourcing process.
The main conclusion is that the number itself is less important than the reporting envelope around it. A small headline figure without boundary conditions is weak evidence. A slightly larger value with complete methodology is usually more trustworthy for sourcing decisions.
Questions buyers should ask suppliers
- At what percentage of rated torque was backlash or lost motion measured?
- Was the result taken before or after thermal stabilization, and for how long?
- What encoder or metrology resolution was used: for example 1 arc-sec, 5 arc-sec, or coarser?
- Was the gearbox tested standalone or mounted in the same structure used in the target application?
- Does the report separate mechanical backlash from servo tuning and control-loop compensation?
These questions are not administrative details. They directly affect whether a robot joint meets path accuracy, whether an inspection platform maintains repeatability within ±0.02 mm to ±0.10 mm, and whether the commissioning team spends 2 days or 2 weeks fighting residual positioning errors.
Cross-checking backlash data with servo MTBF, cobot repeatability, and robot calibration
Backlash should never be validated as a stand-alone procurement metric. In integrated motion systems, three adjacent indicators often reveal whether a gearbox result is realistic: servo motor MTBF under duty load, cobot repeatability tolerance in the final arm, and the stability of 6 axis robot calibration after installation. If those metrics do not align, the gearbox test may be presenting an incomplete story.
For example, a supplier may claim very low harmonic drive backlash, but the complete axis still shows repeatability only at ±0.08 mm when comparable systems deliver ±0.03 mm to ±0.05 mm in similar payload classes. That gap can come from compliance, mounting distortion, bearing preload mismatch, servo gain limitations, or gearbox behavior under transient torque. The right response is not to accept or reject one metric blindly, but to reconcile them.
Servo MTBF is also relevant because long-life performance affects backlash stability over time. A servo motor may be rated for 20,000 to 40,000 hours under standard conditions, yet if heat, vibration, or tuning instability accelerates drivetrain stress, the effective backlash trend can change well before the nominal life target. Durable system performance depends on the interaction of motor, reducer, coupling, bearing support, and control loop.
Robot calibration data can reveal hidden issues that static tests miss. If a 6 axis robot requires frequent recalibration after payload changes, relocation, or 3 to 6 months of operation, the cause may include structural compliance and drivetrain reversal characteristics. In other words, calibration drift can be a downstream symptom of test-report optimism upstream.
A practical comparison framework
The following matrix can help engineering and procurement teams compare drivetrain truthfulness across suppliers instead of comparing isolated catalog values.
When these four indicators point in the same direction, supplier claims become far more credible. When one metric looks exceptional but the surrounding system data looks ordinary, caution is warranted.
Test methods that better reflect production conditions
If the goal is engineering truth rather than a marketing-friendly graph, the harmonic drive gear backlash test should be redesigned around production realism. That does not mean every buyer needs a full laboratory campaign, but it does mean the protocol should simulate the machine’s actual duty envelope as closely as possible. In many industrial settings, a useful benchmark can be created in 3 stages: static characterization, thermally stabilized loaded testing, and directional cycle endurance.
Static characterization should start with measured mounting flatness, bearing preload verification, and bidirectional torque application at more than one load point. A practical minimum is 0%, 25%, and 50% of expected operating torque. For high-dynamics systems such as robot wrists or UAV gimbal actuation, adding 70% to 80% transient peaks may also be appropriate if short overloads are part of actual use.
Thermally stabilized testing should run long enough for the reducer, motor, and housing to reach a repeatable operating state. In many compact electromechanical assemblies, this means 45 to 90 minutes rather than a few quick reversals. Measurements should be repeated after stabilization because lost motion, friction, and control-loop compensation may all shift once temperature rises.
Directional cycle endurance is where many optimistic test reports fall short. Instead of reporting the first reversal result, a more useful method logs backlash or lost motion after 100, 1,000, or application-relevant cycle counts. This helps expose settling effects, lubrication redistribution, and micro-wear patterns that are invisible in showroom-style measurement snapshots.
Recommended validation steps for sourcing and FAT
- Measure backlash at a minimum of 3 torque levels tied to the intended duty profile.
- Map results at 8 or more angular positions rather than a single indexing point.
- Repeat tests before and after a 60-minute thermal stabilization period.
- Record both mechanical backlash and full-axis lost motion under servo control.
- Include fixture stiffness notes so the result can be compared with final machine structure.
- Recheck after commissioning, especially if base flatness or alignment changed during installation.
Where these methods matter most
These stronger methods are especially valuable in collaborative robots, semiconductor automation, aerospace test rigs, optical inspection platforms, antenna positioning, and medical device assembly. In such applications, even small differences in lost motion can compound into path deviation, poor image registration, unstable force control, or repeated calibration effort.
Procurement guidance, common mistakes, and decision rules for B2B teams
Procurement teams often inherit backlash values from engineering, then convert them directly into supplier scorecards. That creates risk if the value was not normalized by test conditions. A stronger sourcing model assigns weight not only to measured performance, but also to transparency of method, consistency across system metrics, and validation effort required after delivery. In practical terms, a reducer with a slightly larger disclosed value may create less project risk than one with a lower but poorly documented figure.
A useful commercial rule is to divide suppliers into 3 tiers. Tier 1 suppliers disclose method, provide multi-load and thermal data, and can support acceptance testing. Tier 2 suppliers provide acceptable figures but incomplete envelopes. Tier 3 suppliers offer headline numbers with little context. This approach helps decision-makers align engineering certainty with commercial exposure, particularly when qualification cycles need to stay within 4 to 8 weeks.
Operators should also be included earlier than many teams expect. Machine users often notice reversal softness, indexing delay, or compensation instability long before a procurement spreadsheet captures it. Their field observations can help distinguish whether a backlash issue comes from gearbox behavior, servo tuning, mechanical mounting, or process programming.
For enterprise decision-makers, the objective is not to eliminate all uncertainty, but to reduce expensive surprises. If a low-cost source saves 8% on unit price but adds 3 weeks to commissioning, forces repeated calibration, or increases scrap in precision motion tasks, the total cost quickly shifts. Reliable drivetrain truth usually lowers qualification friction, service intervention, and process instability.
Common sourcing mistakes
- Comparing backlash numbers from different suppliers without matching load and temperature conditions.
- Treating catalog backlash as equal to assembled-axis repeatability.
- Ignoring fixture stiffness, mounting flatness, and coupling alignment in factory acceptance tests.
- Failing to request post-installation verification after the machine enters real duty cycles.
- Using only unit price instead of evaluating commissioning time, calibration drift, and maintenance burden.
FAQ for technical evaluators and buyers
How many test points are enough for a meaningful backlash review?
For most sourcing evaluations, 3 load points and 8 angular positions form a practical minimum. For high-precision robotic or aerospace motion stages, a full 360-degree map and post-thermal retest provide stronger evidence.
Is low backlash always the top priority?
No. In many systems, torsional stiffness, repeatability, and long-term stability matter as much as the nominal backlash figure. A drive with modestly higher backlash but better stability across 1,000 reversals may outperform a lower-number alternative in production.
How long should acceptance testing take?
A focused incoming verification can often be completed in 1 to 2 days, but production-representative validation with thermal soak and repeated reversals may require 3 to 5 days depending on axis complexity and metrology setup.
When should procurement escalate a supplier claim for engineering review?
Escalation is advisable when backlash looks unusually strong relative to whole-axis repeatability, when method details are missing, or when the reported value is inconsistent with observed commissioning or calibration behavior.
For organizations building sourcing standards around hard-tech components, the most reliable path is disciplined context. Harmonic drive gear backlash test results can be useful, but only when they are interpreted alongside duty load, thermal state, repeatability, calibration stability, and long-term drivetrain behavior. That is the difference between a clean lab number and an operationally trustworthy specification.
TechStat Vanguard supports that approach by focusing on measurable engineering evidence rather than inflated descriptors. If your team is comparing reducers, robot joints, servo-driven assemblies, or supplier test reports, now is the right time to tighten your evaluation framework. Contact us to discuss a benchmark-driven review, request a custom comparison template, or learn more about data-led technical sourcing and validation methods.
Search News
Hot Articles
- Carbon Fiber StructuresHow to Specify Aerospace Carbon Fiber Assemblies for Lightweight, Load-Bearing PartsJul 11, 2026
- Machine VisionXiaomi, Alibaba DAMO Academy Drive Open-Source Robotics Model Ecosystem, Lowering Algorithm Development Barriers for Overseas SMEs Adopting Chinese Robotics SolutionsMar 30, 2026
- Cobots & ArmsShanxi 'AI+' Conference Showcases Embodied Intelligence with Multinational Buyer Engagement: Key Industry ImplicationsMar 30, 2026
Popular Tags
Recommended News
 Jul 11, 2026How to Specify Aerospace Carbon Fiber Assemblies for Lightweight, Load-Bearing PartsAerospace carbon fiber assemblies: learn how to specify laminate design, load data, joining methods, and inspection controls for lighter, reliable load-bearing aerospace parts.Elena Rostova (UAV Systems Researcher)
 Mar 30, 2026Xiaomi, Alibaba DAMO Academy Drive Open-Source Robotics Model Ecosystem, Lowering Algorithm Development Barriers for Overseas SMEs Adopting Chinese Robotics SolutionsXiaomi & Alibaba DAMO Academy's open-source robotics models lower algorithm barriers for global SMEs. Boost efficiency in manufacturing, logistics & smart retail with ROS 2 compatible solutions.TSV Data Lab
 Mar 30, 2026Shanxi 'AI+' Conference Showcases Embodied Intelligence with Multinational Buyer Engagement: Key Industry ImplicationsShanxi 'AI+' Conference highlights embodied intelligence with Tesla, Ubtech & Jiantao showcasing multimodal robotics. 40+ global buyers validated tech on-site, creating new B2B channels for industrial automation & AI solutions.Chen Wei (Automation Lead Engineer)
 Mar 30, 2026Zhongguancun Unveils 6G Integrated Sensing-Computing-Intelligence Platform to Empower Embodied Robots for Global Industrial ApplicationsZhongguancun's new 6G platform revolutionizes industrial robotics with <10ms latency, empowering global automotive, logistics & port automation. Discover how this tech boosts China's smart manufacturing exports.TSV Data Lab
 Mar 30, 2026Mech-Mind Tianjin Embodied Intelligence R&D and Production Base Goes Live, Cutting Delivery Time by 20%–30% for Global Customized AMR+Vision SolutionsMech-Mind's Tianjin AMR+Vision production base cuts delivery time by 20%-30% for欧美 & Latin American markets. Discover how this PLd-certified facility accelerates customized robotics solutions for smart manufacturing and logistics.Chen Wei (Automation Lead Engineer)
 Mar 30, 2026Boao Forum Reveals 'Co-evolution of Big and Small Brains' Trend in Humanoid Robots, China's Embodied Intelligence Accelerates Adaptation to Overseas Manufacturing Service ScenariosDiscover how China's humanoid robots, featuring 'Co-evolution of Big and Small Brains,' are revolutionizing global manufacturing. Learn about Embodied Tian Gong 3.0's ISO compliance and overseas deployment at Boao Forum 2026.Chen Wei (Automation Lead Engineer)
 Mar 30, 2026China Railway Industrial Secures Patent for Embodied Robotics in Material Handling, Boosting High-Precision Delivery Capabilities for Overseas Infrastructure and Manufacturing ProjectsChina Railway Industrial's new patent for embodied robotics in material handling boosts high-precision delivery for global infrastructure & manufacturing. Discover how this innovation enhances logistics accuracy in automotive, rail transit & EPC projects.Chen Wei (Automation Lead Engineer)
 Oct 25, 2026Hesai Leads Global ADAS Main Lidar Shipments in Yole’s 2026 ReportHesai led global ADAS main lidar shipments with a 43% share in 2025, according to Yole’s 2026 report. Explore what this ranking reveals about its automotive market position.TSV Data Lab
 Oct 25, 2026Choosing an Aerospace Materials Manufacturer: Quality and Traceability ChecksChoosing an aerospace materials manufacturer? Learn how to verify certifications, test reports, and lot traceability to qualify suppliers confidently and reduce costly sourcing risks.Dr. Marcus Vance
 Oct 24, 2026Guotai Haitong: Global Entry-Level 3D Printer Shipments Rose 39% in Q1 2026Entry-level 3D printer shipments rose 39% in Q1 2026, Guotai Haitong reports. Explore how AI, multicolor printing and print farms are shaping market growth.Dr. Marcus Vance
 Oct 24, 2026Choosing an Industrial Vision Inspection Supplier: Acceptance Tests That MatterChoose an industrial vision inspection supplier with confidence. Discover acceptance tests for defect detection, false rejects, production speed, and reliable part rejection before you buy.TSV Data Lab
 Oct 23, 2026US Navy Raises Gecko Robotics Contract Ceiling to $300M for Robotic Fleet MaintenanceUS Navy raises Gecko Robotics’ contract ceiling to $300M for Pacific Fleet robotic inspections. Explore potential opportunities for maintenance suppliers and key procurement considerations.Chen Wei (Automation Lead Engineer)
 Oct 23, 2026Choosing Industrial Sensing Systems for Global Plants: Protocol CompatibilityCompare industrial sensing systems international buyers can trust. Explore protocol compatibility, reduce integration risks, and select proven configurations for reliable global plant deployments.TSV Data Lab
 Oct 22, 2026KUKA Showcases Physical AI and iiQKA.AI Vision at NVIDIA GTC BerlinExplore KUKA’s Physical AI showcase at NVIDIA GTC Berlin and discover how iiQKA.AI Vision aims to simplify robotic vision integration and improve 2D and 3D scene recognition.TSV Data Lab
 Oct 22, 2026Robotic Machining of Advanced Composites: What Tolerances Are Achievable?Explore advanced materials machining robotics: discover what drives achievable composite tolerances and how to validate accuracy before investing in your next machining system.Dr. Marcus Vance
 Oct 21, 2026China’s Industrial Robot Exports Near RMB 10 Billion in First Nine Months of 2026China’s industrial robot exports neared RMB 10 billion in January–September 2026, with value rising faster than volume. Explore the data and what it could mean for suppliers.Chen Wei (Automation Lead Engineer)
 Oct 21, 2026Low-Latency Industrial Data Processing: Pricing and Key Cost DriversExplore industrial data latency price drivers, from edge hardware to integration and support. Learn how to compare quotes, verify performance, and avoid unnecessary costs.TSV Data Lab
 Oct 20, 2026KUKA Launches iiQKA.AI Vision to Simplify Industrial Image ProcessingKUKA iiQKA.AI Vision simplifies industrial image processing with controller-based 2D and 3D vision. Explore drag-and-drop setup for vision-guided automation.TSV Data Lab
 Oct 20, 2026Smart Industrial Edge Devices: Key Criteria for Legacy PLC IntegrationChoose smart industrial edge devices for legacy PLC integration. Discover key criteria for compatibility, data quality, security, and reliable collection without disrupting control.TSV Data Lab
 Oct 19, 2026Choosing a Radar Sensor by Application: Range, Resolution, and Field of ViewSimplify radar sensor application based product selection. Compare range, resolution, and field of view to avoid blind spots and choose with confidence. Explore the guide.TSV Data Lab
 Oct 18, 2026Comparing Material Options for Procurement: Specs, Costs, and Supply RisksExplore procurement oriented technical content on material options, specs, costs, and supply risks. Compare alternatives to cut hidden expenses and make confident sourcing decisions.Dr. Marcus Vance
 Oct 17, 20265-Axis CNC Positioning Accuracy: How to Interpret ISO 230-2 Test ResultsAssess 5 axis CNC machining positioning accuracy with ISO 230-2. Learn to interpret repeatability, reversal error, and test conditions to compare suppliers and make confident acceptance decisions.Dr. Marcus Vance
 Oct 16, 2026Choosing a Rugged Edge AI Box Supplier: Thermal Tests and Lifecycle SupportChoose a rugged edge AI box supplier with proven thermal performance and reliable lifecycle support. Discover the tests and commitments to verify before you buy.TSV Data Lab
 Oct 15, 2026R&D Cost Reduction Services: How to Evaluate Fees, Savings, and ROIEvaluate R&D cost reduction services with confidence. Compare fees, verify savings, and calculate ROI without compromising performance. Discover how to choose a provider that delivers real value.Chen Wei (Automation Lead Engineer)