Drone Propeller Thrust Efficiency Drops Faster Than Expected in Wind
Publication Date
author
Wind can degrade drone propeller thrust efficiency faster than many field teams expect, reshaping assumptions around uav wind resistance rating, drone payload capacity vs flight time, and drone motor thrust test data. For engineers, operators, buyers, and decision-makers, understanding how thrust loss interacts with carbon fiber frame vibration dampening, flight controller latency benchmark, and uav center of gravity calculation is essential to selecting reliable UAV platforms under real-world conditions.
In practical UAV operations, wind is not just an environmental variable. It changes propeller loading, motor current demand, control loop stability, battery drain, and payload margin all at once. A multirotor that appears stable in calm-air brochures can show a measurable drop in usable thrust when crosswinds rise from 4 m/s to 8 m/s, especially during hover, mapping turns, and low-altitude station-keeping.
For B2B buyers and technical teams, the key issue is not whether a drone can fly in wind, but how quickly efficiency falls and how predictably the aircraft recovers. That distinction affects platform selection for surveying, agriculture, infrastructure inspection, logistics trials, and public safety deployment. It also determines whether supplier claims hold up under repeatable engineering benchmarks rather than optimistic lab conditions.
Why Propeller Thrust Efficiency Drops Faster in Wind Than Many Teams Assume
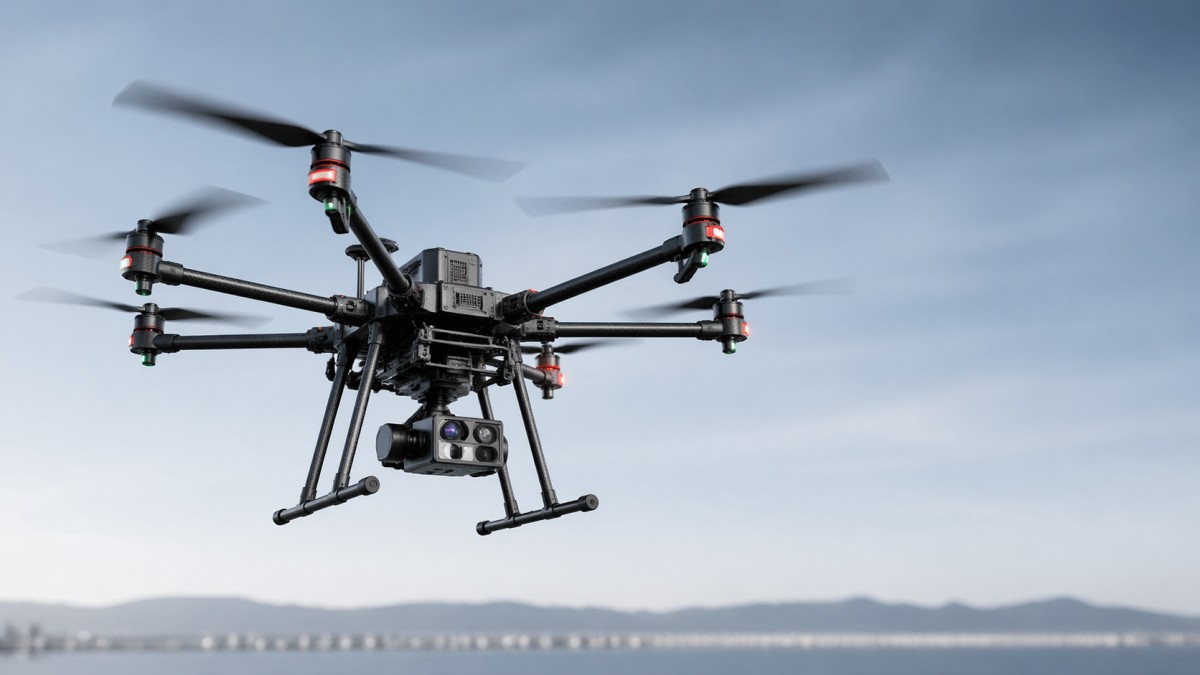
A drone propeller generates thrust by accelerating air downward, but wind disturbs that flow field. In still air, thrust curves are relatively predictable across RPM bands. In turbulent or gusting air, however, the propeller disc sees uneven inflow angles, localized blade stall risk, and shifting induced velocity. That means the same motor command can produce less net lift than a static bench test suggests.
The loss is often nonlinear. A field team may expect a 10% increase in power demand when wind speed doubles, yet the real effect can be closer to a 15% to 30% reduction in thrust efficiency depending on rotor diameter, blade pitch, all-up weight, and flight control tuning. Once gust frequency rises above the controller’s practical compensation window, the aircraft spends more time correcting attitude than maintaining efficient lift.
This is especially relevant for commercial UAVs carrying cameras, LiDAR pods, spraying systems, or communication payloads. Payloads change frontal area and center of gravity, which amplifies control effort. If the UAV center of gravity calculation is already near the edge of the recommended range, even a modest side wind can force one motor pair to run 8% to 15% hotter than the others during hover compensation.
Carbon fiber frame vibration dampening also matters more than many procurement teams realize. A stiffer frame can improve response, but if resonance bands overlap with motor-prop RPM zones, vibration can corrupt IMU data and force the flight controller to over-correct. In practical terms, an aircraft may remain airborne while losing mapping accuracy, waypoint smoothness, and endurance long before it reaches its formal uav wind resistance rating.
Static thrust data versus real wind-loaded performance
Static drone motor thrust test data is useful, but only as a baseline. It shows what a motor-prop pair can deliver at a given voltage, current, and RPM in controlled conditions. It does not fully capture gust response, recirculating airflow around the frame, or the control overhead required to maintain position in variable wind fields.
The table below highlights the gap between common static assumptions and real operational effects seen across typical commercial multirotor use cases.
The central takeaway is that wind effects stack. The propeller does not lose efficiency in isolation; it loses efficiency while the flight controller is issuing more corrections, while the battery is under higher load, and while payload drag is increasing. That is why engineering-focused evaluation is more valuable than a single headline wind-resistance claim.
Key Engineering Variables That Change Wind Performance
When assessing a UAV platform, decision-makers should look beyond motor KV and advertised flight time. Wind resilience emerges from a system-level interaction among propeller geometry, motor torque reserve, frame stiffness, mass distribution, and controller response. A platform with larger props and lower disc loading may hold hover more efficiently at 6 m/s, while a lighter but underpowered airframe may consume its thrust reserve too early.
Flight controller latency benchmark is one of the most under-discussed variables. A control loop running at 200 Hz to 400 Hz can react quickly, but effective field performance also depends on filtering, sensor quality, and actuator lag. If total sensing-to-response delay stretches from 8 ms to 20 ms under vibration or CPU load, attitude stabilization in gusts degrades noticeably, particularly in precision inspection or photogrammetry tasks.
The UAV center of gravity calculation should also be treated as a procurement criterion, not a setup afterthought. A center of gravity offset of only 10 mm to 20 mm can be manageable in calm air, but in wind it increases persistent compensation. That raises current imbalance across motors, increases thermal stress, and shortens the effective endurance window. Over 20 to 30 mission cycles, this can influence maintenance intervals and motor replacement rates.
Frame material and geometry matter for both structural integrity and sensor reliability. Carbon fiber frame vibration dampening is beneficial when tuned correctly, yet vibration isolation should be measured at the system level. A very rigid frame with poor mounting isolation may preserve geometry while degrading sensor fusion. For UAV buyers, the more useful question is not “Is the frame carbon fiber?” but “How does the airframe behave across the 40% to 80% throttle band in wind?”
Four variables that deserve closer benchmarking
- Propeller loading and diameter: Larger discs can improve lift efficiency, but tip deformation and blade tracking quality become more important above medium payload levels.
- Motor thermal headroom: A system operating at 65% average throttle in calm air may exceed 80% in continuous wind correction, reducing reserve for emergency climb.
- Controller and IMU robustness: Low latency is only meaningful when vibration filtering, compass behavior, and sensor alignment remain stable during gust events.
- Payload integration quality: Aerodynamic drag, mounting rigidity, and center-of-gravity placement can change thrust efficiency more than a nominal battery upgrade.
A practical selection lens for technical teams
For engineering teams writing spec sheets, a useful rule is to reserve at least 25% to 35% thrust margin above steady hover requirement for operations expected in 5 m/s to 8 m/s wind. For heavier industrial payloads or offshore use, the margin may need to be closer to 40%. That does not guarantee performance, but it reduces the risk of selecting an airframe that passes static tests yet struggles in live missions.
For procurement teams, the minimum acceptable dataset should include hover current at multiple payload points, propeller efficiency data by RPM band, controller response notes, and mission endurance under at least 2 wind conditions. Without those items, “wind resistant” remains a marketing phrase rather than an actionable operating parameter.
How Wind Alters Payload Capacity, Flight Time, and Mission Reliability
The most common planning error in commercial UAV operations is treating drone payload capacity vs flight time as a fixed tradeoff. In reality, wind shifts the entire curve. A platform rated for 35 minutes with a 1 kg payload in calm conditions may deliver only 24 to 28 minutes when average wind holds at 7 m/s, especially if the route includes repeated turns, hovering over inspection points, or altitude changes.
Mission reliability declines before total endurance collapses. Survey and mapping flights may still finish, but with reduced overlap consistency and more aggressive attitude corrections. Inspection teams may reach the target asset but struggle to maintain stable framing. Agricultural spraying systems may remain airborne while showing poorer droplet placement due to motion instability and changing downwash patterns.
This is why procurement decisions should be tied to mission class rather than headline specifications. A drone suitable for periodic visual inspection at 3 m/s wind may not be suitable for corridor mapping at 7 m/s with the same payload. Operators need wind-adjusted payload envelopes, not only maximum payload and theoretical flight time figures.
The table below shows a practical planning framework that many teams can adapt when comparing UAV platforms for field use.
The main conclusion is straightforward: mission planning must include wind-adjusted performance assumptions. A UAV that is technically flyable may still be commercially inefficient if wind pushes battery swaps, narrows payload margin, increases maintenance load, or forces repeated aborted missions. For enterprises managing fleets, those costs scale quickly across dozens or hundreds of sorties.
Common field mistakes that distort payload and endurance expectations
- Using calm-air endurance as a procurement baseline instead of a best-case ceiling.
- Ignoring payload drag and only considering payload mass.
- Skipping center-of-gravity checks after sensor or battery changes.
- Assuming controller tuning can fully compensate for low thrust reserve.
- Overlooking heat buildup during repeated gust correction cycles.
A Procurement Framework for Engineers, Buyers, and Decision-Makers
For B2B UAV sourcing, the best procurement framework begins with operating conditions, not product catalogs. Teams should define 4 to 6 mandatory parameters before comparing vendors: sustained wind band, gust band, payload mass, payload drag profile, hover duration, and required reserve flight time. This converts platform selection from brand-led comparison to mission-led evaluation.
The next step is to request data that can be audited. Good supplier documentation should include drone motor thrust test data across more than one voltage state, payload-dependent current draw, recommended center-of-gravity limits, and notes on vibration control or frame resonance behavior. A single maximum thrust number is not enough for procurement decisions involving industrial or public-sector deployment.
Technical validation should include at least 3 operating modes: steady hover, crosswind hover, and waypoint transition under payload. If field testing is possible, teams should run no fewer than 2 battery states, such as 95% and 35%, because voltage sag can change control authority near mission end. This matters when return-to-home performance is safety critical.
Organizations that manage multi-site operations should also connect procurement to maintenance economics. An aircraft that is 8% more expensive upfront may still be the better asset if it reduces aborted sorties, lowers motor temperature excursions, and extends propeller replacement intervals from 50 cycles to 80 cycles in windy regions.
Decision checklist for supplier evaluation
The following matrix can help engineering, operations, and procurement teams align on what matters before issuing an RFQ or preparing a comparative benchmark review.
For organizations that value engineering truth over promotional language, this approach is consistent with a data-driven sourcing philosophy. The right vendor is not simply the one with the highest advertised wind rating, but the one that can explain how the platform behaves when wind, payload, vibration, and control latency interact under repeatable test conditions.
Suggested procurement workflow
- Define the target mission envelope, including 2 wind bands and 1 emergency reserve threshold.
- Request comparable technical data from shortlisted suppliers in the same format.
- Screen for center-of-gravity limits, vibration behavior, and controller response before commercial review.
- Run pilot validation with instrumented flights if the deployment value justifies it.
- Translate findings into lifecycle cost, maintenance planning, and fleet availability metrics.
Implementation Guidance, Risk Control, and Practical FAQ
Once a UAV platform is selected, real value comes from disciplined implementation. Teams should establish a wind-aware operating protocol that includes payload-specific preflight checks, center-of-gravity verification, propeller condition inspection, and battery reserve thresholds. In many commercial programs, a simple 5-step checklist can prevent most wind-related performance surprises before the aircraft leaves the ground.
Operationally, it is wise to separate “can launch” from “can complete mission.” A drone may be airworthy at 8 m/s, yet the mission may still fail economically if the task requires stable hover, repeatable camera angle, or tight overlap accuracy. For this reason, many fleet managers define one launch threshold and a lower threshold for precision work such as detailed inspection or mapping.
Risk control should also address maintenance. Wind-intensive use typically increases propeller wear, motor heating cycles, and fastener inspection demand. Reviewing component condition every 25 to 50 sorties, depending on payload class and environmental severity, is often more realistic than relying on broad maintenance intervals copied from calm-air operating assumptions.
For organizations comparing suppliers or building internal standards, the strongest long-term approach is a benchmark mindset: define measurable thresholds, validate them under realistic load, and update them as mission profiles evolve. That is precisely where data-driven evaluation creates trust across engineering, operations, procurement, and executive teams.
FAQ: How should teams interpret a UAV wind resistance rating?
Treat it as an operating envelope indicator, not a guarantee of efficient mission performance. A stated rating such as 10 m/s may only indicate controllable flight. It does not automatically mean acceptable mapping precision, stable inspection hover, or full payload endurance at that wind level.
FAQ: Which matters more in wind, bigger propellers or smarter control?
Both matter, and the stronger platform usually balances the two. Larger propellers can improve thrust efficiency, but without adequate controller response and vibration management, the aircraft may still waste energy correcting itself. System integration usually outperforms isolated component advantages.
FAQ: What minimum data should buyers request from suppliers?
At a minimum, request hover current at mission payload, static thrust data, practical endurance at more than one payload, controller response information, and center-of-gravity guidance. If the mission is high value, ask for wind-condition test notes or witness testing under defined conditions.
Final takeaways for B2B UAV selection
Drone propeller thrust efficiency in wind often drops faster than expected because wind changes more than lift alone. It affects control workload, vibration behavior, payload drag, battery stress, and usable safety margin. Teams that evaluate UAVs through static specifications only are more likely to understate operational risk.
For engineering-led organizations, the better path is to compare platforms using mission-adjusted thrust reserve, flight controller latency benchmark, carbon fiber frame vibration dampening behavior, and disciplined UAV center of gravity calculation. If you need deeper support turning these variables into a supplier shortlist, spec sheet, or benchmark framework, contact TSV to discuss a more rigorous, data-driven evaluation approach and explore tailored UAV performance analysis for your deployment scenario.
Search News
Hot Articles
- Carbon Fiber StructuresHow to Specify Aerospace Carbon Fiber Assemblies for Lightweight, Load-Bearing PartsJul 11, 2026
- Machine VisionXiaomi, Alibaba DAMO Academy Drive Open-Source Robotics Model Ecosystem, Lowering Algorithm Development Barriers for Overseas SMEs Adopting Chinese Robotics SolutionsMar 30, 2026
- Cobots & ArmsShanxi 'AI+' Conference Showcases Embodied Intelligence with Multinational Buyer Engagement: Key Industry ImplicationsMar 30, 2026
Popular Tags
Recommended News
 Jul 11, 2026How to Specify Aerospace Carbon Fiber Assemblies for Lightweight, Load-Bearing PartsAerospace carbon fiber assemblies: learn how to specify laminate design, load data, joining methods, and inspection controls for lighter, reliable load-bearing aerospace parts.Elena Rostova (UAV Systems Researcher)
 Mar 30, 2026Xiaomi, Alibaba DAMO Academy Drive Open-Source Robotics Model Ecosystem, Lowering Algorithm Development Barriers for Overseas SMEs Adopting Chinese Robotics SolutionsXiaomi & Alibaba DAMO Academy's open-source robotics models lower algorithm barriers for global SMEs. Boost efficiency in manufacturing, logistics & smart retail with ROS 2 compatible solutions.TSV Data Lab
 Mar 30, 2026Shanxi 'AI+' Conference Showcases Embodied Intelligence with Multinational Buyer Engagement: Key Industry ImplicationsShanxi 'AI+' Conference highlights embodied intelligence with Tesla, Ubtech & Jiantao showcasing multimodal robotics. 40+ global buyers validated tech on-site, creating new B2B channels for industrial automation & AI solutions.Chen Wei (Automation Lead Engineer)
 Mar 30, 2026Zhongguancun Unveils 6G Integrated Sensing-Computing-Intelligence Platform to Empower Embodied Robots for Global Industrial ApplicationsZhongguancun's new 6G platform revolutionizes industrial robotics with <10ms latency, empowering global automotive, logistics & port automation. Discover how this tech boosts China's smart manufacturing exports.TSV Data Lab
 Mar 30, 2026Mech-Mind Tianjin Embodied Intelligence R&D and Production Base Goes Live, Cutting Delivery Time by 20%–30% for Global Customized AMR+Vision SolutionsMech-Mind's Tianjin AMR+Vision production base cuts delivery time by 20%-30% for欧美 & Latin American markets. Discover how this PLd-certified facility accelerates customized robotics solutions for smart manufacturing and logistics.Chen Wei (Automation Lead Engineer)
 Mar 30, 2026Boao Forum Reveals 'Co-evolution of Big and Small Brains' Trend in Humanoid Robots, China's Embodied Intelligence Accelerates Adaptation to Overseas Manufacturing Service ScenariosDiscover how China's humanoid robots, featuring 'Co-evolution of Big and Small Brains,' are revolutionizing global manufacturing. Learn about Embodied Tian Gong 3.0's ISO compliance and overseas deployment at Boao Forum 2026.Chen Wei (Automation Lead Engineer)
 Mar 30, 2026China Railway Industrial Secures Patent for Embodied Robotics in Material Handling, Boosting High-Precision Delivery Capabilities for Overseas Infrastructure and Manufacturing ProjectsChina Railway Industrial's new patent for embodied robotics in material handling boosts high-precision delivery for global infrastructure & manufacturing. Discover how this innovation enhances logistics accuracy in automotive, rail transit & EPC projects.Chen Wei (Automation Lead Engineer)
 Oct 23, 2026US Navy Raises Gecko Robotics Contract Ceiling to $300M for Robotic Fleet MaintenanceUS Navy raises Gecko Robotics’ contract ceiling to $300M for Pacific Fleet robotic inspections. Explore potential opportunities for maintenance suppliers and key procurement considerations.Chen Wei (Automation Lead Engineer)
 Oct 23, 2026Choosing Industrial Sensing Systems for Global Plants: Protocol CompatibilityCompare industrial sensing systems international buyers can trust. Explore protocol compatibility, reduce integration risks, and select proven configurations for reliable global plant deployments.TSV Data Lab
 Oct 22, 2026KUKA Showcases Physical AI and iiQKA.AI Vision at NVIDIA GTC BerlinExplore KUKA’s Physical AI showcase at NVIDIA GTC Berlin and discover how iiQKA.AI Vision aims to simplify robotic vision integration and improve 2D and 3D scene recognition.TSV Data Lab
 Oct 22, 2026Robotic Machining of Advanced Composites: What Tolerances Are Achievable?Explore advanced materials machining robotics: discover what drives achievable composite tolerances and how to validate accuracy before investing in your next machining system.Dr. Marcus Vance
 Oct 21, 2026China’s Industrial Robot Exports Near RMB 10 Billion in First Nine Months of 2026China’s industrial robot exports neared RMB 10 billion in January–September 2026, with value rising faster than volume. Explore the data and what it could mean for suppliers.Chen Wei (Automation Lead Engineer)
 Oct 21, 2026Low-Latency Industrial Data Processing: Pricing and Key Cost DriversExplore industrial data latency price drivers, from edge hardware to integration and support. Learn how to compare quotes, verify performance, and avoid unnecessary costs.TSV Data Lab
 Oct 20, 2026KUKA Launches iiQKA.AI Vision to Simplify Industrial Image ProcessingKUKA iiQKA.AI Vision simplifies industrial image processing with controller-based 2D and 3D vision. Explore drag-and-drop setup for vision-guided automation.TSV Data Lab
 Oct 20, 2026Smart Industrial Edge Devices: Key Criteria for Legacy PLC IntegrationChoose smart industrial edge devices for legacy PLC integration. Discover key criteria for compatibility, data quality, security, and reliable collection without disrupting control.TSV Data Lab
 Oct 19, 2026Choosing a Radar Sensor by Application: Range, Resolution, and Field of ViewSimplify radar sensor application based product selection. Compare range, resolution, and field of view to avoid blind spots and choose with confidence. Explore the guide.TSV Data Lab
 Oct 18, 2026Comparing Material Options for Procurement: Specs, Costs, and Supply RisksExplore procurement oriented technical content on material options, specs, costs, and supply risks. Compare alternatives to cut hidden expenses and make confident sourcing decisions.Dr. Marcus Vance
 Oct 17, 20265-Axis CNC Positioning Accuracy: How to Interpret ISO 230-2 Test ResultsAssess 5 axis CNC machining positioning accuracy with ISO 230-2. Learn to interpret repeatability, reversal error, and test conditions to compare suppliers and make confident acceptance decisions.Dr. Marcus Vance
 Oct 16, 2026Choosing a Rugged Edge AI Box Supplier: Thermal Tests and Lifecycle SupportChoose a rugged edge AI box supplier with proven thermal performance and reliable lifecycle support. Discover the tests and commitments to verify before you buy.TSV Data Lab
 Oct 15, 2026R&D Cost Reduction Services: How to Evaluate Fees, Savings, and ROIEvaluate R&D cost reduction services with confidence. Compare fees, verify savings, and calculate ROI without compromising performance. Discover how to choose a provider that delivers real value.Chen Wei (Automation Lead Engineer)
 Oct 23, 2026How Do You Evaluate Solid-State LiDAR Point Cloud Density?Evaluate solid-state LiDAR point cloud density using valid returns, angular spacing, and real-world coverage. Discover how to compare sensors and choose the right fit for your application.TSV Data Lab
 Oct 22, 2026How Do You Test AMR Navigation Accuracy in a Warehouse?Test AMR navigation accuracy in warehouses with practical methods for localization, path tracking, and docking. Learn to set tolerances and compare robots before deployment.Chen Wei (Automation Lead Engineer)
 Oct 21, 2026How Should You Balance Cobot Payload Against Reach?Explore cobot payload versus reach to choose the right robot. Learn how tooling, load limits, workspace, and cycle time affect performance—and avoid costly selection mistakes.Chen Wei (Automation Lead Engineer)
 Oct 20, 2026How Do You Measure Industrial IoT Gateway Latency Under Load?Measure industrial IoT gateway latency under load with reliable timestamps, realistic traffic, and tail-latency analysis. Discover how to expose bottlenecks and choose the right gateway.TSV Data Lab