Why AGV and AMR Obstacle Avoidance Still Fails in Busy Aisles
Publication Date
author
In theory, AGV AMR obstacle avoidance systems should navigate crowded aisles with ease, yet real-world failures remain common when sensor blind spots, fleet traffic conflicts, and unpredictable human movement collide. This article examines why solid-state LiDAR for robotics navigation, solid-state LiDAR point cloud density, and AGV AMR fleet management software still fall short under pressure—and what engineers, operators, buyers, and decision-makers should measure before trusting autonomy at scale.
For warehouses, electronics plants, battery lines, aerospace subassembly sites, and mixed-material distribution centers, the problem is rarely a single bad sensor. Failures in busy aisles usually come from stacked tolerances: a 120 mm pallet overhang, a 0.3 second braking delay, a reflective wrapper, a human stepping out from a cross-aisle, and software that optimizes throughput more aggressively than separation distance. In isolation, each issue looks manageable. In combination, they expose the gap between lab demonstrations and live industrial traffic.
That gap matters to four groups. Operators need fewer nuisance stops and safer interaction zones. Engineers need measurable navigation fault tolerance, not vague claims about “advanced AI.” Procurement teams need comparable specifications across vendors. Executives need to know whether the fleet can scale from 8 vehicles to 80 without multiplying congestion risk. In a data-driven evaluation model, obstacle avoidance must be treated as a systems problem involving sensing, motion control, map quality, traffic rules, and site discipline.
Why obstacle avoidance breaks down in busy aisles
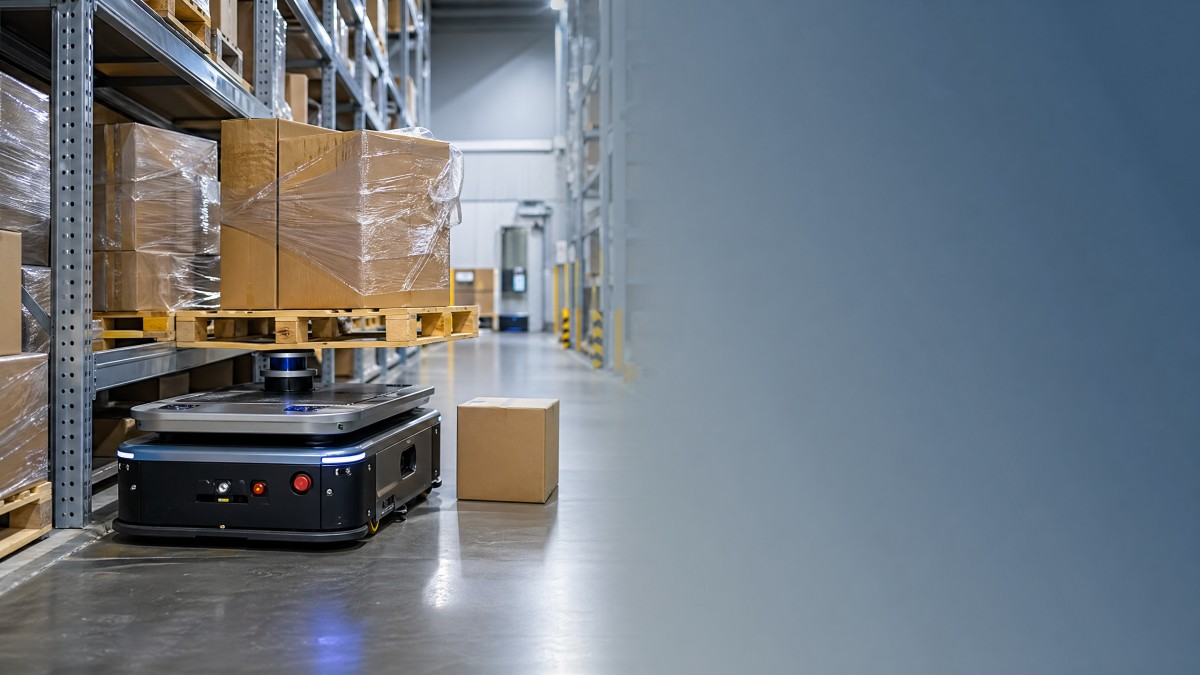
Busy aisles create the worst possible condition for AGV and AMR navigation because the environment is narrow, repetitive, and constantly changing. Aisles in industrial facilities are often only 1.8 m to 3.2 m wide, while vehicles may carry loads that extend beyond the chassis by 50 mm to 200 mm on one or both sides. When people, forklifts, carts, and other mobile robots share the same corridor, the available escape space disappears quickly.
Many teams assume that better obstacle detection alone will solve the problem. In reality, detection is only the first layer. A robot also needs to classify the obstacle, predict its motion for the next 1 to 3 seconds, choose a legal path, communicate with the fleet manager, and execute a stable stop or bypass maneuver. If one layer runs with 80 ms latency and another with 250 ms latency, the cumulative delay can exceed the safe operating window at 1.5 m/s.
The situation gets worse when the aisle geometry contains repeated rack patterns. Repetition can degrade localization confidence, especially if map features are sparse at lower heights. Solid-state LiDAR for robotics navigation may produce sufficient data in open zones, yet still struggle when pallet edges, film wrap, hanging labels, and shiny metal frames create inconsistent returns. This is where point cloud density, vertical field of view, and multi-echo handling begin to matter more than headline range values.
Another frequent source of failure is operational policy. A site may set a nominal robot speed of 1.2 m/s, but allow pedestrians to cross wherever convenient and let manual pallet jacks stop temporarily in travel lanes. The robot may technically behave as designed, yet still fail the mission because the site rule set is not synchronized with autonomous traffic. In practical terms, obstacle avoidance performance depends as much on aisle governance as on hardware specification.
Four recurring failure modes
- Late detection of low-profile or protruding objects such as pallet feet, dropped cartons, and forks extending 80 mm to 150 mm into the path.
- Localization drift in repetitive rack environments, especially after layout changes or temporary stock overflow.
- Traffic deadlocks when 3 to 5 vehicles converge near a cross-aisle and fleet rules fail to resolve priority quickly.
- Human unpredictability, including abrupt turns, diagonal walking paths, and temporary stops inside robot braking zones.
Typical aisle risk profile
The table below shows why “works in demo mode” does not automatically mean “works in mixed industrial traffic.” Each factor changes the safety margin, and the total risk is the product of several small deviations rather than one dramatic failure.
The key takeaway is simple: obstacle avoidance in busy aisles is a dynamic systems challenge. A robot that is acceptable at 0.8 m/s in a 3.0 m aisle may become operationally unreliable at 1.6 m/s in a 2.0 m aisle, even when the same sensors and software are used.
Sensor limits: where solid-state LiDAR and perception stacks fall short
Solid-state LiDAR for robotics navigation is often marketed as a major step forward because it reduces moving parts and can simplify integration. That is true, but it does not eliminate perception tradeoffs. In crowded aisles, the most important metrics are not just maximum range or resolution on a clean target. Engineers should ask about point cloud density at 3 m, 5 m, and 10 m; angular resolution under partial occlusion; update rate at full field of view; and performance on dark, reflective, and irregular surfaces.
Solid-state LiDAR point cloud density is especially important for detecting low or narrow hazards. If the vertical sampling pattern is too sparse, a pallet corner, tow bar, or floor-level obstacle may produce too few returns for stable classification. A sensor can technically “see” the object once, but if detection confidence drops from frame to frame, the planner may oscillate between brake, crawl, and continue commands. That instability creates jerky motion and raises both safety and throughput concerns.
Sensor placement also matters. A front-mounted LiDAR at one height can leave blind zones close to the chassis or miss protrusions carried above the scan plane. Adding a second layer of sensing, such as 3D cameras, safety scanners, or side-facing units, improves coverage but increases fusion complexity. Every added sensor adds calibration steps, synchronization requirements, and failure modes. In practice, perception quality depends on the entire stack, not one flagship device.
Facilities with dust, vibration, packaging film, or frequent lighting changes often expose these weaknesses faster than clean pilot areas do. That is why procurement teams should request test data from conditions that resemble their own floor. A valid comparison should include at least 3 obstacle categories, 2 load conditions, and multiple approach speeds rather than a single pass/fail demonstration.
What to ask about sensor performance
The following table provides a practical checklist for reviewing perception capability beyond brochure claims. These are not universal acceptance limits, but they help structure a more technical vendor discussion.
The most useful buying principle is to test sensors in the exact failure zone: narrow, cluttered, reflective, and busy. If the review only covers open-floor navigation, the data will underrepresent the true risk of aisle interactions.
A practical three-layer sensing model
- Primary detection layer for forward obstacle discovery at 5 m to 15 m.
- Near-field protection layer for low-profile and close-body hazards within 0 m to 1.5 m.
- Context layer for people, crossings, and side encroachment around turns and rack ends.
If one of these three layers is weak, overall obstacle avoidance will be fragile. Strong autonomy comes from overlap, not from a single sensor specification.
Fleet management software: the hidden source of collisions, deadlocks, and stop waves
Even when local perception is adequate, AGV AMR fleet management software can still cause operational failure. In dense facilities, robots rarely fail because they do not see an obstacle at all. More often, they fail because multiple vehicles make individually safe decisions that create a collectively bad outcome. Common examples include two-way aisle blockages, repeated yielding loops near intersections, and stop waves caused by poor dispatch timing.
A fleet with 6 vehicles may run smoothly under simple priority rules. At 20 or 40 vehicles, those same rules can become unstable. If the software does not reserve corridor segments, predict queue growth, or dynamically throttle task release, congestion rises sharply during shift changes and replenishment peaks. The result is not necessarily a crash, but a dangerous pattern of abrupt stops, close-proximity negotiations, and manual intervention. From an operational standpoint, that is still obstacle avoidance failure.
Cross-aisles are especially sensitive. A robot approaching at 1.4 m/s may have enough local sensing to stop safely, yet if the fleet layer grants passage to another robot 200 ms too late, both units may enter a hesitation cycle. This matters because human workers read hesitation poorly. A robot that slows, creeps forward, then brakes again creates uncertainty for nearby pedestrians and lift-truck drivers.
For procurement and operations leaders, the lesson is clear: evaluate fleet software as seriously as sensor hardware. Throughput, safety margin, dispatch policy, rerouting logic, and recovery behavior must be measured under load, not discussed as abstract features.
Software functions that affect aisle safety
- Intersection reservation logic that prevents two robots from claiming the same conflict zone within the same time window.
- Queue-aware dispatching that delays noncritical tasks when aisle occupancy exceeds a defined threshold, such as 70% to 80%.
- Human-priority behavior in mixed zones, including slower approach speeds and larger dynamic buffers.
- Automatic recovery workflows after a blocked path persists for 15 seconds, 30 seconds, or another site-defined interval.
What to compare in fleet software evaluations
A technical review of AGV AMR fleet management software should include both control logic and operational evidence. The table below highlights what buyers and engineers should request during vendor qualification.
If the software review does not include congestion, blocked routes, and mixed-priority tasks, it is incomplete. Busy-aisle reliability is not validated by nominal routing alone.
What engineers, operators, and buyers should measure before rollout
The most effective way to reduce failure is to convert broad claims into measurable site acceptance criteria. Before rollout, teams should define a validation plan that reflects their real aisles, loads, shifts, and staffing patterns. A good protocol usually runs for 2 to 4 weeks and covers peak and off-peak windows, not just one daytime demo. The goal is to expose weak points before scaling.
For engineering teams, core metrics include stop distance consistency, false positive stop rate, successful bypass rate, deadlock recovery time, and localization stability in repetitive rack zones. For operators, equally important metrics include manual intervention frequency, restart simplicity, and whether the robot behaves predictably around pedestrians. A technically capable machine that confuses workers can still damage adoption and productivity.
Procurement teams should also insist on documented test boundaries. If a vendor states that avoidance works up to 1.5 m/s, ask whether that was measured with empty vehicles or with full payloads, in open space or in 2.2 m aisles, and with what obstacle mix. A complete review should separate safety stop capability from mission continuity. Stopping is necessary, but operationally useful autonomy also requires smooth restart and stable rerouting.
For decision-makers, the question is scale. A system that meets target availability with 5 robots may miss the mark with 25 if congestion modeling was weak. That is why a pilot should include at least one stress scenario where traffic density, task release rate, and human movement are intentionally elevated to reveal control limits.
Recommended pre-deployment checklist
- Map 3 to 5 representative aisles, including the narrowest and most cluttered zones.
- Test empty and loaded travel, with at least 2 payload profiles and one overhang condition.
- Run obstacle scenarios involving people, static objects, and moving vehicles over multiple shifts.
- Record recovery behavior after blocked routes lasting 15 seconds, 30 seconds, and 60 seconds.
- Review fleet performance at current scale and projected scale, such as 8, 16, and 32 vehicles.
Useful acceptance metrics
A practical specification should contain numeric boundaries. Examples include maximum false stop rate per hour, minimum successful route completion rate, maximum manual interventions per shift, and target recovery time after congestion. The exact threshold depends on the site, but leaving these items undefined almost guarantees disputes after installation.
It is also wise to define environmental limits such as floor reflectivity, allowed pallet overhang, temporary storage rules, and pedestrian crossing policy. These are not minor details. They are operating assumptions that determine whether obstacle avoidance remains reliable after go-live.
Implementation strategy: how to improve reliability without overspending
Improving AGV and AMR obstacle avoidance in busy aisles does not always require replacing the entire fleet. In many facilities, the largest gains come from better zoning, more disciplined traffic rules, and targeted sensor or software upgrades. A phased program often delivers better results than a full reset because it isolates root causes and protects uptime during transition.
Start with aisle segmentation. Separate high-mix pedestrian zones from robot-priority corridors whenever possible. Even a modest change, such as defining 2 or 3 controlled crossing points instead of unrestricted crossing, can reduce emergency stops significantly. Next, review speed profiles by zone. A blanket speed cap is less effective than dynamic limits that match visibility, congestion, and stopping distance requirements.
Then address perception and software together. If data shows near-field misses, refine sensor placement or add complementary coverage. If logs show repeated queue collapse near intersections, retune dispatch intervals, reservation logic, or task batching. Too many projects focus on one layer and ignore the coupling between layers. In reality, a 10% improvement in sensing plus a 15% improvement in traffic logic can outperform a costly hardware-only upgrade.
Finally, maintain the system like industrial infrastructure, not consumer electronics. Recalibration, cleaning, map review, and traffic policy updates should follow a planned schedule. In facilities with frequent layout changes, a monthly review may be necessary. In stable plants, a quarterly technical audit may be sufficient, provided incident logs are monitored continuously.
A phased improvement path
- Phase 1, 2–4 weeks: collect logs, identify top 3 congestion and detection failure zones, and define numeric acceptance criteria.
- Phase 2, 4–8 weeks: adjust speed zones, crossing rules, dispatch logic, and sensor calibration in the worst aisles.
- Phase 3, 4–6 weeks: validate under elevated traffic density and expanded fleet scale before broader deployment.
FAQ for buyers and technical teams
How do I compare two vendors if both claim strong obstacle avoidance?
Use the same aisle, the same payload, and the same traffic script. Compare point cloud stability, end-to-end latency, false stop frequency, deadlock recovery time, and task completion under congestion. Feature lists are less useful than side-by-side test evidence.
Is solid-state LiDAR enough by itself?
Often no. In busy aisles, a single sensing layer may leave blind spots near the floor, near carried loads, or at side encroachment points. Many robust systems use layered perception and software controls rather than one sensor alone.
When should I worry about fleet software more than sensors?
If incidents cluster at intersections, cross-aisles, charging queues, or during shift peaks, fleet logic is often the main issue. If incidents cluster around low objects, reflective packaging, or payload overhang, perception may be the stronger suspect. In many cases, both contribute.
What is a realistic pilot duration?
For mixed industrial traffic, 2 to 4 weeks is a practical minimum. That window usually captures enough variation in shifts, loads, and temporary obstacles to reveal whether the system is robust or merely acceptable in ideal conditions.
Obstacle avoidance failures in busy aisles persist because autonomy is constrained by physics, software timing, facility discipline, and traffic complexity all at once. The strongest deployments are built on measurable engineering criteria: solid-state LiDAR point cloud density in real aisle conditions, end-to-end perception and control latency, conflict-aware fleet management, and explicit site rules for crossings, overhangs, and blocked paths.
For TechStat Vanguard readers evaluating robotics and automation infrastructure, the priority is not marketing language but verified operating boundaries. If you are planning a pilot, expanding a fleet, or rewriting a technical specification for AGV or AMR procurement, a data-driven review can reduce trial-and-error costs and shorten supplier qualification cycles. Contact us to discuss a benchmark framework, request a custom evaluation checklist, or explore more hard-tech decision support for autonomous material handling.
Search News
Hot Articles
- Carbon Fiber StructuresHow to Specify Aerospace Carbon Fiber Assemblies for Lightweight, Load-Bearing PartsJul 11, 2026
- Machine VisionXiaomi, Alibaba DAMO Academy Drive Open-Source Robotics Model Ecosystem, Lowering Algorithm Development Barriers for Overseas SMEs Adopting Chinese Robotics SolutionsMar 30, 2026
- Cobots & ArmsShanxi 'AI+' Conference Showcases Embodied Intelligence with Multinational Buyer Engagement: Key Industry ImplicationsMar 30, 2026
Popular Tags
Recommended News
 Jul 11, 2026How to Specify Aerospace Carbon Fiber Assemblies for Lightweight, Load-Bearing PartsAerospace carbon fiber assemblies: learn how to specify laminate design, load data, joining methods, and inspection controls for lighter, reliable load-bearing aerospace parts.Elena Rostova (UAV Systems Researcher)
 Mar 30, 2026Xiaomi, Alibaba DAMO Academy Drive Open-Source Robotics Model Ecosystem, Lowering Algorithm Development Barriers for Overseas SMEs Adopting Chinese Robotics SolutionsXiaomi & Alibaba DAMO Academy's open-source robotics models lower algorithm barriers for global SMEs. Boost efficiency in manufacturing, logistics & smart retail with ROS 2 compatible solutions.TSV Data Lab
 Mar 30, 2026Shanxi 'AI+' Conference Showcases Embodied Intelligence with Multinational Buyer Engagement: Key Industry ImplicationsShanxi 'AI+' Conference highlights embodied intelligence with Tesla, Ubtech & Jiantao showcasing multimodal robotics. 40+ global buyers validated tech on-site, creating new B2B channels for industrial automation & AI solutions.Chen Wei (Automation Lead Engineer)
 Mar 30, 2026Zhongguancun Unveils 6G Integrated Sensing-Computing-Intelligence Platform to Empower Embodied Robots for Global Industrial ApplicationsZhongguancun's new 6G platform revolutionizes industrial robotics with <10ms latency, empowering global automotive, logistics & port automation. Discover how this tech boosts China's smart manufacturing exports.TSV Data Lab
 Mar 30, 2026Mech-Mind Tianjin Embodied Intelligence R&D and Production Base Goes Live, Cutting Delivery Time by 20%–30% for Global Customized AMR+Vision SolutionsMech-Mind's Tianjin AMR+Vision production base cuts delivery time by 20%-30% for欧美 & Latin American markets. Discover how this PLd-certified facility accelerates customized robotics solutions for smart manufacturing and logistics.Chen Wei (Automation Lead Engineer)
 Mar 30, 2026Boao Forum Reveals 'Co-evolution of Big and Small Brains' Trend in Humanoid Robots, China's Embodied Intelligence Accelerates Adaptation to Overseas Manufacturing Service ScenariosDiscover how China's humanoid robots, featuring 'Co-evolution of Big and Small Brains,' are revolutionizing global manufacturing. Learn about Embodied Tian Gong 3.0's ISO compliance and overseas deployment at Boao Forum 2026.Chen Wei (Automation Lead Engineer)
 Mar 30, 2026China Railway Industrial Secures Patent for Embodied Robotics in Material Handling, Boosting High-Precision Delivery Capabilities for Overseas Infrastructure and Manufacturing ProjectsChina Railway Industrial's new patent for embodied robotics in material handling boosts high-precision delivery for global infrastructure & manufacturing. Discover how this innovation enhances logistics accuracy in automotive, rail transit & EPC projects.Chen Wei (Automation Lead Engineer)
 Oct 25, 2026Hesai Leads Global ADAS Main Lidar Shipments in Yole’s 2026 ReportHesai led global ADAS main lidar shipments with a 43% share in 2025, according to Yole’s 2026 report. Explore what this ranking reveals about its automotive market position.TSV Data Lab
 Oct 25, 2026Choosing an Aerospace Materials Manufacturer: Quality and Traceability ChecksChoosing an aerospace materials manufacturer? Learn how to verify certifications, test reports, and lot traceability to qualify suppliers confidently and reduce costly sourcing risks.Dr. Marcus Vance
 Oct 24, 2026Guotai Haitong: Global Entry-Level 3D Printer Shipments Rose 39% in Q1 2026Entry-level 3D printer shipments rose 39% in Q1 2026, Guotai Haitong reports. Explore how AI, multicolor printing and print farms are shaping market growth.Dr. Marcus Vance
 Oct 24, 2026Choosing an Industrial Vision Inspection Supplier: Acceptance Tests That MatterChoose an industrial vision inspection supplier with confidence. Discover acceptance tests for defect detection, false rejects, production speed, and reliable part rejection before you buy.TSV Data Lab
 Oct 23, 2026US Navy Raises Gecko Robotics Contract Ceiling to $300M for Robotic Fleet MaintenanceUS Navy raises Gecko Robotics’ contract ceiling to $300M for Pacific Fleet robotic inspections. Explore potential opportunities for maintenance suppliers and key procurement considerations.Chen Wei (Automation Lead Engineer)
 Oct 23, 2026Choosing Industrial Sensing Systems for Global Plants: Protocol CompatibilityCompare industrial sensing systems international buyers can trust. Explore protocol compatibility, reduce integration risks, and select proven configurations for reliable global plant deployments.TSV Data Lab
 Oct 22, 2026KUKA Showcases Physical AI and iiQKA.AI Vision at NVIDIA GTC BerlinExplore KUKA’s Physical AI showcase at NVIDIA GTC Berlin and discover how iiQKA.AI Vision aims to simplify robotic vision integration and improve 2D and 3D scene recognition.TSV Data Lab
 Oct 22, 2026Robotic Machining of Advanced Composites: What Tolerances Are Achievable?Explore advanced materials machining robotics: discover what drives achievable composite tolerances and how to validate accuracy before investing in your next machining system.Dr. Marcus Vance
 Oct 21, 2026China’s Industrial Robot Exports Near RMB 10 Billion in First Nine Months of 2026China’s industrial robot exports neared RMB 10 billion in January–September 2026, with value rising faster than volume. Explore the data and what it could mean for suppliers.Chen Wei (Automation Lead Engineer)
 Oct 21, 2026Low-Latency Industrial Data Processing: Pricing and Key Cost DriversExplore industrial data latency price drivers, from edge hardware to integration and support. Learn how to compare quotes, verify performance, and avoid unnecessary costs.TSV Data Lab
 Oct 20, 2026KUKA Launches iiQKA.AI Vision to Simplify Industrial Image ProcessingKUKA iiQKA.AI Vision simplifies industrial image processing with controller-based 2D and 3D vision. Explore drag-and-drop setup for vision-guided automation.TSV Data Lab
 Oct 20, 2026Smart Industrial Edge Devices: Key Criteria for Legacy PLC IntegrationChoose smart industrial edge devices for legacy PLC integration. Discover key criteria for compatibility, data quality, security, and reliable collection without disrupting control.TSV Data Lab
 Oct 19, 2026Choosing a Radar Sensor by Application: Range, Resolution, and Field of ViewSimplify radar sensor application based product selection. Compare range, resolution, and field of view to avoid blind spots and choose with confidence. Explore the guide.TSV Data Lab
 Oct 18, 2026Comparing Material Options for Procurement: Specs, Costs, and Supply RisksExplore procurement oriented technical content on material options, specs, costs, and supply risks. Compare alternatives to cut hidden expenses and make confident sourcing decisions.Dr. Marcus Vance
 Oct 17, 20265-Axis CNC Positioning Accuracy: How to Interpret ISO 230-2 Test ResultsAssess 5 axis CNC machining positioning accuracy with ISO 230-2. Learn to interpret repeatability, reversal error, and test conditions to compare suppliers and make confident acceptance decisions.Dr. Marcus Vance
 Oct 16, 2026Choosing a Rugged Edge AI Box Supplier: Thermal Tests and Lifecycle SupportChoose a rugged edge AI box supplier with proven thermal performance and reliable lifecycle support. Discover the tests and commitments to verify before you buy.TSV Data Lab
 Oct 15, 2026R&D Cost Reduction Services: How to Evaluate Fees, Savings, and ROIEvaluate R&D cost reduction services with confidence. Compare fees, verify savings, and calculate ROI without compromising performance. Discover how to choose a provider that delivers real value.Chen Wei (Automation Lead Engineer)