AGV battery degradation rate depends on duty cycle more than age
Publication Date
author
For fleets running around the clock, AGV battery degradation rate is shaped more by duty cycle than calendar age. This matters to engineers comparing agv magnetic tape vs slam comparison results, buyers evaluating automated guided vehicle price, and teams benchmarking agv lidar navigation accuracy. Understanding the real stress drivers behind battery fade helps reduce downtime, improve lifecycle costing, and support better procurement and maintenance decisions.
Why duty cycle matters more than battery age in AGV fleets
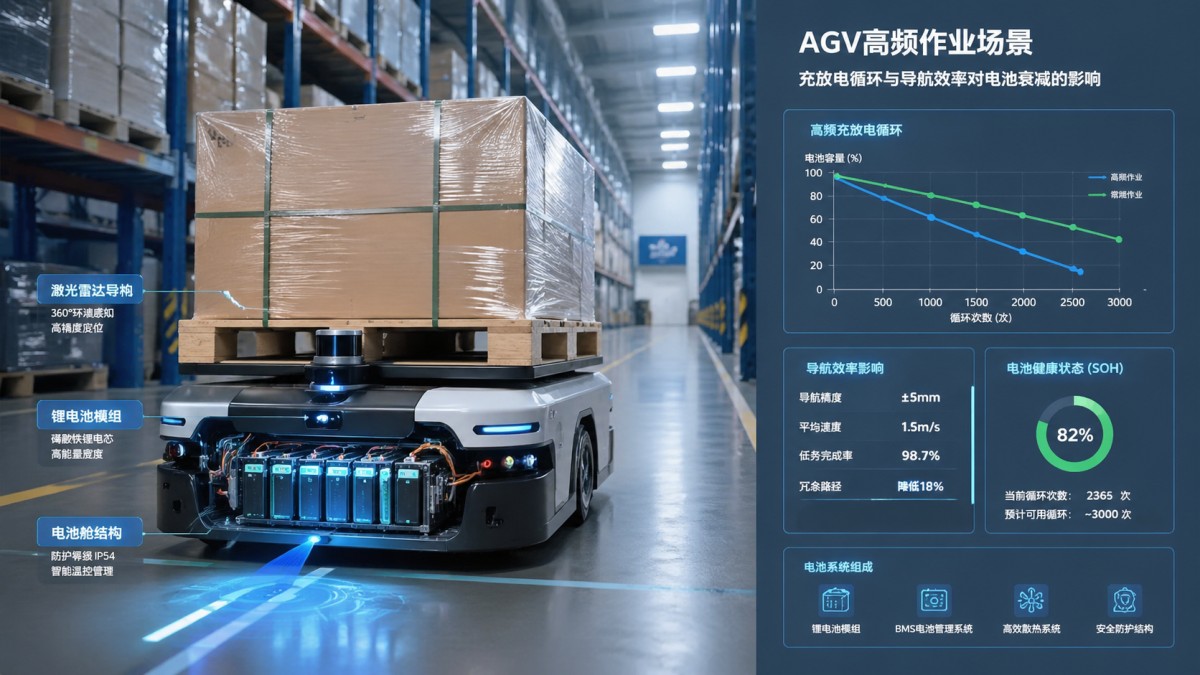
In many industrial fleets, battery health is still judged by a simple question: how old is the pack? That shortcut is convenient, but it often leads to poor maintenance timing and misleading lifecycle cost models. For AGV systems, the battery degradation rate is usually driven more by how often, how hard, and under what thermal conditions the battery works than by calendar age alone.
A duty cycle describes the repeated pattern of discharge, idle time, charging, peak current demand, and ambient temperature exposure over a shift, a day, or a week. In a light-use warehouse AGV running 4–6 hours per day at moderate loads, a 3-year-old battery may remain serviceable. In a high-throughput line-side transport application running 16–20 hours per day with frequent acceleration and charging events, the same battery chemistry may show meaningful capacity fade much earlier.
This is especially relevant when companies compare agv magnetic tape vs slam comparison results. Navigation architecture changes route smoothness, stopping behavior, and rerouting frequency. A magnetic tape AGV on a fixed path may produce stable energy demand, while a SLAM-based vehicle in a dynamic factory can experience more variable acceleration and route corrections. That variation does not automatically mean worse battery life, but it changes the duty profile and therefore the battery degradation rate.
For procurement teams, the implication is practical. An attractive automated guided vehicle price on paper can become expensive if the operating pattern forces early battery replacement. For operators, the issue shows up as shorter runtime between charges, slower lift cycles, or more frequent low-voltage alarms. For enterprise decision-makers, the right question is not only battery age, but how many effective cycles, what depth of discharge, what charging regime, and what temperature window the fleet has actually seen.
The 4 operating factors that usually accelerate battery fade
- High daily utilization, such as 2-shift or 3-shift operation, increases cumulative electrochemical stress and reduces the margin for battery cooling between charge events.
- Deep discharge patterns, especially repeated drops to low state of charge, can increase wear faster than shallow, well-managed cycling.
- Frequent high-current acceleration, heavy payload starts, and ramp climbing create current spikes that raise internal temperature and compound degradation.
- Poor charging discipline, including uncontrolled opportunity charging or long dwell at full charge, can be as damaging as the vehicle workload itself.
How different AGV applications create different battery degradation patterns
The battery degradation rate is not uniform across sectors. A hospital logistics robot, an e-commerce shuttle, and a heavy manufacturing tugger may all be labeled AGVs, but their energy demand patterns differ sharply. In broad industrial practice, duty cycle is shaped by route length, payload, acceleration profile, stop-start density, floor condition, and charging strategy more than by the nameplate battery age.
Warehousing often combines long travel distance with moderate payload and dense mission scheduling. Manufacturing intralogistics may involve shorter routes but higher tow loads, docking precision, and more repeated starts. Cold-chain or semi-conditioned spaces add a temperature factor that can reduce usable capacity and shift charging frequency. These conditions alter battery behavior far faster than calendar time by itself.
The navigation stack also plays a role. Teams reviewing agv lidar navigation accuracy should connect localization performance with motion efficiency. Better path planning and obstacle avoidance can reduce unnecessary detours, harsh braking, and idle waiting. Over a 6-month to 12-month operating period, those small mission-level energy savings can materially improve battery stress distribution across the fleet.
The table below helps information researchers, operators, and buyers map duty cycle characteristics to likely battery stress behavior. It is not a replacement for pack-level data logging, but it is a useful first screening framework during fleet planning and supplier evaluation.
A common mistake is to compare battery life between fleets without adjusting for utilization intensity. A two-year-old pack in a single-shift site may be healthier than a one-year-old pack in a 24/7 site. That is why TSV emphasizes parameter-led evaluation: route data, thermal exposure, charge pattern, and mission density should be reviewed together before drawing conclusions about battery aging.
Three field scenarios where age-based judgment fails
Scenario 1: Similar fleet age, different throughput
Two sites deploy the same AGV model in the same quarter. Site A runs 1 shift, Site B runs nearly continuous replenishment. By month 12, Site B shows shorter intervals between charges and more pack heating. Age is equal, but duty cycle is not.
Scenario 2: Same battery age, different navigation efficiency
A fleet with poor traffic orchestration may accumulate unnecessary dwell and rerouting losses. Another fleet with better agv lidar navigation accuracy and smoother dispatching may deliver more missions with less battery strain.
Scenario 3: Same calendar age, different charging logic
One operation uses controlled opportunity charging with thermal protection and state-of-charge thresholds. Another uses irregular top-ups whenever a charger is free. The second pattern can accelerate uneven wear even if the packs were commissioned on the same date.
Which technical indicators should buyers and engineers actually check?
When evaluating AGV battery degradation rate, the most useful indicators are not always the most advertised ones. Rated capacity is only a starting point. Buyers should ask how the vehicle performs after sustained cycling, what runtime remains under typical payload, and how the battery management system handles temperature, balancing, and low-state-of-charge protection.
For procurement and technical due diligence, a practical framework includes 5 core checks: usable energy window, charging time under the actual charger profile, thermal behavior during repeated missions, voltage stability under peak load, and serviceability of the battery pack. These checks are often more valuable than a single headline specification because they connect directly to real fleet uptime.
TSV’s engineering perspective is simple: parameters do not lie. A supplier that cannot discuss charge regime, expected cycle behavior, and load-dependent runtime in clear terms may not be giving you enough information for lifecycle costing. This matters when automated guided vehicle price comparisons are tight. A lower purchase quote can be offset by shorter battery replacement intervals, more charger infrastructure, or higher downtime exposure.
The table below is a procurement-oriented checklist. It connects battery metrics with operational consequences, helping R&D teams, operators, and senior buyers move from generic claims to decision-grade evaluation.
Used correctly, these checks improve comparison quality across vendors and across navigation options. They also create better conversations between engineering and procurement. Instead of debating whether a battery is “new enough,” teams can quantify whether the pack is suited to 8-hour, 12-hour, or near-continuous operation, and whether the battery degradation rate aligns with the expected asset payback period.
A simple 4-step evaluation process before purchase
- Define the real mission profile: route length, payload band, stop frequency, slope, and shift schedule.
- Request duty-cycle-based runtime and charging data instead of relying only on nominal battery capacity.
- Review navigation efficiency factors, including agv magnetic tape vs slam comparison results and agv lidar navigation accuracy under site traffic conditions.
- Model lifecycle cost over 24–60 months, including charger infrastructure, replacement timing, and service response.
Common misconceptions, operating risks, and FAQ for battery lifecycle planning
One frequent misconception is that a battery kept in service for a shorter calendar period is automatically healthier. In reality, two packs of the same age may have very different remaining utility because the number of effective cycles, the thermal profile, and the charging behavior differ. Another misconception is that battery fade is only a battery issue. In many cases, traffic management, route logic, and charger placement contribute just as much to the outcome.
Operators should also watch for indirect warning signs. If an AGV starts requiring more frequent charging over 8–12 weeks, slows earlier in the shift, or shows higher temperature alarms during repeated missions, those are operational clues worth investigating. Buyers comparing automated guided vehicle price should ask whether those symptoms can be monitored through the BMS, fleet software, or service diagnostics, because visibility often reduces avoidable replacement cost.
For many sites, a disciplined review every month and a deeper performance analysis every quarter is a reasonable operating rhythm. That does not require complex laboratory testing. Even basic trending of runtime, charge duration, route efficiency, and pack temperature can reveal whether the battery degradation rate is consistent with the original design assumptions.
The FAQ below focuses on search-driven questions that often appear during AGV selection, fleet expansion, and maintenance planning.
How can I tell whether duty cycle is hurting the battery more than age?
Start by comparing actual runtime and charging frequency over time. If two similar-age AGVs show different runtime loss, inspect mission count, payload, stop-start density, and charging behavior. A pack that sees more high-load missions or more frequent partial charging may degrade faster even if it is newer on the calendar.
Does navigation type affect battery degradation rate?
Yes, indirectly. The battery does not “care” whether the AGV uses magnetic tape or SLAM in a branding sense. It responds to motion behavior. In an agv magnetic tape vs slam comparison, look at route smoothness, rerouting frequency, waiting time, and braking profile. Those factors can change energy demand and therefore battery stress.
What should procurement teams ask when comparing automated guided vehicle price?
Ask for runtime under your payload range, recommended charging logic, estimated replacement window under 1-shift versus 2-shift operation, and service lead time for battery parts. A lower upfront automated guided vehicle price may not be the better commercial choice if it requires more chargers, shorter replacement intervals, or higher downtime risk.
Why does agv lidar navigation accuracy matter to battery planning?
Because localization quality affects path efficiency. Better agv lidar navigation accuracy can reduce route drift, unnecessary corrections, and repeated stopping in dynamic traffic. Over hundreds of missions per week, those gains can improve energy consistency and reduce avoidable battery stress.
Why work with TSV when evaluating AGV battery degradation, fleet cost, and supplier claims?
TechStat Vanguard focuses on engineering truth, not promotional adjectives. For AGV projects, that means we help teams convert vague sales language into verifiable decision criteria: runtime under duty cycle, charge behavior under real site conditions, navigation-linked energy efficiency, and maintenance implications across a 2-year to 5-year operating horizon.
This approach is useful for several stakeholders at once. Information researchers need clearer parameter logic. Operators need practical warning signs and maintenance thresholds. Procurement teams need structured comparison points beyond automated guided vehicle price. Enterprise decision-makers need a defensible view of total cost, operational resilience, and supplier qualification risk.
If you are planning a new AGV deployment or reviewing underperforming fleets, TSV can support parameter confirmation, supplier comparison, navigation tradeoff analysis, and lifecycle cost framing. We can also help your team clarify what to ask about agv magnetic tape vs slam comparison, battery service intervals, charger planning, and agv lidar navigation accuracy in complex industrial traffic.
Contact TSV to discuss the points that usually decide project outcomes: battery duty-cycle fit, operating-hour assumptions, route efficiency, charging architecture, expected delivery window, service process, and quotation scope. When your team needs fewer buzzwords and more engineering-grade clarity, that is where our benchmarking and technical analysis add value.
Search News
Hot Articles
- Carbon Fiber StructuresHow to Specify Aerospace Carbon Fiber Assemblies for Lightweight, Load-Bearing PartsJul 11, 2026
- Machine VisionXiaomi, Alibaba DAMO Academy Drive Open-Source Robotics Model Ecosystem, Lowering Algorithm Development Barriers for Overseas SMEs Adopting Chinese Robotics SolutionsMar 30, 2026
- Cobots & ArmsShanxi 'AI+' Conference Showcases Embodied Intelligence with Multinational Buyer Engagement: Key Industry ImplicationsMar 30, 2026
Popular Tags
Recommended News
 Jul 11, 2026How to Specify Aerospace Carbon Fiber Assemblies for Lightweight, Load-Bearing PartsAerospace carbon fiber assemblies: learn how to specify laminate design, load data, joining methods, and inspection controls for lighter, reliable load-bearing aerospace parts.Elena Rostova (UAV Systems Researcher)
 Mar 30, 2026Xiaomi, Alibaba DAMO Academy Drive Open-Source Robotics Model Ecosystem, Lowering Algorithm Development Barriers for Overseas SMEs Adopting Chinese Robotics SolutionsXiaomi & Alibaba DAMO Academy's open-source robotics models lower algorithm barriers for global SMEs. Boost efficiency in manufacturing, logistics & smart retail with ROS 2 compatible solutions.TSV Data Lab
 Mar 30, 2026Shanxi 'AI+' Conference Showcases Embodied Intelligence with Multinational Buyer Engagement: Key Industry ImplicationsShanxi 'AI+' Conference highlights embodied intelligence with Tesla, Ubtech & Jiantao showcasing multimodal robotics. 40+ global buyers validated tech on-site, creating new B2B channels for industrial automation & AI solutions.Chen Wei (Automation Lead Engineer)
 Mar 30, 2026Zhongguancun Unveils 6G Integrated Sensing-Computing-Intelligence Platform to Empower Embodied Robots for Global Industrial ApplicationsZhongguancun's new 6G platform revolutionizes industrial robotics with <10ms latency, empowering global automotive, logistics & port automation. Discover how this tech boosts China's smart manufacturing exports.TSV Data Lab
 Mar 30, 2026Mech-Mind Tianjin Embodied Intelligence R&D and Production Base Goes Live, Cutting Delivery Time by 20%–30% for Global Customized AMR+Vision SolutionsMech-Mind's Tianjin AMR+Vision production base cuts delivery time by 20%-30% for欧美 & Latin American markets. Discover how this PLd-certified facility accelerates customized robotics solutions for smart manufacturing and logistics.Chen Wei (Automation Lead Engineer)
 Mar 30, 2026Boao Forum Reveals 'Co-evolution of Big and Small Brains' Trend in Humanoid Robots, China's Embodied Intelligence Accelerates Adaptation to Overseas Manufacturing Service ScenariosDiscover how China's humanoid robots, featuring 'Co-evolution of Big and Small Brains,' are revolutionizing global manufacturing. Learn about Embodied Tian Gong 3.0's ISO compliance and overseas deployment at Boao Forum 2026.Chen Wei (Automation Lead Engineer)
 Mar 30, 2026China Railway Industrial Secures Patent for Embodied Robotics in Material Handling, Boosting High-Precision Delivery Capabilities for Overseas Infrastructure and Manufacturing ProjectsChina Railway Industrial's new patent for embodied robotics in material handling boosts high-precision delivery for global infrastructure & manufacturing. Discover how this innovation enhances logistics accuracy in automotive, rail transit & EPC projects.Chen Wei (Automation Lead Engineer)
 Oct 25, 2026Hesai Leads Global ADAS Main Lidar Shipments in Yole’s 2026 ReportHesai led global ADAS main lidar shipments with a 43% share in 2025, according to Yole’s 2026 report. Explore what this ranking reveals about its automotive market position.TSV Data Lab
 Oct 25, 2026Choosing an Aerospace Materials Manufacturer: Quality and Traceability ChecksChoosing an aerospace materials manufacturer? Learn how to verify certifications, test reports, and lot traceability to qualify suppliers confidently and reduce costly sourcing risks.Dr. Marcus Vance
 Oct 24, 2026Guotai Haitong: Global Entry-Level 3D Printer Shipments Rose 39% in Q1 2026Entry-level 3D printer shipments rose 39% in Q1 2026, Guotai Haitong reports. Explore how AI, multicolor printing and print farms are shaping market growth.Dr. Marcus Vance
 Oct 24, 2026Choosing an Industrial Vision Inspection Supplier: Acceptance Tests That MatterChoose an industrial vision inspection supplier with confidence. Discover acceptance tests for defect detection, false rejects, production speed, and reliable part rejection before you buy.TSV Data Lab
 Oct 23, 2026US Navy Raises Gecko Robotics Contract Ceiling to $300M for Robotic Fleet MaintenanceUS Navy raises Gecko Robotics’ contract ceiling to $300M for Pacific Fleet robotic inspections. Explore potential opportunities for maintenance suppliers and key procurement considerations.Chen Wei (Automation Lead Engineer)
 Oct 23, 2026Choosing Industrial Sensing Systems for Global Plants: Protocol CompatibilityCompare industrial sensing systems international buyers can trust. Explore protocol compatibility, reduce integration risks, and select proven configurations for reliable global plant deployments.TSV Data Lab
 Oct 22, 2026KUKA Showcases Physical AI and iiQKA.AI Vision at NVIDIA GTC BerlinExplore KUKA’s Physical AI showcase at NVIDIA GTC Berlin and discover how iiQKA.AI Vision aims to simplify robotic vision integration and improve 2D and 3D scene recognition.TSV Data Lab
 Oct 22, 2026Robotic Machining of Advanced Composites: What Tolerances Are Achievable?Explore advanced materials machining robotics: discover what drives achievable composite tolerances and how to validate accuracy before investing in your next machining system.Dr. Marcus Vance
 Oct 21, 2026China’s Industrial Robot Exports Near RMB 10 Billion in First Nine Months of 2026China’s industrial robot exports neared RMB 10 billion in January–September 2026, with value rising faster than volume. Explore the data and what it could mean for suppliers.Chen Wei (Automation Lead Engineer)
 Oct 21, 2026Low-Latency Industrial Data Processing: Pricing and Key Cost DriversExplore industrial data latency price drivers, from edge hardware to integration and support. Learn how to compare quotes, verify performance, and avoid unnecessary costs.TSV Data Lab
 Oct 20, 2026KUKA Launches iiQKA.AI Vision to Simplify Industrial Image ProcessingKUKA iiQKA.AI Vision simplifies industrial image processing with controller-based 2D and 3D vision. Explore drag-and-drop setup for vision-guided automation.TSV Data Lab
 Oct 20, 2026Smart Industrial Edge Devices: Key Criteria for Legacy PLC IntegrationChoose smart industrial edge devices for legacy PLC integration. Discover key criteria for compatibility, data quality, security, and reliable collection without disrupting control.TSV Data Lab
 Oct 19, 2026Choosing a Radar Sensor by Application: Range, Resolution, and Field of ViewSimplify radar sensor application based product selection. Compare range, resolution, and field of view to avoid blind spots and choose with confidence. Explore the guide.TSV Data Lab
 Oct 18, 2026Comparing Material Options for Procurement: Specs, Costs, and Supply RisksExplore procurement oriented technical content on material options, specs, costs, and supply risks. Compare alternatives to cut hidden expenses and make confident sourcing decisions.Dr. Marcus Vance
 Oct 17, 20265-Axis CNC Positioning Accuracy: How to Interpret ISO 230-2 Test ResultsAssess 5 axis CNC machining positioning accuracy with ISO 230-2. Learn to interpret repeatability, reversal error, and test conditions to compare suppliers and make confident acceptance decisions.Dr. Marcus Vance
 Oct 16, 2026Choosing a Rugged Edge AI Box Supplier: Thermal Tests and Lifecycle SupportChoose a rugged edge AI box supplier with proven thermal performance and reliable lifecycle support. Discover the tests and commitments to verify before you buy.TSV Data Lab
 Oct 15, 2026R&D Cost Reduction Services: How to Evaluate Fees, Savings, and ROIEvaluate R&D cost reduction services with confidence. Compare fees, verify savings, and calculate ROI without compromising performance. Discover how to choose a provider that delivers real value.Chen Wei (Automation Lead Engineer)