When Inconel 718 tool wear rate points to the wrong cutting data
Publication Date
author
When the Inconel 718 tool wear rate looks abnormal, the problem is often not the insert but the cutting data behind it. For engineers, operators, buyers, and decision-makers evaluating precision machining, this article connects inconel 718 tool wear rate with cnc milling chatter frequency analysis, 5 axis cnc surface finish ra, and micro machining tolerance limits to reveal how misleading parameters can distort quality, cost, and supplier selection.
Why an abnormal Inconel 718 tool wear rate often signals a data problem first
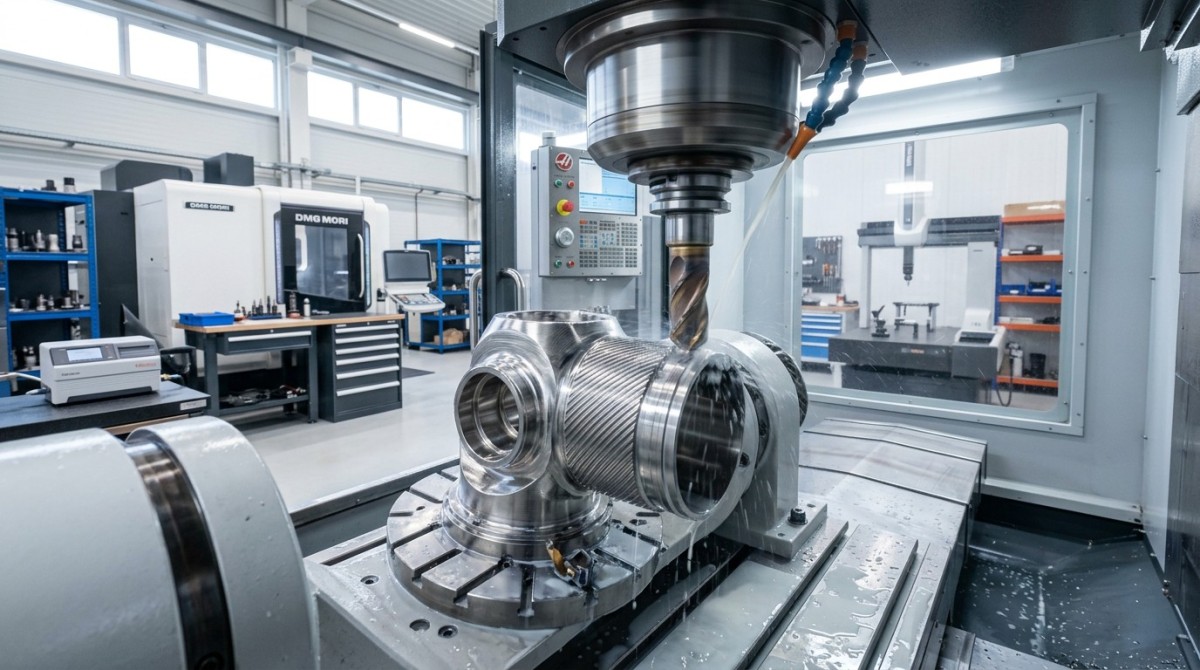
Inconel 718 is routinely selected for aerospace, energy, and high-temperature assemblies because it retains strength under heat and resists deformation. That same stability is exactly why machining it is unforgiving. When the inconel 718 tool wear rate spikes, many shops immediately blame insert grade, coating, or coolant. In practice, the first suspect should be the cutting data stack: surface speed, feed per tooth, axial depth, radial engagement, spindle behavior, tool overhang, and toolpath strategy.
For information researchers, the key issue is interpretation. A wear chart without process context is weak evidence. For operators, the issue is repeatability shift over a 2-hour to 6-hour production window. For procurement teams, the risk is selecting a supplier based on a low quoted cycle time that was achieved with aggressive but unstable data. For enterprise decision-makers, abnormal wear is rarely an isolated tooling cost problem; it usually expands into scrap, rework, schedule slippage, and supplier qualification delays.
The wrong cutting data can create several misleading symptoms at once. Flank wear may look like a coating failure, crater wear may appear to be a chip control problem, and edge chipping may be mistaken for poor insert toughness. Yet these outcomes often come from an unstable process window, especially when cutting speed is pushed beyond the shop’s spindle rigidity and toolholder damping capability. In difficult alloys, a difference of 10%–20% in cutting speed or radial engagement can change wear behavior more than a change of insert brand.
This is where TSV’s engineering-first approach matters. Parameters do not lie, but isolated parameters do mislead. A supplier that claims good Inconel performance should be able to discuss wear mode, chatter signatures, achievable surface finish Ra, tolerance drift by batch size, and the practical limits of the machine-tool-fixture system. Any evaluation that ignores that chain is vulnerable to marketing noise and incomplete benchmark claims.
What a healthy process review should include
- A baseline record of cutting speed, feed, axial depth, radial width, tool overhang, and coolant method for at least 3 consecutive production runs.
- Wear mode mapping at fixed intervals, such as every 10 parts, every 20 minutes, or every 30 minutes, depending on lot size and part complexity.
- Correlation between tool wear, spindle load trend, chatter frequency analysis, and surface finish change rather than relying on a single endpoint result.
- Confirmation of whether the reported machining result came from roughing, semi-finishing, or finishing, because wear behavior differs sharply across these 3 stages.
How chatter frequency, surface finish Ra, and tolerance limits expose bad cutting data
A misleading inconel 718 tool wear rate rarely stays isolated. It usually leaves fingerprints in three adjacent metrics: cnc milling chatter frequency analysis, 5 axis cnc surface finish Ra, and micro machining tolerance limits. If chatter bands rise but the supplier only reports average spindle load, the process story is incomplete. If Ra is acceptable on the first few parts but deteriorates after 15–30 parts, the process may be running too close to a stability boundary. If tolerance drift expands as the tool ages, the real issue is not nominal tool life but the usable consistency window.
For operators, chatter frequency analysis helps separate sound from actionable signal. Regenerative chatter often becomes visible before visible burr growth or finish collapse. For buyers, this matters because a quote based on high metal removal rate may hide unstable harmonics that only appear in long-run production. For managers reviewing capability claims, the practical question is not whether a shop can machine one good sample, but whether it can maintain geometry, finish, and wear control over small-batch and medium-batch production.
Surface finish is equally revealing. In 5-axis finishing of Inconel 718, a target like Ra 0.8–1.6 μm may be realistic for many features, while more demanding faces or sealing surfaces may require lower values under tighter control of toolpath smoothing, step-over, and cutter runout. If a vendor advertises a low Ra result but cannot explain whether the value was measured along or across the feed marks, wet or dry, fresh edge or near tool end-of-life, the number should not be used as a procurement benchmark.
Tolerance limits in micro machining add another layer. A feature tolerance of ±10 μm or ±20 μm can be technically possible on selected geometries, but not all Inconel 718 features are equally stable under heat and cutting force. Thin walls, deep pockets, and small radii react differently. Shops that understand this will separate capability by feature family, tool diameter range, and lot size. Shops that do not may show one headline tolerance figure that has little value for actual production planning.
Cross-metric warning signs to watch
The table below helps procurement teams and technical reviewers identify when the reported inconel 718 tool wear rate is likely masking bad cutting data rather than reflecting a genuine tool material limitation.
The key takeaway is simple: wear, chatter, Ra, and tolerance must be evaluated as a linked system. If one supplier reports only wear rate and another provides wear mode, chatter review, finish traceability, and feature-based tolerance behavior, the second dataset is significantly more useful for supplier qualification and long-term cost control.
Why this matters in 5-axis procurement
In 5-axis work, tool orientation changes the effective cutting diameter, heat generation, and force direction. That means the same nominal spindle speed can produce different real cutting conditions along one toolpath. A buyer comparing suppliers should ask whether reported Ra and tool life data came from indexed 3+2 machining or full simultaneous 5-axis motion. The difference can affect both finish stability and wear pattern over a 20-part to 100-part batch.
What engineers and buyers should check before accepting machining claims
A practical procurement review should convert machining language into decision language. That means moving beyond broad claims such as “good Inconel experience” and demanding a structured technical discussion. In the comprehensive manufacturing environment, this is especially important because suppliers often serve mixed sectors including aerospace, energy, medical, and industrial automation. Capability that is valid for one part family may not transfer directly to another without changes in strategy, fixturing, and process control.
For technical teams, the best screening method is to request evidence across 3 layers: process data, part outcome, and production consistency. Process data includes speed, feed, engagement, coolant, and spindle condition. Part outcome includes Ra, dimensional report, burr condition, and visual wear mode. Production consistency includes repeatability over defined lot sizes such as prototype, 10–50 parts, and 50+ parts. A supplier that cannot organize capability in this way is difficult to benchmark fairly.
For buyers, the commercial implication is direct. A lower unit quote may depend on a short tool life that increases hidden tooling cost, re-inspection effort, or premium scheduling. Conversely, a higher quote may reflect a more conservative but stable process window that reduces risk over the full program life cycle. This is why TSV emphasizes technical benchmarking rather than slogan-driven sourcing. Procurement quality improves when data is normalized before pricing is compared.
A robust RFQ or technical review package for Inconel 718 machining should also specify whether the priority is cycle time, surface integrity, edge condition, dimensional capability, or qualification speed. Many sourcing failures occur because a customer requests all five at once without ranking them. In difficult alloys, trade-offs are real. A process optimized for high removal rate may not deliver the same finish life or tight-feature stability as one tuned for finishing quality.
A decision checklist for supplier evaluation
- Ask for tool wear data tied to a defined toolpath stage: roughing, semi-finishing, or finishing, not just a generic tool life number.
- Request 5 axis cnc surface finish Ra data together with measurement direction, sample count, and tool condition at the time of measurement.
- Confirm whether cnc milling chatter frequency analysis is available from machine monitoring, spindle load history, or vibration review.
- Check whether micro machining tolerance limits are stated by feature type, wall thickness, and tool diameter range rather than as a single headline number.
- Clarify lot size assumptions, because capability on 3 prototypes is not the same as capability over 30 or 300 parts.
Procurement comparison matrix
The following comparison structure helps turn scattered technical claims into a more objective sourcing decision for Inconel 718 programs.
This matrix is useful because it separates a supplier that can machine Inconel 718 from a supplier that can document, stabilize, and scale the process. For procurement leaders and CTOs, that distinction often determines whether supplier onboarding takes 2–4 weeks or stretches into multiple rounds of revalidation.
Common misconceptions, risk controls, and implementation priorities
One common misconception is that a lower inconel 718 tool wear rate always means a better process. Not necessarily. A very conservative process can reduce wear but increase cycle time beyond acceptable program cost. Another misconception is that chatter is only an operator issue. In reality, chatter is often a system issue involving machine dynamics, fixturing, tool length-to-diameter ratio, and CAM strategy. Treating it as a shop-floor nuisance rather than a sourcing criterion is a costly mistake.
A second misconception is that micro machining tolerance limits can be quoted universally. In hard alloys, tolerance capability depends heavily on feature geometry and sequence. Deep micro slots, thin web sections, and transition radii should be reviewed independently. If a supplier claims tight limits without discussing thermal control, in-process inspection frequency, or tool change logic, the statement should be considered incomplete rather than impressive.
Risk control should be planned in stages. Stage 1 is data validation during quotation or feasibility review. Stage 2 is pilot confirmation over a limited lot, often 5–20 parts depending on part value and complexity. Stage 3 is production control with wear checkpoints, finish verification, and dimensional trend review. This 3-stage discipline often reduces disputes later because both customer and supplier agree on what “capability” actually means before larger orders begin.
For enterprises sourcing across regions, standards alignment also matters. If parts fall into aerospace or medical-adjacent programs, suppliers may need process discipline consistent with frameworks such as AS9100 or ISO 13485 even when the specific part is not certified under those systems. The lesson is not to assume certification alone guarantees machining quality, but to use standards language to clarify traceability, change control, inspection logic, and documentation expectations.
FAQ for researchers, operators, and procurement teams
How should I judge Inconel 718 tool wear data during supplier comparison?
Do not compare wear life as a standalone number. Compare the full process window: speed, feed, radial engagement, coolant mode, tool overhang, feature type, and whether the result came from roughing or finishing. A wear result tied to 20 parts in a stable finishing pass may be more valuable than a larger headline number from a loosely defined roughing trial.
What Ra value is realistic in 5-axis machining of Inconel 718?
It depends on the feature, tool diameter, step-over, and machine condition. Many general finishing applications target Ra ranges around 0.8–1.6 μm, while more demanding surfaces may require tighter control. The important point is that the value must be tied to measurement method, tool condition, and feature geometry rather than presented as a generic promise.
Why does chatter analysis matter to procurement teams?
Because chatter is often the earliest sign that a quoted cycle time is unsustainable. A process can produce acceptable first articles and still fail economically in repeat production. Chatter analysis gives buyers a way to test whether the supplier’s data is stable enough for batch manufacturing, not just sample presentation.
Are micro machining tolerance limits on Inconel 718 reliable enough for critical parts?
They can be, but only when the tolerance claim is linked to specific feature categories, tooling strategy, support condition, and inspection frequency. Ask whether the limit applies to slots, holes, thin walls, or contoured faces, and whether it was demonstrated over prototypes only or through repeated production runs.
Why technical benchmarking matters and what you can discuss with TSV
In precision machining, bad decisions often begin with incomplete parameter narratives. TSV exists to filter that noise. Our position is not built on broad marketing language but on engineering traceability: what was cut, how it was cut, under which limits, and with what repeatability. That is especially valuable when your team must compare suppliers across countries, machine platforms, and sector-specific quality expectations.
If your team is reviewing an abnormal inconel 718 tool wear rate, we can help structure the question correctly. That includes parameter confirmation, chatter-related data interpretation, 5 axis cnc surface finish Ra evaluation, micro machining tolerance limit review, and supplier comparison logic for prototype versus repeat production. For procurement leaders, this shortens the path from broad RFQ language to a more defensible technical shortlist.
If you are preparing a sourcing package or qualifying a machining partner, the most useful next step is a data-based discussion rather than a generic capability call. You can consult TSV on 4 practical areas: process parameter review, supplier benchmarking criteria, delivery-risk assessment, and documentation expectations for advanced manufacturing programs. That includes questions around sample support, quotation comparability, tolerance clarification, finish targets, and realistic lead-time assumptions such as prototype versus pilot run windows.
For teams that need clearer supplier decisions in hard-tech manufacturing, contact TSV with your part family, target material, tolerance priorities, finish requirements, expected batch size, and timeline. We can help you frame the right questions on cutting data, feasibility, certification language, custom process expectations, and quote alignment, so your sourcing decision is driven by engineering truth rather than by incomplete claims.
Search News
Hot Articles
- Carbon Fiber StructuresHow to Specify Aerospace Carbon Fiber Assemblies for Lightweight, Load-Bearing PartsJul 11, 2026
- Machine VisionXiaomi, Alibaba DAMO Academy Drive Open-Source Robotics Model Ecosystem, Lowering Algorithm Development Barriers for Overseas SMEs Adopting Chinese Robotics SolutionsMar 30, 2026
- Cobots & ArmsShanxi 'AI+' Conference Showcases Embodied Intelligence with Multinational Buyer Engagement: Key Industry ImplicationsMar 30, 2026
Popular Tags
Recommended News
 Jul 11, 2026How to Specify Aerospace Carbon Fiber Assemblies for Lightweight, Load-Bearing PartsAerospace carbon fiber assemblies: learn how to specify laminate design, load data, joining methods, and inspection controls for lighter, reliable load-bearing aerospace parts.Elena Rostova (UAV Systems Researcher)
 Mar 30, 2026Xiaomi, Alibaba DAMO Academy Drive Open-Source Robotics Model Ecosystem, Lowering Algorithm Development Barriers for Overseas SMEs Adopting Chinese Robotics SolutionsXiaomi & Alibaba DAMO Academy's open-source robotics models lower algorithm barriers for global SMEs. Boost efficiency in manufacturing, logistics & smart retail with ROS 2 compatible solutions.TSV Data Lab
 Mar 30, 2026Shanxi 'AI+' Conference Showcases Embodied Intelligence with Multinational Buyer Engagement: Key Industry ImplicationsShanxi 'AI+' Conference highlights embodied intelligence with Tesla, Ubtech & Jiantao showcasing multimodal robotics. 40+ global buyers validated tech on-site, creating new B2B channels for industrial automation & AI solutions.Chen Wei (Automation Lead Engineer)
 Mar 30, 2026Zhongguancun Unveils 6G Integrated Sensing-Computing-Intelligence Platform to Empower Embodied Robots for Global Industrial ApplicationsZhongguancun's new 6G platform revolutionizes industrial robotics with <10ms latency, empowering global automotive, logistics & port automation. Discover how this tech boosts China's smart manufacturing exports.TSV Data Lab
 Mar 30, 2026Mech-Mind Tianjin Embodied Intelligence R&D and Production Base Goes Live, Cutting Delivery Time by 20%–30% for Global Customized AMR+Vision SolutionsMech-Mind's Tianjin AMR+Vision production base cuts delivery time by 20%-30% for欧美 & Latin American markets. Discover how this PLd-certified facility accelerates customized robotics solutions for smart manufacturing and logistics.Chen Wei (Automation Lead Engineer)
 Mar 30, 2026Boao Forum Reveals 'Co-evolution of Big and Small Brains' Trend in Humanoid Robots, China's Embodied Intelligence Accelerates Adaptation to Overseas Manufacturing Service ScenariosDiscover how China's humanoid robots, featuring 'Co-evolution of Big and Small Brains,' are revolutionizing global manufacturing. Learn about Embodied Tian Gong 3.0's ISO compliance and overseas deployment at Boao Forum 2026.Chen Wei (Automation Lead Engineer)
 Mar 30, 2026China Railway Industrial Secures Patent for Embodied Robotics in Material Handling, Boosting High-Precision Delivery Capabilities for Overseas Infrastructure and Manufacturing ProjectsChina Railway Industrial's new patent for embodied robotics in material handling boosts high-precision delivery for global infrastructure & manufacturing. Discover how this innovation enhances logistics accuracy in automotive, rail transit & EPC projects.Chen Wei (Automation Lead Engineer)
 Oct 27, 2026GXO and Agility Robotics Expand Partnership to Accelerate US Humanoid Robot DeploymentGXO and Agility Robotics plan to expand US humanoid robot deployment with Digit 4 in early 2027. Explore warehouse automation plans, service terms and future Digit 5 upgrades.Chen Wei (Automation Lead Engineer)
 Oct 27, 2026Robotic Automation Costs: Budgeting for Equipment, Integration, and MaintenancePlan your robotics automation cost with confidence. Explore equipment, integration, and maintenance expenses, compare quotes, and build a realistic budget for better ROI.Chen Wei (Automation Lead Engineer)
 Oct 26, 2026AMAXiMAL Releases Open-Source TopMod 3D v3 With Claude AIExplore AMAXiMAL’s free, open-source TopMod 3D v3 with Claude AI assistance, topology-based modeling and plywood fabrication tools that connect complex designs to physical builds.Dr. Marcus Vance
 Oct 26, 2026Choosing a SCADA System Integrator Company: PLC Compatibility and Long-Term SupportChoose a scada system integrator company with proven PLC compatibility and reliable long-term support. Discover what to test, compare, and require before investing.Victor Lin (Chief Software Architect)
 Oct 25, 2026Hesai Leads Global ADAS Main Lidar Shipments in Yole’s 2026 ReportHesai led global ADAS main lidar shipments with a 43% share in 2025, according to Yole’s 2026 report. Explore what this ranking reveals about its automotive market position.TSV Data Lab
 Oct 25, 2026Choosing an Aerospace Materials Manufacturer: Quality and Traceability ChecksChoosing an aerospace materials manufacturer? Learn how to verify certifications, test reports, and lot traceability to qualify suppliers confidently and reduce costly sourcing risks.Dr. Marcus Vance
 Oct 24, 2026Guotai Haitong: Global Entry-Level 3D Printer Shipments Rose 39% in Q1 2026Entry-level 3D printer shipments rose 39% in Q1 2026, Guotai Haitong reports. Explore how AI, multicolor printing and print farms are shaping market growth.Dr. Marcus Vance
 Oct 24, 2026Choosing an Industrial Vision Inspection Supplier: Acceptance Tests That MatterChoose an industrial vision inspection supplier with confidence. Discover acceptance tests for defect detection, false rejects, production speed, and reliable part rejection before you buy.TSV Data Lab
 Oct 23, 2026US Navy Raises Gecko Robotics Contract Ceiling to $300M for Robotic Fleet MaintenanceUS Navy raises Gecko Robotics’ contract ceiling to $300M for Pacific Fleet robotic inspections. Explore potential opportunities for maintenance suppliers and key procurement considerations.Chen Wei (Automation Lead Engineer)
 Oct 23, 2026Choosing Industrial Sensing Systems for Global Plants: Protocol CompatibilityCompare industrial sensing systems international buyers can trust. Explore protocol compatibility, reduce integration risks, and select proven configurations for reliable global plant deployments.TSV Data Lab
 Oct 22, 2026KUKA Showcases Physical AI and iiQKA.AI Vision at NVIDIA GTC BerlinExplore KUKA’s Physical AI showcase at NVIDIA GTC Berlin and discover how iiQKA.AI Vision aims to simplify robotic vision integration and improve 2D and 3D scene recognition.TSV Data Lab
 Oct 22, 2026Robotic Machining of Advanced Composites: What Tolerances Are Achievable?Explore advanced materials machining robotics: discover what drives achievable composite tolerances and how to validate accuracy before investing in your next machining system.Dr. Marcus Vance
 Oct 21, 2026China’s Industrial Robot Exports Near RMB 10 Billion in First Nine Months of 2026China’s industrial robot exports neared RMB 10 billion in January–September 2026, with value rising faster than volume. Explore the data and what it could mean for suppliers.Chen Wei (Automation Lead Engineer)
 Oct 21, 2026Low-Latency Industrial Data Processing: Pricing and Key Cost DriversExplore industrial data latency price drivers, from edge hardware to integration and support. Learn how to compare quotes, verify performance, and avoid unnecessary costs.TSV Data Lab
 Oct 20, 2026KUKA Launches iiQKA.AI Vision to Simplify Industrial Image ProcessingKUKA iiQKA.AI Vision simplifies industrial image processing with controller-based 2D and 3D vision. Explore drag-and-drop setup for vision-guided automation.TSV Data Lab
 Oct 20, 2026Smart Industrial Edge Devices: Key Criteria for Legacy PLC IntegrationChoose smart industrial edge devices for legacy PLC integration. Discover key criteria for compatibility, data quality, security, and reliable collection without disrupting control.TSV Data Lab
 Oct 19, 2026Choosing a Radar Sensor by Application: Range, Resolution, and Field of ViewSimplify radar sensor application based product selection. Compare range, resolution, and field of view to avoid blind spots and choose with confidence. Explore the guide.TSV Data Lab