How to Read Drone Motor Thrust Test Data for Propeller and Battery Matching
Publication Date
author
How to Read Drone Motor Thrust Test Data for Propeller and Battery Matching
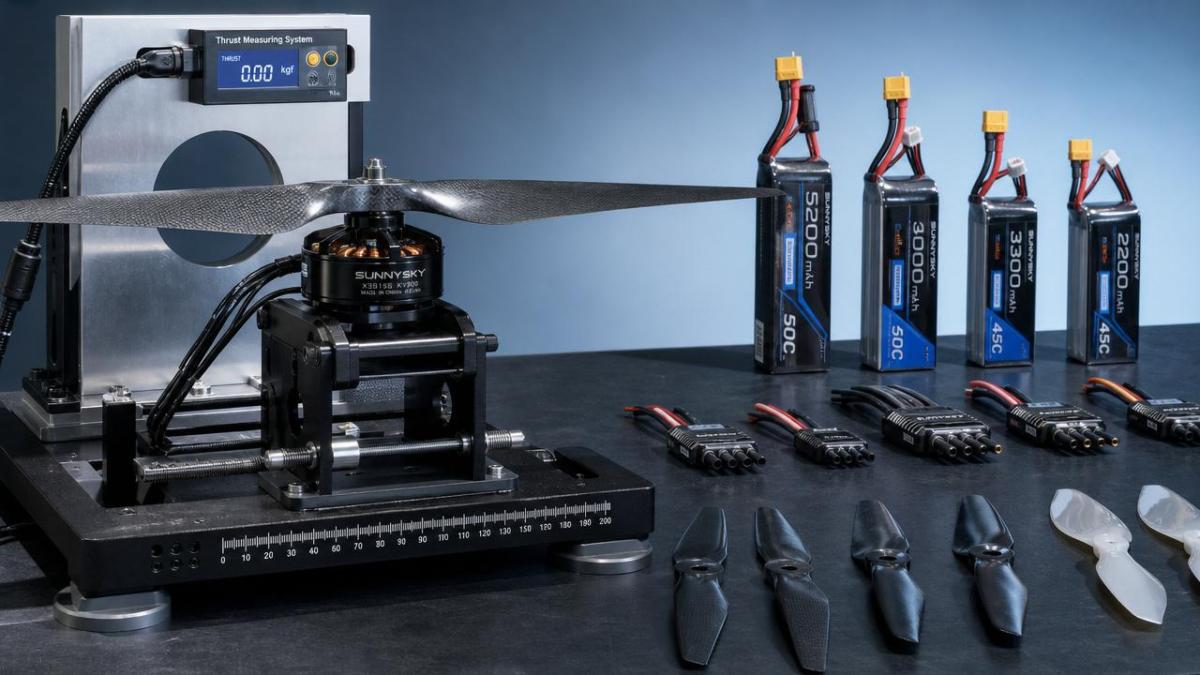
Choosing the right propeller and battery starts with understanding drone motor thrust test data, not trusting a product page headline.
A thrust table shows what really happens when a motor spins a specific prop on a specific voltage under load.
That matters because flight performance is never decided by motor KV alone.
It comes from the full system: motor, propeller, battery, ESC, frame weight, and cooling conditions.
When you read drone motor thrust test data correctly, you can predict lift margin, current draw, efficiency, and heat risk before building.
That saves time, reduces trial and error, and keeps matching decisions grounded in engineering reality.
At TechStat Vanguard, this approach reflects a simple rule: parameters matter more than claims.
What Drone Motor Thrust Test Data Usually Includes
Most test sheets look dense at first, but the columns are straightforward once you know what each number means.
A typical drone motor thrust test data table includes voltage, throttle percentage, current, power, RPM, thrust, and efficiency.
Some reports also list torque, temperature, ambient conditions, propeller model, and battery cell count.
- Voltage shows the electrical pressure applied during the test.
- Current shows how hard the system pulls from the battery.
- Power, in watts, combines voltage and current.
- RPM shows rotational speed at each throttle point.
- Thrust shows lifting force, usually in grams or kilograms.
- Efficiency often appears as grams per watt.
The most useful drone motor thrust test data is collected with clearly named props and stable power conditions.
If the source does not identify the propeller, battery voltage, or test method, treat the numbers carefully.
How to Read the Table Without Missing the Important Signals
The first mistake is reading only the maximum thrust row.
Maximum thrust is useful, but it is not the whole matching story.
In real flights, many platforms cruise around mid throttle, not full throttle.
So, when reviewing drone motor thrust test data, focus on three zones.
- Low throttle: checks smooth startup and control authority.
- Mid throttle: shows likely hovering or cruising efficiency.
- High throttle: reveals peak lift and thermal stress.
A good match usually delivers enough hover thrust at around 40% to 60% throttle.
That leaves reserve power for wind, payload changes, and emergency maneuvers.
More importantly, it keeps the motor away from constant high-current operation.
Read Thrust Together With Current
Two setups can produce similar thrust while drawing very different current.
That difference directly affects battery temperature, cable sizing, ESC stress, and flight time.
If one prop gives 2,000 grams at 28 amps, and another gives it at 22 amps, the second option is usually cleaner.
Watch Efficiency, Not Just Raw Power
Drone motor thrust test data often includes efficiency in grams per watt.
Higher efficiency means more lift for every watt consumed.
For endurance builds, this number can be more valuable than the highest peak thrust figure.
How Propeller Choice Changes the Data
A motor test only makes sense when tied to a specific propeller.
Diameter, pitch, blade count, and blade shape all change the load on the motor.
That means one motor can behave calmly with one prop and run hot with another.
Larger diameter props usually increase thrust at lower RPM.
Higher pitch props usually demand more current as airspeed and load rise.
Tri-blade props often improve grip and response, but they can reduce efficiency compared with lighter two-blade options.
A Simple Propeller Reading Example
Imagine the same motor tested with a 10x4.5 prop and an 11x5 prop on the same battery.
The 11x5 setup may produce more thrust.
But if current rises sharply near full throttle, the bigger prop may not be the better system match.
This is where drone motor thrust test data becomes practical instead of theoretical.
It shows whether added thrust comes with manageable electrical cost.
How Battery Voltage Changes Motor Behavior
Battery selection is not just about capacity.
Voltage changes how fast the motor can spin and how much power it can access with a given prop.
When comparing drone motor thrust test data across 4S and 6S setups, higher voltage often produces the same thrust at lower current.
That can reduce losses in wires and ESCs.
Still, higher voltage does not automatically mean better.
If the propeller is too aggressive, the motor can still exceed safe limits.
You need to read voltage, current, and power together.
A Practical Method for Propeller and Battery Matching
The easiest way to use drone motor thrust test data is to work backward from the aircraft’s real mission.
Start with takeoff weight, expected payload, flight style, and desired endurance.
Then compare that need against tested thrust and efficiency values.
- Calculate total loaded takeoff weight.
- Divide by motor count for minimum hover thrust per motor.
- Aim for hover near the middle throttle range.
- Check peak current against ESC and battery limits.
- Compare grams per watt in the expected flight range.
- Leave safety margin for temperature, altitude, and wind.
For example, a quadcopter weighing 4 kilograms should not hover near its top throttle band.
A healthier setup gives each motor enough reserve thrust beyond the hover requirement.
That reserve keeps control stable during turns, gusts, and payload shifts.
Use the Data for Mission Type
Endurance platforms usually favor better efficiency at modest throttle.
Heavy-lift platforms may accept lower efficiency for stronger thrust margin.
Fast response builds may prioritize propeller grip and transient control over absolute flight time.
The right answer depends on the mission, not just the motor label.
Common Mistakes When Reading Drone Motor Thrust Test Data
A few habits cause most matching errors.
- Using only maximum thrust as the buying criterion.
- Ignoring current peaks and battery discharge capability.
- Comparing test data from different propellers as if they were equal.
- Assuming bench data always matches hot outdoor conditions.
- Forgetting altitude reduces effective thrust.
- Overlooking motor temperature during repeated high-load cycles.
Bench testing is essential, but it is still a controlled snapshot.
Real operating conditions add heat soak, airflow changes, and voltage sag.
That is why conservative interpretation of drone motor thrust test data is usually the smart move.
How to Turn the Numbers Into Better Decisions
The value of drone motor thrust test data is not in collecting numbers.
The value is in making cleaner component choices with fewer surprises later.
Look for data taken with clearly defined props, stable voltages, and repeatable procedures.
Then ask practical questions.
- Does hover happen in an efficient range?
- Does the battery support the real current demand?
- Does the propeller create safe thermal load?
- Does the setup leave thrust reserve for actual conditions?
Once those answers are clear, matching becomes less about guessing and more about system engineering.
That is exactly the mindset advanced UAV teams need as platforms become more demanding and less tolerant of vague specifications.
Read the table carefully, compare the right operating points, and let drone motor thrust test data guide propeller and battery choices with confidence.
Search News
Hot Articles
- Carbon Fiber StructuresHow to Specify Aerospace Carbon Fiber Assemblies for Lightweight, Load-Bearing PartsJul 11, 2026
- Machine VisionXiaomi, Alibaba DAMO Academy Drive Open-Source Robotics Model Ecosystem, Lowering Algorithm Development Barriers for Overseas SMEs Adopting Chinese Robotics SolutionsMar 30, 2026
- Cobots & ArmsShanxi 'AI+' Conference Showcases Embodied Intelligence with Multinational Buyer Engagement: Key Industry ImplicationsMar 30, 2026
Popular Tags
Recommended News
 Jul 11, 2026How to Specify Aerospace Carbon Fiber Assemblies for Lightweight, Load-Bearing PartsAerospace carbon fiber assemblies: learn how to specify laminate design, load data, joining methods, and inspection controls for lighter, reliable load-bearing aerospace parts.Elena Rostova (UAV Systems Researcher)
 Mar 30, 2026Xiaomi, Alibaba DAMO Academy Drive Open-Source Robotics Model Ecosystem, Lowering Algorithm Development Barriers for Overseas SMEs Adopting Chinese Robotics SolutionsXiaomi & Alibaba DAMO Academy's open-source robotics models lower algorithm barriers for global SMEs. Boost efficiency in manufacturing, logistics & smart retail with ROS 2 compatible solutions.TSV Data Lab
 Mar 30, 2026Shanxi 'AI+' Conference Showcases Embodied Intelligence with Multinational Buyer Engagement: Key Industry ImplicationsShanxi 'AI+' Conference highlights embodied intelligence with Tesla, Ubtech & Jiantao showcasing multimodal robotics. 40+ global buyers validated tech on-site, creating new B2B channels for industrial automation & AI solutions.Chen Wei (Automation Lead Engineer)
 Mar 30, 2026Zhongguancun Unveils 6G Integrated Sensing-Computing-Intelligence Platform to Empower Embodied Robots for Global Industrial ApplicationsZhongguancun's new 6G platform revolutionizes industrial robotics with <10ms latency, empowering global automotive, logistics & port automation. Discover how this tech boosts China's smart manufacturing exports.TSV Data Lab
 Mar 30, 2026Mech-Mind Tianjin Embodied Intelligence R&D and Production Base Goes Live, Cutting Delivery Time by 20%–30% for Global Customized AMR+Vision SolutionsMech-Mind's Tianjin AMR+Vision production base cuts delivery time by 20%-30% for欧美 & Latin American markets. Discover how this PLd-certified facility accelerates customized robotics solutions for smart manufacturing and logistics.Chen Wei (Automation Lead Engineer)
 Mar 30, 2026Boao Forum Reveals 'Co-evolution of Big and Small Brains' Trend in Humanoid Robots, China's Embodied Intelligence Accelerates Adaptation to Overseas Manufacturing Service ScenariosDiscover how China's humanoid robots, featuring 'Co-evolution of Big and Small Brains,' are revolutionizing global manufacturing. Learn about Embodied Tian Gong 3.0's ISO compliance and overseas deployment at Boao Forum 2026.Chen Wei (Automation Lead Engineer)
 Mar 30, 2026China Railway Industrial Secures Patent for Embodied Robotics in Material Handling, Boosting High-Precision Delivery Capabilities for Overseas Infrastructure and Manufacturing ProjectsChina Railway Industrial's new patent for embodied robotics in material handling boosts high-precision delivery for global infrastructure & manufacturing. Discover how this innovation enhances logistics accuracy in automotive, rail transit & EPC projects.Chen Wei (Automation Lead Engineer)
 Sep 18, 2026Selecting UAV Aerospace Structural Parts for Strength, Weight, and Fatigue LifeUAV aerospace structural parts guide: compare strength, weight, stiffness, fatigue life, joints, and traceability to select reliable flight-ready components.Elena Rostova (UAV Systems Researcher)
 Sep 17, 2026Selecting Commercial Drone Payloads for European Inspection ProjectsCommercial drone payloads Europe: learn how to select RGB, thermal and LiDAR systems for compliant, reliable inspection data and better project outcomes.Elena Rostova (UAV Systems Researcher)
 Sep 16, 2026Machining Tolerance Validation: How to Verify Critical Dimensions Before Production ReleaseMachining tolerance analysis validation: verify critical dimensions, measurement systems, process capability, and tolerance stacks before production release.Dr. Marcus Vance
 Sep 15, 2026AGV Tape Guidance vs Laser Navigation: Which Fits Your Warehouse Layout?AGV tape guidance comparison: discover how tape and laser navigation fit changing warehouse layouts, docking needs, floor conditions, maintenance, and route flexibility.Chen Wei (Automation Lead Engineer)
 Sep 14, 2026How Point Cloud Analytics Improves Asset Inspection Workflows Across GCC ProjectsPoint cloud analytics GCC helps project leaders improve asset inspections with accurate change detection, safer workflows, and faster maintenance decisions.TSV Data Lab
 Sep 13, 2026How Aerospace Manufacturers Can Build a Digital Thread From Design to Certified ProductionDigital manufacturing for aerospace: learn how to build a traceable digital thread from design through certified production, supplier control, and audit-ready compliance.Victor Lin (Chief Software Architect)
 Sep 12, 2026How to Select a Thermal Sensor for Mapping Drones in Surveying ProjectsMapping drone thermal sensor selection made simple: compare GSD, radiometric data, NETD, calibration, and workflow fit for accurate, survey-ready thermal maps.Elena Rostova (UAV Systems Researcher)
 Sep 11, 2026Integrating Photogrammetry Workflows into Digital Twin Projects Without Data BottlenecksPhotogrammetry workflow integration for digital twins: learn how to streamline capture, validation, versioning, and delivery to prevent data bottlenecks.Victor Lin (Chief Software Architect)
 Sep 10, 2026Hard-Tech Supply Chain Procurement: Qualifying Suppliers to Cut Lead-Time RiskHard-tech supply chain procurement guide: qualify suppliers with proven process, traceability, capacity, and change control to reduce lead-time risk.Chen Wei (Automation Lead Engineer)
 Sep 09, 2026Industrial Application Notes: Cost Factors That Shape Automation Project BudgetsIndustrial application notes cost factors explained: uncover the engineering, safety, integration, and commissioning variables that shape accurate automation budgets.Victor Lin (Chief Software Architect)
 Sep 08, 2026Supplier Discovery for Sourcing: How Buyers Can Verify Capability and Supply RiskSupplier discovery for sourcing: learn how to verify supplier capability, traceability, quote assumptions, and supply risk before placing production orders.TSV Data Lab
 Sep 07, 2026What Determines Process Control Systems Pricing? A Buyer’s Cost GuideProcess control systems pricing explained: compare hardware, engineering, integration, cybersecurity, validation, and lifecycle costs to choose the right-value solution.Victor Lin (Chief Software Architect)
 Sep 07, 2026AMR Robots in ASEAN: Which Industries Are Adopting Them—and Why?AMR robots ASEAN adoption is accelerating in electronics, automotive, warehousing, healthcare, and cold chain. Explore use cases, risks, and deployment insights.Chen Wei (Automation Lead Engineer)
 Sep 05, 2026How to Evaluate Supplier Qualification Support Tools for Industrial Procurement TeamsSupplier qualification support tools help industrial procurement teams verify technical evidence, manage risk, and make defensible supplier approvals. Learn what to evaluate.Victor Lin (Chief Software Architect)
 Sep 04, 2026Grinding Tolerance Analysis: How to Set Realistic Limits for Precision PartsGrinding tolerance analysis explains how to set realistic limits for precision parts, balance fit, geometry, process capability, and inspection for reliable performance.Dr. Marcus Vance
 Sep 03, 2026Warehouse Automation Strategies to Increase Storage Capacity Without ExpansionWarehouse automation space saving strategies help unlock vertical capacity, optimize slotting, and improve storage density without costly building expansion.Victor Lin (Chief Software Architect)
 Sep 02, 2026What Should Buyers Evaluate When Choosing a Hybrid VTOL UAV Factory?Hybrid VTOL UAV factory selection guide: evaluate mission fit, production traceability, payload integration, support, and total ownership costs before procurement.Elena Rostova (UAV Systems Researcher)