Interpreting Industrial IoT Latency Data for Monitoring and Real-Time Control
Publication Date
author
Interpreting Industrial IoT Latency Data for Monitoring and Real-Time Control
A low average latency can hide the timing failures that make an Industrial IoT system unsuitable for real-time control. Interpreting industrial category latency data requires more than comparing headline figures: measurement boundaries, clock synchronization, jitter, tail latency, and deadline misses all shape the result. A gateway that performs well in a telemetry demonstration may still be the wrong place to close a control loop.
The practical question is not simply “How fast is it?” It is “Will sufficiently fresh data reach the right application, and will the resulting action occur before its deadline under the conditions we actually expect?” That distinction should drive both technical evaluation and procurement specifications.
Monitoring and control need different kinds of evidence
Consider a condition-monitoring gateway collecting bearing vibration data. Its local acquisition must preserve the signal characteristics needed for analysis, but uploading a calculated health indicator to a maintenance dashboard can often tolerate buffering. The important requirements may be timestamp integrity, completeness, and a defined maximum reporting delay—not immediate delivery of every raw sample.
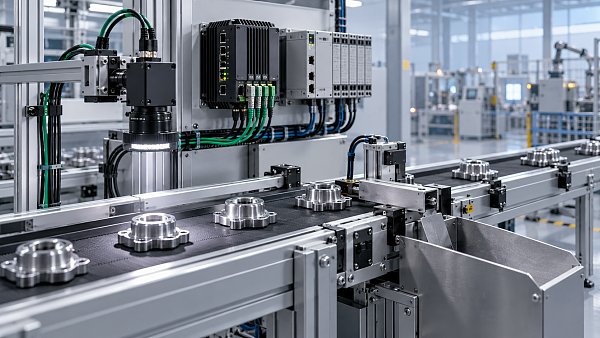
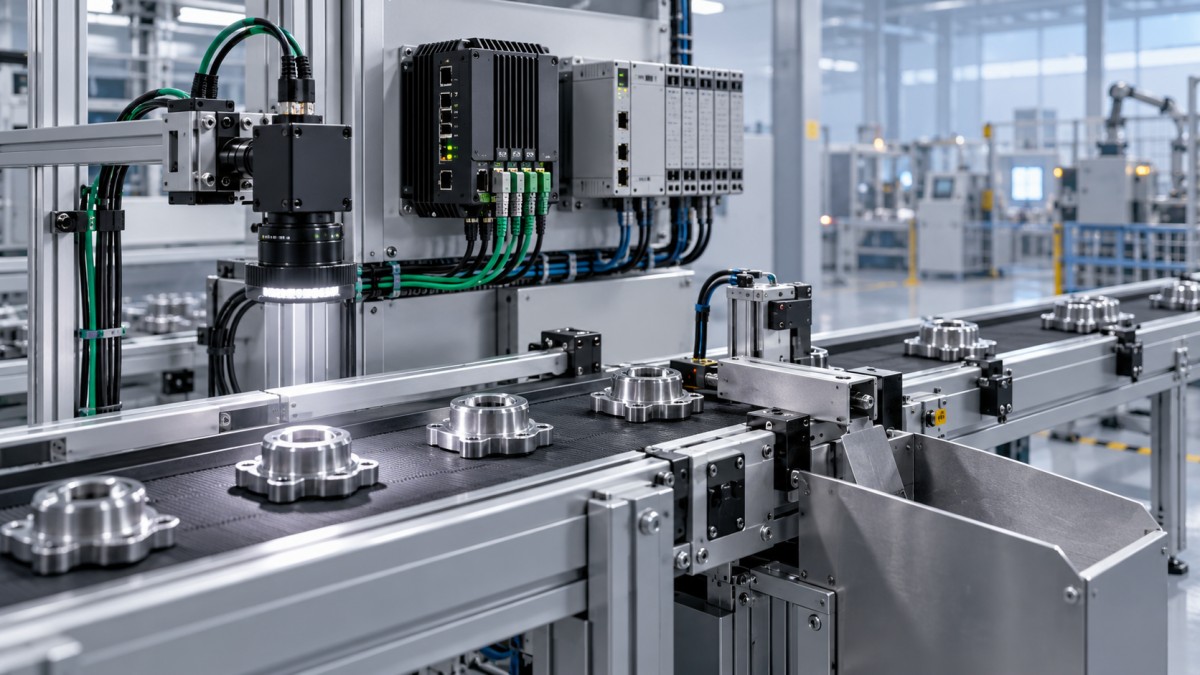
Now consider an inspection system that triggers a reject mechanism on a moving conveyor. A classification arriving after the part has passed the actuator is no longer useful. Image exposure, inference, network transport, controller scheduling, and actuator response all consume the available time. Fast Ethernet forwarding alone does not establish that the application will work.
Even within control, requirements differ. A supervisory setpoint update is not equivalent to a coordinated motion loop. Hard real-time operation requires deadlines to be satisfied under defined operating assumptions; a favorable percentile from a short benchmark is not proof of that guarantee. Safety-related functions also need their own safety assessment. Low latency does not establish functional safety.
Define exactly where the stopwatch starts and stops
A latency number without measurement boundaries is incomplete. “Gateway latency” might describe packet forwarding between interfaces, protocol conversion, or delivery from a sensor interface to an application callback. Those measurements answer different questions.
For monitoring, a useful boundary often runs from sample acquisition to availability in the consuming application. For closed-loop evaluation, extend it to the commanded physical response where that response determines success. Record intermediate timestamps where possible so delays can be attributed rather than guessed.
A practical timing path includes sensor acquisition and filtering, source-side buffering, uplink transport, gateway processing, application scheduling, decision execution, downlink delivery, and actuator response. Some stages overlap; others are strictly sequential. Build the budget around the actual implementation rather than blindly adding vendor specifications.
Sampling phase deserves particular attention. A physical change occurring just after a periodic sample may wait almost one sampling interval before acquisition begins. A benchmark starting at packet transmission excludes that wait. Likewise, a timestamp created after batch assembly can make old measurements appear newly generated.
Round-trip time is useful for diagnostics, but dividing it by two does not establish one-way latency when routes, queues, or processing differ by direction. Ask whether acknowledgments represent packet receipt, application processing, or completed action.
Clock uncertainty can overwhelm the result
One-way measurements across devices require a known relationship between their clocks. IEEE 1588 Precision Time Protocol can support precise synchronization, but its presence in a datasheet does not establish the achieved accuracy. Hardware timestamping, network asymmetry, clock configuration, and synchronization loss all affect the result.
Request the timestamp locations and measured clock-offset uncertainty during the test. If synchronization uncertainty is comparable to the reported delay, the result cannot support a fine-grained comparison. Hardware timestamps near the network interface can isolate transport behavior, while application timestamps include software delays; neither substitutes for the other.
Read the distribution, then inspect the failures
Mean latency describes central behavior, not deadline reliability. Median latency helps establish the normal operating point. Higher percentiles expose the slower portion of the distribution, while the maximum identifies the worst event observed in that particular test—not a guaranteed upper bound.
For deadline-sensitive applications, request the following alongside the histogram:
- Deadline-miss ratio: the proportion of required updates that fail to become usable before the specified deadline.
- Loss and rejection counts: including missing, duplicate, out-of-order, and expired messages.
- Consecutive misses: because a burst of failures may be more damaging than isolated late updates.
- Recovery time: how long valid, timely delivery takes to resume after a disturbance.
- Sample count and duration: needed to judge how much evidence supports the reported tail.
Define jitter explicitly. Vendors may use that term for latency standard deviation, peak-to-peak variation, or variation in packet arrival intervals. Comparing those values directly is misleading. For periodic control, arrival-time deviation relative to the expected schedule may be more actionable than a single summary statistic.
A subtle reporting problem occurs when lost messages disappear from the latency calculation. The remaining deliveries may look impressively fast even as service deteriorates. Deadline accounting should include every expected update, not only successful responses.
Also inspect latency over time. A histogram can hide bursts caused by reconnects or periodic background tasks. Zero misses in a finite run does not prove zero risk, and high-percentile estimates need enough observations to be meaningful. Correlated failures further limit conclusions drawn from simple independent-event assumptions.
Test the configuration you intend to deploy
An idle-network benchmark is useful for finding the baseline. It is weak evidence for production acceptance. Gateway timing changes when protocol translation, encryption, local analytics, logging, and store-and-forward queues compete for CPU time and memory.
Specify payload sizes, message rates, connected-device counts, directionality, and traffic patterns. Average bandwidth alone is insufficient: synchronized sensor publishing can create queue bursts even when link utilization looks modest over a longer interval. Record firmware, operating-system settings, processor power modes, and thermal conditions so the test can be repeated.
The most revealing disturbance tests usually follow the architecture. Interrupt the upstream connection if buffering is enabled. Exercise broker reconnection if messaging depends on a broker. Introduce competing traffic where links are shared. For wireless segments, evaluate representative interference and mobility conditions rather than treating a clean bench result as a coverage guarantee.
Watch what happens after connectivity returns. A gateway draining historical telemetry can delay current measurements unless traffic classes and queue policies prevent it. Reliable delivery of stale data is useful for records, but it does not restore real-time control.
Protocol and standards claims need a narrower reading
MQTT quality-of-service levels describe delivery semantics, not bounded end-to-end timing. Retransmissions and acknowledgment exchanges can change latency, while broker queues and subscriber scheduling remain part of the application path. Select delivery behavior according to whether loss, duplication, or lateness is most harmful.
OPC UA also covers different communication models. A client-server exchange and a PubSub deployment should not be treated as equivalent timing architectures. Transport selection, security configuration, implementation, and operating-system scheduling still need evaluation.
IEEE 802.1 Time-Sensitive Networking mechanisms can help engineer bounded behavior within an appropriately configured network. They do not automatically bound sensor processing, gateway software, or actuator response. Ask which mechanisms are implemented, how traffic is admitted and scheduled, and which network assumptions underpin any timing claim.
The distinction matters in supplier comparisons: protocol support establishes capability, while a documented configuration and test establish evidence for a particular use.
Turn the measurements into an acceptance specification
Start with the process deadline and work backward. As an illustrative budget—not a recommended universal limit—suppose a sensing-to-action deadline is 10 milliseconds. If acquisition, computation, and actuation together consume 6 milliseconds under the defined conditions, transport and remaining scheduling must fit within the balance, with uncertainty and engineering margin accounted for. A 3-millisecond average network delay would not, by itself, demonstrate compliance.
An acceptance specification should identify the start and end events, timestamp method, allowable measurement uncertainty, operating envelope, and required deadline behavior. It should also define test duration, disturbance scenarios, loss accounting, and the response to stale data. Separate normal-operation acceptance from degraded-mode requirements instead of blending both into one percentile.
Specify what the application does when the deadline cannot be met: discard an expired command, hold a previous value where permitted, enter a defined fallback mode, or transfer responsibility to a local controller. The right behavior depends on process dynamics and hazard analysis. It should not be left to a messaging library’s default queue policy.
This is where TechStat Vanguard’s data-driven benchmarking approach is most useful: separating measured capability from assumptions and unsupported claims. A defensible comparison retains raw timing traces, configuration details, and test limitations—not merely a ranking by average latency.
If a supplier cannot explain timestamp boundaries, losses, and behavior under load, treat its latency figure as preliminary. Keep tightly constrained control local unless the complete proposed path has adequate evidence. Use broader connectivity for the monitoring and supervisory functions it can demonstrably support, then test the remaining timing risks before committing the architecture.
Search News
Hot Articles
- Carbon Fiber StructuresHow to Specify Aerospace Carbon Fiber Assemblies for Lightweight, Load-Bearing PartsJul 11, 2026
- Machine VisionXiaomi, Alibaba DAMO Academy Drive Open-Source Robotics Model Ecosystem, Lowering Algorithm Development Barriers for Overseas SMEs Adopting Chinese Robotics SolutionsMar 30, 2026
- Cobots & ArmsShanxi 'AI+' Conference Showcases Embodied Intelligence with Multinational Buyer Engagement: Key Industry ImplicationsMar 30, 2026
Popular Tags
Recommended News
 Jul 11, 2026How to Specify Aerospace Carbon Fiber Assemblies for Lightweight, Load-Bearing PartsAerospace carbon fiber assemblies: learn how to specify laminate design, load data, joining methods, and inspection controls for lighter, reliable load-bearing aerospace parts.Elena Rostova (UAV Systems Researcher)
 Mar 30, 2026Xiaomi, Alibaba DAMO Academy Drive Open-Source Robotics Model Ecosystem, Lowering Algorithm Development Barriers for Overseas SMEs Adopting Chinese Robotics SolutionsXiaomi & Alibaba DAMO Academy's open-source robotics models lower algorithm barriers for global SMEs. Boost efficiency in manufacturing, logistics & smart retail with ROS 2 compatible solutions.TSV Data Lab
 Mar 30, 2026Shanxi 'AI+' Conference Showcases Embodied Intelligence with Multinational Buyer Engagement: Key Industry ImplicationsShanxi 'AI+' Conference highlights embodied intelligence with Tesla, Ubtech & Jiantao showcasing multimodal robotics. 40+ global buyers validated tech on-site, creating new B2B channels for industrial automation & AI solutions.Chen Wei (Automation Lead Engineer)
 Mar 30, 2026Zhongguancun Unveils 6G Integrated Sensing-Computing-Intelligence Platform to Empower Embodied Robots for Global Industrial ApplicationsZhongguancun's new 6G platform revolutionizes industrial robotics with <10ms latency, empowering global automotive, logistics & port automation. Discover how this tech boosts China's smart manufacturing exports.TSV Data Lab
 Mar 30, 2026Mech-Mind Tianjin Embodied Intelligence R&D and Production Base Goes Live, Cutting Delivery Time by 20%–30% for Global Customized AMR+Vision SolutionsMech-Mind's Tianjin AMR+Vision production base cuts delivery time by 20%-30% for欧美 & Latin American markets. Discover how this PLd-certified facility accelerates customized robotics solutions for smart manufacturing and logistics.Chen Wei (Automation Lead Engineer)
 Mar 30, 2026Boao Forum Reveals 'Co-evolution of Big and Small Brains' Trend in Humanoid Robots, China's Embodied Intelligence Accelerates Adaptation to Overseas Manufacturing Service ScenariosDiscover how China's humanoid robots, featuring 'Co-evolution of Big and Small Brains,' are revolutionizing global manufacturing. Learn about Embodied Tian Gong 3.0's ISO compliance and overseas deployment at Boao Forum 2026.Chen Wei (Automation Lead Engineer)
 Mar 30, 2026China Railway Industrial Secures Patent for Embodied Robotics in Material Handling, Boosting High-Precision Delivery Capabilities for Overseas Infrastructure and Manufacturing ProjectsChina Railway Industrial's new patent for embodied robotics in material handling boosts high-precision delivery for global infrastructure & manufacturing. Discover how this innovation enhances logistics accuracy in automotive, rail transit & EPC projects.Chen Wei (Automation Lead Engineer)
 Oct 28, 2026Interpreting Industrial IoT Latency Data for Monitoring and Real-Time ControlInterpret industrial category latency data to assess jitter, deadline misses, and real-time readiness. Learn how to benchmark IIoT systems and choose monitoring and control solutions.TSV Data Lab
 Oct 27, 2026GXO and Agility Robotics Expand Partnership to Accelerate US Humanoid Robot DeploymentGXO and Agility Robotics plan to expand US humanoid robot deployment with Digit 4 in early 2027. Explore warehouse automation plans, service terms and future Digit 5 upgrades.Chen Wei (Automation Lead Engineer)
 Oct 27, 2026Robotic Automation Costs: Budgeting for Equipment, Integration, and MaintenancePlan your robotics automation cost with confidence. Explore equipment, integration, and maintenance expenses, compare quotes, and build a realistic budget for better ROI.Chen Wei (Automation Lead Engineer)
 Oct 26, 2026AMAXiMAL Releases Open-Source TopMod 3D v3 With Claude AIExplore AMAXiMAL’s free, open-source TopMod 3D v3 with Claude AI assistance, topology-based modeling and plywood fabrication tools that connect complex designs to physical builds.Dr. Marcus Vance
 Oct 26, 2026Choosing a SCADA System Integrator Company: PLC Compatibility and Long-Term SupportChoose a scada system integrator company with proven PLC compatibility and reliable long-term support. Discover what to test, compare, and require before investing.Victor Lin (Chief Software Architect)
 Oct 25, 2026Hesai Leads Global ADAS Main Lidar Shipments in Yole’s 2026 ReportHesai led global ADAS main lidar shipments with a 43% share in 2025, according to Yole’s 2026 report. Explore what this ranking reveals about its automotive market position.TSV Data Lab
 Oct 25, 2026Choosing an Aerospace Materials Manufacturer: Quality and Traceability ChecksChoosing an aerospace materials manufacturer? Learn how to verify certifications, test reports, and lot traceability to qualify suppliers confidently and reduce costly sourcing risks.Dr. Marcus Vance
 Oct 24, 2026Guotai Haitong: Global Entry-Level 3D Printer Shipments Rose 39% in Q1 2026Entry-level 3D printer shipments rose 39% in Q1 2026, Guotai Haitong reports. Explore how AI, multicolor printing and print farms are shaping market growth.Dr. Marcus Vance
 Oct 24, 2026Choosing an Industrial Vision Inspection Supplier: Acceptance Tests That MatterChoose an industrial vision inspection supplier with confidence. Discover acceptance tests for defect detection, false rejects, production speed, and reliable part rejection before you buy.TSV Data Lab
 Oct 23, 2026US Navy Raises Gecko Robotics Contract Ceiling to $300M for Robotic Fleet MaintenanceUS Navy raises Gecko Robotics’ contract ceiling to $300M for Pacific Fleet robotic inspections. Explore potential opportunities for maintenance suppliers and key procurement considerations.Chen Wei (Automation Lead Engineer)
 Oct 23, 2026Choosing Industrial Sensing Systems for Global Plants: Protocol CompatibilityCompare industrial sensing systems international buyers can trust. Explore protocol compatibility, reduce integration risks, and select proven configurations for reliable global plant deployments.TSV Data Lab
 Oct 22, 2026KUKA Showcases Physical AI and iiQKA.AI Vision at NVIDIA GTC BerlinExplore KUKA’s Physical AI showcase at NVIDIA GTC Berlin and discover how iiQKA.AI Vision aims to simplify robotic vision integration and improve 2D and 3D scene recognition.TSV Data Lab
 Oct 22, 2026Robotic Machining of Advanced Composites: What Tolerances Are Achievable?Explore advanced materials machining robotics: discover what drives achievable composite tolerances and how to validate accuracy before investing in your next machining system.Dr. Marcus Vance
 Oct 21, 2026China’s Industrial Robot Exports Near RMB 10 Billion in First Nine Months of 2026China’s industrial robot exports neared RMB 10 billion in January–September 2026, with value rising faster than volume. Explore the data and what it could mean for suppliers.Chen Wei (Automation Lead Engineer)
 Oct 21, 2026Low-Latency Industrial Data Processing: Pricing and Key Cost DriversExplore industrial data latency price drivers, from edge hardware to integration and support. Learn how to compare quotes, verify performance, and avoid unnecessary costs.TSV Data Lab
 Oct 20, 2026KUKA Launches iiQKA.AI Vision to Simplify Industrial Image ProcessingKUKA iiQKA.AI Vision simplifies industrial image processing with controller-based 2D and 3D vision. Explore drag-and-drop setup for vision-guided automation.TSV Data Lab
 Oct 20, 2026Smart Industrial Edge Devices: Key Criteria for Legacy PLC IntegrationChoose smart industrial edge devices for legacy PLC integration. Discover key criteria for compatibility, data quality, security, and reliable collection without disrupting control.TSV Data Lab