Drone Thermal Camera Resolution Comparison: What Pixel Count Is Enough for Inspection?
Publication Date
author
In any drone thermal camera resolution comparison, the headline number is only the starting point. Inspection quality depends on whether each thermal pixel still represents meaningful surface detail at actual flight height, viewing angle, and target size.
That is why pixel count matters far beyond marketing language. In roof diagnostics, utility patrol, solar field review, and industrial maintenance, resolution influences defect visibility, sortie planning, and the confidence of every temperature-based report.
From the perspective of TechStat Vanguard, this is a classic engineering filter problem. Parameters do not lie, but isolated parameters can still mislead when they are detached from distance, optics, thermal sensitivity, and inspection workflow.
Why resolution has become a serious inspection variable
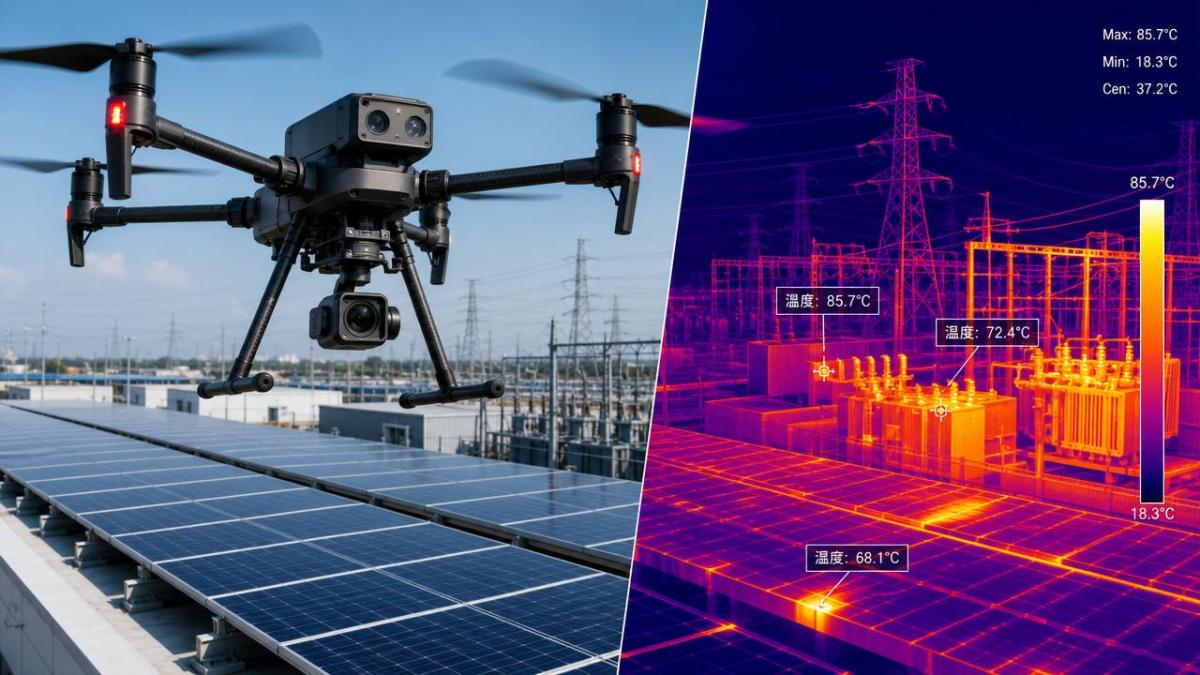
Drone-based thermography has moved from niche use into routine asset evaluation. The shift is visible across construction, energy, aerospace support, public infrastructure, and advanced manufacturing quality control.
At the same time, procurement decisions face the same noise problem seen across hard-tech sectors. Spec sheets often highlight detector size while giving less attention to lens pairing, radiometric output, or the minimum detectable defect size.
A useful drone thermal camera resolution comparison should answer one practical question: how many pixels are needed to separate a fault signature from background temperature variation at working distance?
That answer changes by application. A broad roof moisture scan does not demand the same thermal sampling density as a substation connector check or a cracked refractory inspection.
What thermal resolution really means in the field
Thermal resolution refers to the number of pixels in the sensor array, such as 160×120, 320×256, 640×512, or higher. More pixels generally mean more spatial detail, but that detail is only useful if the optics and flight profile preserve it.
In practice, each pixel covers a physical area on the target. As altitude increases, that area becomes larger. A hotspot that fills six pixels at short range may occupy less than one pixel at a safer or more efficient stand-off distance.
This is where many purchase errors begin. Teams compare raw detector counts without checking ground sample distance, instantaneous field of view, and the size of the anomaly they actually need to confirm.
A balanced drone thermal camera resolution comparison therefore includes four linked variables:
- sensor pixel count and aspect ratio;
- lens field of view and focal length;
- inspection distance and required safety offset;
- minimum defect size that must be detected, not just imaged.
When low, mid, and high pixel counts are enough
There is no universal threshold, but broad resolution bands are useful for planning. The key is to link them with the scale of the target and the consequence of a missed anomaly.
Entry-level arrays
160×120 or similar arrays can support general awareness tasks. They may be acceptable for large-area heat mapping, basic building envelope review, or educational operations.
They become limiting when defects are small, irregular, or partially obscured. Report quality also drops faster when digital zoom is required.
Mid-range arrays
320×256 is often the practical minimum for professional inspection. It usually offers a workable balance between payload cost, image usability, file size, and mission flexibility.
For many roof, solar, façade, and general industrial surveys, this range can be enough if flight altitude stays disciplined and the anomaly is not sub-centimeter in scale.
High-resolution arrays
640×512 and above are preferable when defects are smaller, access is constrained, or stand-off distance must increase. They also improve framing flexibility during post-analysis.
This tier becomes especially valuable in utility work, elevated structures, petrochemical assets, and complex industrial systems where revisits are expensive or risky.
Inspection scenarios where pixel count changes the outcome
The value of any drone thermal camera resolution comparison becomes clearer when tied to actual use cases. Not all inspections fail in the same way, and not all false negatives come from the same technical gap.
Roof and building envelope surveys
Large wet insulation zones can often be detected with mid-range resolution. Trouble begins when the mission also needs to distinguish seam defects, edge leakage paths, or mixed materials with similar temperatures.
Solar PV inspection
Module hotspots are usually visible with 320×256 under controlled flight parameters. However, dense arrays, reflective conditions, and the need for faster coverage often justify 640×512 or better.
Powerline and substation work
This category often demands higher thermal resolution because targets are smaller and access offsets are stricter. Connectors, insulators, and bus components may need clear separation from hotter or cooler surroundings.
Industrial process assets
Stacks, vessels, refractory linings, motors, and piping networks can involve mixed geometry and uneven emissivity. Higher resolution helps isolate temperature boundaries before maintenance teams commit to shutdown decisions.
Why resolution alone does not guarantee reliable data
A strong drone thermal camera resolution comparison should never end at pixel count. Thermal sensitivity, calibration stability, lens quality, and radiometric integrity often decide whether a thermal image supports engineering action or only visual impression.
Noise equivalent temperature difference matters because a higher-resolution sensor with poor sensitivity may still blur low-contrast anomalies. Likewise, poor optics can waste the advantage of a larger array.
Environmental factors also matter more than many teams expect. Wind, moisture, solar loading, reflection, and angle of incidence can distort readings enough to erase the benefit of extra pixels.
This is where TSV’s data-first perspective becomes useful. A thermal payload should be judged as a measurement system, not as an isolated sensor specification.
A practical framework for deciding what is enough
Instead of asking for the highest available detector count, define the inspection task backward from the reporting requirement. The goal is to identify the minimum configuration that still protects detection confidence.
- Define the smallest defect that must be detected, not merely suspected.
- Set the expected stand-off distance based on safety, regulations, and asset access.
- Check lens options before comparing sensor arrays.
- Review whether the workflow needs radiometric analysis, digital zoom, or automated anomaly classification.
- Estimate the cost of a missed defect versus the cost of a higher-resolution payload.
Usually, “enough” means the system can detect the target anomaly with repeatable confidence across real operating conditions, not ideal lab conditions.
What to compare before a final specification decision
For many organizations, the most expensive mistake is buying more resolution than the mission needs, or less resolution than future compliance and reporting standards will require.
A disciplined drone thermal camera resolution comparison should include these checks:
- compare pixel count against actual target size per flight altitude;
- request sample radiometric files, not only exported images;
- verify lens availability for both wide-area coverage and narrow-angle inspection;
- review mission duration, data storage burden, and processing time;
- test how the system performs under the temperature contrasts common to the asset class.
In many cases, 320×256 is enough for structured surveys with controlled altitude. Where access is difficult, anomalies are small, or evidence quality must withstand scrutiny, 640×512 becomes the safer baseline.
The next step is not to chase the largest number on a brochure. It is to map defect size, stand-off distance, optics, and reporting needs into a specification standard that can be defended with data.
That approach fits the broader TSV principle: remove marketing noise, compare measurable parameters, and let engineering truth define what pixel count is truly enough for inspection.
Search News
Hot Articles
- Carbon Fiber StructuresHow to Specify Aerospace Carbon Fiber Assemblies for Lightweight, Load-Bearing PartsJul 11, 2026
- Machine VisionXiaomi, Alibaba DAMO Academy Drive Open-Source Robotics Model Ecosystem, Lowering Algorithm Development Barriers for Overseas SMEs Adopting Chinese Robotics SolutionsMar 30, 2026
- Cobots & ArmsShanxi 'AI+' Conference Showcases Embodied Intelligence with Multinational Buyer Engagement: Key Industry ImplicationsMar 30, 2026
Popular Tags
Recommended News
 Jul 11, 2026How to Specify Aerospace Carbon Fiber Assemblies for Lightweight, Load-Bearing PartsAerospace carbon fiber assemblies: learn how to specify laminate design, load data, joining methods, and inspection controls for lighter, reliable load-bearing aerospace parts.Elena Rostova (UAV Systems Researcher)
 Mar 30, 2026Xiaomi, Alibaba DAMO Academy Drive Open-Source Robotics Model Ecosystem, Lowering Algorithm Development Barriers for Overseas SMEs Adopting Chinese Robotics SolutionsXiaomi & Alibaba DAMO Academy's open-source robotics models lower algorithm barriers for global SMEs. Boost efficiency in manufacturing, logistics & smart retail with ROS 2 compatible solutions.TSV Data Lab
 Mar 30, 2026Shanxi 'AI+' Conference Showcases Embodied Intelligence with Multinational Buyer Engagement: Key Industry ImplicationsShanxi 'AI+' Conference highlights embodied intelligence with Tesla, Ubtech & Jiantao showcasing multimodal robotics. 40+ global buyers validated tech on-site, creating new B2B channels for industrial automation & AI solutions.Chen Wei (Automation Lead Engineer)
 Mar 30, 2026Zhongguancun Unveils 6G Integrated Sensing-Computing-Intelligence Platform to Empower Embodied Robots for Global Industrial ApplicationsZhongguancun's new 6G platform revolutionizes industrial robotics with <10ms latency, empowering global automotive, logistics & port automation. Discover how this tech boosts China's smart manufacturing exports.TSV Data Lab
 Mar 30, 2026Mech-Mind Tianjin Embodied Intelligence R&D and Production Base Goes Live, Cutting Delivery Time by 20%–30% for Global Customized AMR+Vision SolutionsMech-Mind's Tianjin AMR+Vision production base cuts delivery time by 20%-30% for欧美 & Latin American markets. Discover how this PLd-certified facility accelerates customized robotics solutions for smart manufacturing and logistics.Chen Wei (Automation Lead Engineer)
 Mar 30, 2026Boao Forum Reveals 'Co-evolution of Big and Small Brains' Trend in Humanoid Robots, China's Embodied Intelligence Accelerates Adaptation to Overseas Manufacturing Service ScenariosDiscover how China's humanoid robots, featuring 'Co-evolution of Big and Small Brains,' are revolutionizing global manufacturing. Learn about Embodied Tian Gong 3.0's ISO compliance and overseas deployment at Boao Forum 2026.Chen Wei (Automation Lead Engineer)
 Mar 30, 2026China Railway Industrial Secures Patent for Embodied Robotics in Material Handling, Boosting High-Precision Delivery Capabilities for Overseas Infrastructure and Manufacturing ProjectsChina Railway Industrial's new patent for embodied robotics in material handling boosts high-precision delivery for global infrastructure & manufacturing. Discover how this innovation enhances logistics accuracy in automotive, rail transit & EPC projects.Chen Wei (Automation Lead Engineer)
 Oct 25, 2026Hesai Leads Global ADAS Main Lidar Shipments in Yole’s 2026 ReportHesai led global ADAS main lidar shipments with a 43% share in 2025, according to Yole’s 2026 report. Explore what this ranking reveals about its automotive market position.TSV Data Lab
 Oct 25, 2026Choosing an Aerospace Materials Manufacturer: Quality and Traceability ChecksChoosing an aerospace materials manufacturer? Learn how to verify certifications, test reports, and lot traceability to qualify suppliers confidently and reduce costly sourcing risks.Dr. Marcus Vance
 Oct 24, 2026Guotai Haitong: Global Entry-Level 3D Printer Shipments Rose 39% in Q1 2026Entry-level 3D printer shipments rose 39% in Q1 2026, Guotai Haitong reports. Explore how AI, multicolor printing and print farms are shaping market growth.Dr. Marcus Vance
 Oct 24, 2026Choosing an Industrial Vision Inspection Supplier: Acceptance Tests That MatterChoose an industrial vision inspection supplier with confidence. Discover acceptance tests for defect detection, false rejects, production speed, and reliable part rejection before you buy.TSV Data Lab
 Oct 23, 2026US Navy Raises Gecko Robotics Contract Ceiling to $300M for Robotic Fleet MaintenanceUS Navy raises Gecko Robotics’ contract ceiling to $300M for Pacific Fleet robotic inspections. Explore potential opportunities for maintenance suppliers and key procurement considerations.Chen Wei (Automation Lead Engineer)
 Oct 23, 2026Choosing Industrial Sensing Systems for Global Plants: Protocol CompatibilityCompare industrial sensing systems international buyers can trust. Explore protocol compatibility, reduce integration risks, and select proven configurations for reliable global plant deployments.TSV Data Lab
 Oct 22, 2026KUKA Showcases Physical AI and iiQKA.AI Vision at NVIDIA GTC BerlinExplore KUKA’s Physical AI showcase at NVIDIA GTC Berlin and discover how iiQKA.AI Vision aims to simplify robotic vision integration and improve 2D and 3D scene recognition.TSV Data Lab
 Oct 22, 2026Robotic Machining of Advanced Composites: What Tolerances Are Achievable?Explore advanced materials machining robotics: discover what drives achievable composite tolerances and how to validate accuracy before investing in your next machining system.Dr. Marcus Vance
 Oct 21, 2026China’s Industrial Robot Exports Near RMB 10 Billion in First Nine Months of 2026China’s industrial robot exports neared RMB 10 billion in January–September 2026, with value rising faster than volume. Explore the data and what it could mean for suppliers.Chen Wei (Automation Lead Engineer)
 Oct 21, 2026Low-Latency Industrial Data Processing: Pricing and Key Cost DriversExplore industrial data latency price drivers, from edge hardware to integration and support. Learn how to compare quotes, verify performance, and avoid unnecessary costs.TSV Data Lab
 Oct 20, 2026KUKA Launches iiQKA.AI Vision to Simplify Industrial Image ProcessingKUKA iiQKA.AI Vision simplifies industrial image processing with controller-based 2D and 3D vision. Explore drag-and-drop setup for vision-guided automation.TSV Data Lab
 Oct 20, 2026Smart Industrial Edge Devices: Key Criteria for Legacy PLC IntegrationChoose smart industrial edge devices for legacy PLC integration. Discover key criteria for compatibility, data quality, security, and reliable collection without disrupting control.TSV Data Lab
 Oct 19, 2026Choosing a Radar Sensor by Application: Range, Resolution, and Field of ViewSimplify radar sensor application based product selection. Compare range, resolution, and field of view to avoid blind spots and choose with confidence. Explore the guide.TSV Data Lab
 Oct 18, 2026Comparing Material Options for Procurement: Specs, Costs, and Supply RisksExplore procurement oriented technical content on material options, specs, costs, and supply risks. Compare alternatives to cut hidden expenses and make confident sourcing decisions.Dr. Marcus Vance
 Oct 17, 20265-Axis CNC Positioning Accuracy: How to Interpret ISO 230-2 Test ResultsAssess 5 axis CNC machining positioning accuracy with ISO 230-2. Learn to interpret repeatability, reversal error, and test conditions to compare suppliers and make confident acceptance decisions.Dr. Marcus Vance
 Oct 16, 2026Choosing a Rugged Edge AI Box Supplier: Thermal Tests and Lifecycle SupportChoose a rugged edge AI box supplier with proven thermal performance and reliable lifecycle support. Discover the tests and commitments to verify before you buy.TSV Data Lab
 Oct 15, 2026R&D Cost Reduction Services: How to Evaluate Fees, Savings, and ROIEvaluate R&D cost reduction services with confidence. Compare fees, verify savings, and calculate ROI without compromising performance. Discover how to choose a provider that delivers real value.Chen Wei (Automation Lead Engineer)