High simulation accuracy can still miss real bottlenecks
Publication Date
author
High digital twin simulation accuracy can look convincing, yet still fail to reveal the real bottlenecks hidden in execution, control latency, and system coupling. For teams evaluating a digital twin for automotive assembly line, warehouse management system WMS integration, or MES integration with SAP ERP, the real question is not only model fidelity, but whether data exposes throughput loss, response delays, and operational constraints that affect procurement, engineering, and plant decisions.
In advanced manufacturing, a model can achieve 95% to 99% correlation with designed motion paths and still miss the 3% to 8% loss that actually determines output, scrap, and labor utilization. That gap matters because procurement teams buy based on projected ROI, operators live with cycle disruptions, and executives approve capital expenditure based on promised throughput. When the model looks clean but the plant remains unstable, the issue is rarely graphics or physics fidelity alone. It is usually a data problem.
This is where TechStat Vanguard (TSV) takes a different view. Engineering truth is not built on polished dashboards or generic claims about smart factories. It is built on measurable parameters: scan intervals, controller latency, queue accumulation, tolerance drift, packet loss, and handoff delays between systems. In other words, parameters do not lie, and tolerances still dictate success even in a digital environment.
For information researchers, plant users, procurement managers, and business decision-makers, the priority is not to ask whether a simulation is visually impressive. The priority is to ask whether it can reveal where 12 seconds are lost per cycle, why AGV dispatching stalls during shift changes, or how SAP ERP confirmation timing distorts MES reporting. Those are the bottlenecks that shape supplier choice, integration scope, and payback period.
Why high simulation accuracy does not guarantee operational truth
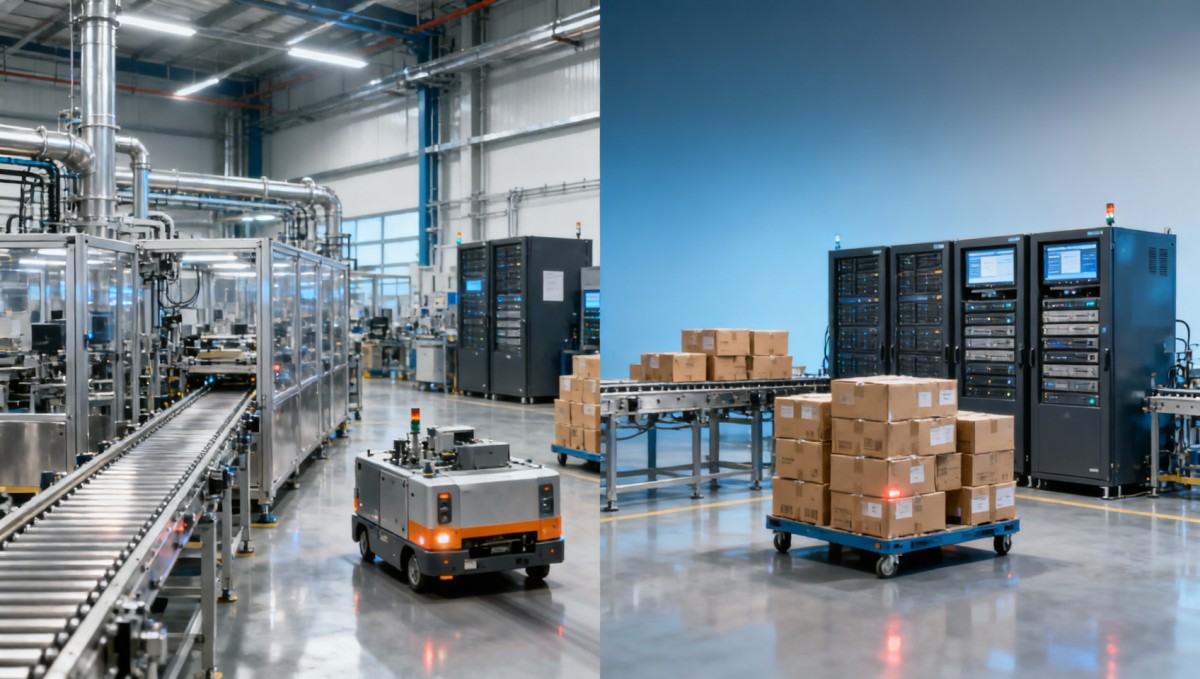
A digital twin can be mathematically accurate and operationally incomplete at the same time. Many projects focus on kinematics, equipment layout, or nominal cycle time under ideal conditions. That is useful in early design, but production losses often emerge from interactions between systems rather than the machine itself. A robot may complete a task in 18 seconds, yet the line output still drops because barcode verification adds 1.5 seconds, PLC acknowledgment takes 300 milliseconds, and a downstream buffer reaches saturation every 22 minutes.
This mismatch is common in automotive assembly lines, warehouse automation, and mixed discrete-process environments. A simulation may reproduce 97% of station motion accuracy, but if it does not include scan failure rates, network jitter above 20 milliseconds, or exception handling logic, it cannot explain actual bottlenecks. The plant then experiences hidden losses that are small in isolation and severe in accumulation.
TSV typically advises stakeholders to distinguish between three levels of model confidence. The first is geometry confidence, which verifies layout and motion. The second is process confidence, which tests sequence and resource allocation. The third is execution confidence, which captures timing variability, control delays, queue behavior, and system coupling. Most costly blind spots appear between level two and level three.
For procurement teams, the consequence is direct. If a vendor presents only high-fidelity visuals and nominal throughput, buyers may underestimate integration work by 15% to 30%. For operators, the risk shows up as unstable takt performance. For executives, it appears later as delayed ramp-up, change-order costs, and CAPEX that misses its expected 12- to 24-month return window.
The most common hidden bottleneck categories
The following categories are where highly accurate models still fail most often. They are not exotic edge cases. They are routine operational realities that only become visible when the twin is connected to real execution data, event logs, and control timestamps instead of design assumptions alone.
- Control latency: PLC, SCADA, edge gateway, and robot controller handshake delays that range from 50 milliseconds to 800 milliseconds.
- System coupling: MES, WMS, ERP, and equipment interfaces where one delayed acknowledgment blocks an entire sequence.
- Buffer dynamics: accumulation zones that appear adequate in design but overflow during 10- to 20-minute demand spikes.
- Exception handling: manual overrides, rework loops, and alarm recovery paths that are absent from nominal simulation logic.
- Data quality drift: sensor timestamp mismatch, missing tags, or inconsistent unit definitions that distort performance analytics.
A credible digital twin should therefore be judged on whether it identifies these effects early enough to influence engineering and sourcing decisions. If it cannot, the simulation may be accurate in appearance and still weak in procurement value.
Where real bottlenecks emerge in automotive, warehouse, and MES-ERP environments
Bottlenecks do not emerge in the same way across all industrial environments. In automotive assembly, line balance and station dependency dominate. In warehouse operations, dispatch logic, inventory confirmation timing, and congestion control matter more. In MES-SAP ERP integration, transaction timing, data ownership, and exception workflows usually determine whether the twin reflects reality or merely mirrors planned process logic.
On an automotive assembly line, a station with a 42-second nominal cycle can still drive line loss if actual micro-stoppages accumulate 4 to 6 minutes per shift. Those stoppages may come from torque validation retries, fixture confirmation lag, or pallet transfer waits that are each less than 2 seconds. A model that ignores these sub-cycle events will overstate throughput and understate intervention frequency.
In a warehouse management system integration, digital twin accuracy often collapses around decision logic. Travel routes may be modeled correctly, yet WMS release rules, replenishment priorities, and AGV/AMR congestion behavior create queue instability. A picking zone can show 180 lines per hour in simulation, but actual output falls to 145 when dispatch intervals exceed 5 seconds during peak order waves.
MES integration with SAP ERP introduces another class of bottleneck: asynchronous business events. Production confirmation, material consumption, lot tracking, and quality release can each operate on different time windows. If the twin assumes immediate synchronization while the plant experiences 30-second, 2-minute, or even batch-based posting delays, then reported OEE, WIP visibility, and order status become misleading for both operations and management.
Typical bottleneck patterns by scenario
The table below highlights typical patterns that often remain invisible in a high-fidelity but weakly instrumented digital twin.
The key takeaway is that bottlenecks are often temporal and relational rather than mechanical. A digital twin that does not capture event timing and cross-system dependency will struggle to support real procurement or process redesign decisions.
What engineering teams should validate first
- Confirm timestamp granularity. If event logs are only captured every 1 second, micro-delays under 500 milliseconds will disappear.
- Verify handoff logic between systems. Sequence accuracy matters more than visual animation in integration-heavy environments.
- Include exception states. At least the top 5 to 10 alarm and recovery paths should be modeled, not only normal production flow.
- Measure queue behavior under stress. Test 110% to 120% demand load, not only steady-state averages.
These validation steps are often more valuable than adding another layer of visual fidelity. They turn the twin into a decision tool rather than a design presentation.
How to evaluate a digital twin beyond model fidelity
A practical evaluation framework should connect engineering realism with buying criteria. Too many assessments stop at model granularity, rendering quality, or equipment library completeness. Those attributes matter, but they do not determine whether the twin can reduce trial-and-error cost, shorten supplier qualification cycles, or improve ramp-up stability. TSV recommends a four-layer review that connects data, execution, integration, and decision usability.
The first layer is data integrity. Can the platform ingest PLC tags, MES events, WMS transactions, and ERP timestamps with consistent definitions? Even a 1% to 2% missing-event rate can distort bottleneck analysis if the missing data occurs during alarms, shift changes, or maintenance windows. Data completeness and timestamp alignment are therefore baseline requirements, not optional enhancements.
The second layer is temporal realism. A credible twin must model not only average cycle time but variability bands such as 18 to 22 seconds, packet delay ranges such as 10 to 80 milliseconds, and operator response distributions such as 3 to 12 seconds. Real factories do not run at a single number. They run inside a range, and bottlenecks emerge at the edges of that range.
The third layer is cross-system logic. If WMS, MES, SCADA, quality systems, and SAP ERP do not share consistent state transitions, the twin may report throughput that the business process cannot actually support. The fourth layer is decision usability. Can procurement compare suppliers? Can operations identify the top three causes of loss? Can management test a 6-month investment scenario without waiting for a full pilot line?
Decision criteria for buyers and plant teams
The following evaluation matrix helps align technical review with business impact.
This type of evaluation helps decision-makers filter out solutions that are technically polished but operationally weak. It also supports supplier comparison on measurable criteria rather than marketing language.
Four procurement mistakes to avoid
- Buying a twin for visualization only, without a requirement for event-level bottleneck detection.
- Accepting average cycle-time claims without stress-testing variability, alarms, and changeover states.
- Ignoring data governance, especially tag naming, timestamp ownership, and source-system hierarchy.
- Separating IT integration scope from operations scope, which hides the true cost and timeline of deployment.
In most industrial environments, the twin is only as reliable as the discipline of its data model and the completeness of its exception logic. Buyers who understand this tend to reach stable results faster and with fewer costly revisions.
Implementation methods that expose bottlenecks before capital is committed
A digital twin should be implemented in stages that mirror operational risk. Starting too broad often produces dashboards without decisions. Starting too narrow may validate a single machine while missing line-level or enterprise-level constraints. A practical approach is to structure deployment into three phases over roughly 8 to 16 weeks for a pilot scope: baseline mapping, execution validation, and decision simulation.
In the baseline phase, teams map process flow, control architecture, system interfaces, and core KPI definitions. Typical outputs include a station map, event dictionary, and bottleneck hypothesis list. This phase usually takes 2 to 4 weeks depending on the number of systems involved. The main goal is not to model everything, but to identify the 20% of process points likely causing 80% of flow disruption.
In the execution validation phase, live or historical data is synchronized with the model. This is where timestamp quality, delay distributions, and exception logic are calibrated. Teams should test at least 3 operating modes: normal production, peak load, and disturbed state such as changeover or intermittent communication delay. Without this phase, high simulation accuracy remains a design assumption rather than an engineering proof.
The final phase is decision simulation. Here the twin is used to compare alternatives such as adding one buffer, changing dispatch rules, adjusting batch size, or modifying MES-SAP confirmation timing. The output should be operationally actionable: predicted throughput gain, reduced queue time, shorter supplier qualification cycle, or lower manual intervention frequency. If the project cannot answer a business decision within 90 days, the scope is likely too vague.
A staged rollout model for industrial teams
The phased structure below is useful for plants, OEMs, and enterprise transformation teams that need measurable progress without overspending early.
This phased method is especially valuable for procurement and executive stakeholders because it ties software scope to operational proof. Instead of funding a broad digitalization initiative based on promise, the organization sees whether the twin can expose measurable losses and support priority decisions.
FAQ for selection and rollout
How much accuracy is enough before a digital twin becomes useful?
Usefulness begins when the model can explain real loss mechanisms, not when it reaches a visual or geometric threshold. For fast automated lines, event timing under 500 milliseconds and calibration against at least 2 to 4 weeks of operating data are often more valuable than another 1% of motion fidelity.
What data should a buyer request during vendor evaluation?
Ask for supported data sources, timestamp resolution, exception coverage, integration methods, and sample KPI outputs. Buyers should also request evidence that the platform can compare nominal cycle time with actual queue time, alarm recovery time, and transaction lag across at least 3 connected systems.
When does MES integration with SAP ERP become the main bottleneck?
It becomes critical when business confirmation timing drives physical flow decisions. If order release, material posting, quality disposition, or lot closure have delays of 30 seconds to several minutes, the twin must model those timing gaps or it will misrepresent WIP, schedule adherence, and resource availability.
Is a pilot always necessary?
For most industrial use cases, yes. A focused pilot on one line, one cell, or one warehouse zone over 8 to 12 weeks helps validate data quality, integration difficulty, and bottleneck visibility before enterprise rollout. This reduces qualification risk and provides a more reliable basis for CAPEX approval.
High simulation accuracy is valuable, but it is not the finish line. The real test is whether a digital twin can uncover execution latency, system coupling, buffer instability, and transactional delays before those issues become expensive realities on the plant floor. For engineering teams, that means instrumenting the model with event-level truth. For procurement, it means evaluating vendors on measurable decision value rather than visual polish. For executives, it means funding systems that shorten ramp-up, reduce trial-and-error cost, and improve operational confidence.
TechStat Vanguard approaches this challenge with a strict data-first mindset: strip away marketing language, benchmark what matters, and focus on the parameters that determine throughput, tolerance, and reliability. If your team is evaluating a digital twin for automotive assembly, WMS integration, or MES-SAP ERP connectivity, now is the right time to validate what the model actually reveals. Contact us to discuss your use case, request a tailored evaluation framework, or explore a more rigorous path to engineering truth through data.
Search News
Hot Articles
- Carbon Fiber StructuresHow to Specify Aerospace Carbon Fiber Assemblies for Lightweight, Load-Bearing PartsJul 11, 2026
- Machine VisionXiaomi, Alibaba DAMO Academy Drive Open-Source Robotics Model Ecosystem, Lowering Algorithm Development Barriers for Overseas SMEs Adopting Chinese Robotics SolutionsMar 30, 2026
- Cobots & ArmsShanxi 'AI+' Conference Showcases Embodied Intelligence with Multinational Buyer Engagement: Key Industry ImplicationsMar 30, 2026
Popular Tags
Recommended News
 Jul 11, 2026How to Specify Aerospace Carbon Fiber Assemblies for Lightweight, Load-Bearing PartsAerospace carbon fiber assemblies: learn how to specify laminate design, load data, joining methods, and inspection controls for lighter, reliable load-bearing aerospace parts.Elena Rostova (UAV Systems Researcher)
 Mar 30, 2026Xiaomi, Alibaba DAMO Academy Drive Open-Source Robotics Model Ecosystem, Lowering Algorithm Development Barriers for Overseas SMEs Adopting Chinese Robotics SolutionsXiaomi & Alibaba DAMO Academy's open-source robotics models lower algorithm barriers for global SMEs. Boost efficiency in manufacturing, logistics & smart retail with ROS 2 compatible solutions.TSV Data Lab
 Mar 30, 2026Shanxi 'AI+' Conference Showcases Embodied Intelligence with Multinational Buyer Engagement: Key Industry ImplicationsShanxi 'AI+' Conference highlights embodied intelligence with Tesla, Ubtech & Jiantao showcasing multimodal robotics. 40+ global buyers validated tech on-site, creating new B2B channels for industrial automation & AI solutions.Chen Wei (Automation Lead Engineer)
 Mar 30, 2026Zhongguancun Unveils 6G Integrated Sensing-Computing-Intelligence Platform to Empower Embodied Robots for Global Industrial ApplicationsZhongguancun's new 6G platform revolutionizes industrial robotics with <10ms latency, empowering global automotive, logistics & port automation. Discover how this tech boosts China's smart manufacturing exports.TSV Data Lab
 Mar 30, 2026Mech-Mind Tianjin Embodied Intelligence R&D and Production Base Goes Live, Cutting Delivery Time by 20%–30% for Global Customized AMR+Vision SolutionsMech-Mind's Tianjin AMR+Vision production base cuts delivery time by 20%-30% for欧美 & Latin American markets. Discover how this PLd-certified facility accelerates customized robotics solutions for smart manufacturing and logistics.Chen Wei (Automation Lead Engineer)
 Mar 30, 2026Boao Forum Reveals 'Co-evolution of Big and Small Brains' Trend in Humanoid Robots, China's Embodied Intelligence Accelerates Adaptation to Overseas Manufacturing Service ScenariosDiscover how China's humanoid robots, featuring 'Co-evolution of Big and Small Brains,' are revolutionizing global manufacturing. Learn about Embodied Tian Gong 3.0's ISO compliance and overseas deployment at Boao Forum 2026.Chen Wei (Automation Lead Engineer)
 Mar 30, 2026China Railway Industrial Secures Patent for Embodied Robotics in Material Handling, Boosting High-Precision Delivery Capabilities for Overseas Infrastructure and Manufacturing ProjectsChina Railway Industrial's new patent for embodied robotics in material handling boosts high-precision delivery for global infrastructure & manufacturing. Discover how this innovation enhances logistics accuracy in automotive, rail transit & EPC projects.Chen Wei (Automation Lead Engineer)
 Oct 16, 2026Choosing a Rugged Edge AI Box Supplier: Thermal Tests and Lifecycle SupportChoose a rugged edge AI box supplier with proven thermal performance and reliable lifecycle support. Discover the tests and commitments to verify before you buy.TSV Data Lab
 Oct 15, 2026R&D Cost Reduction Services: How to Evaluate Fees, Savings, and ROIEvaluate R&D cost reduction services with confidence. Compare fees, verify savings, and calculate ROI without compromising performance. Discover how to choose a provider that delivers real value.Chen Wei (Automation Lead Engineer)
 Oct 15, 2026How Should You Compare TechStat Vanguard 5-Axis CNC Tolerances?TechStat Vanguard 5-axis CNC tolerance comparison: learn how to verify part accuracy, assess inspection evidence, and choose suppliers that reliably meet your drawing requirements.Dr. Marcus Vance
 Oct 14, 2026Drone Frame Composites: Carbon Fiber vs. Fiberglass for Weight and StiffnessExplore drone structural materials composites: compare carbon fiber and fiberglass for weight, stiffness, cost, and antenna compatibility. Find the right material for your drone frame.Elena Rostova (UAV Systems Researcher)
 Oct 13, 2026Smart Cameras vs. PC-Based Machine Vision: Which Fits High-Speed Inspection?This industrial product comparison for machine vision weighs smart cameras vs. PC-based systems on latency, throughput, and cost. Discover your best fit for high-speed inspection.TSV Data Lab
 Oct 12, 2026How to Verify RoHS Compliance in Industrial Sensing Systems Before DeploymentRoHS compliant sensing systems: learn how to verify materials, supplier declarations, testing, and configuration controls before industrial deployment.TSV Data Lab
 Oct 11, 2026How Procurement-Oriented Content Taxonomy Improves B2B Buying JourneysProcurement-oriented content taxonomy streamlines B2B buying journeys with clearer evidence, supplier comparisons, risk visibility, and faster approvals.TSV Data Lab
 Oct 10, 2026How to Select a Machine Performance Monitoring Platform for OEE and Downtime ReductionMachine performance monitoring platform selection guide: validate machine states, OEE data, downtime reasons, integrations, and scalability to reduce losses with confidence.TSV Data Lab
 Oct 08, 2026How to Machine Inconel 625 Blades Without Heat Cracks or Edge ChippingInconel 625 blade machining guide: prevent heat cracks, edge chipping, chatter, and work hardening with proven tooling, cooling, fixturing, and inspection strategies.Dr. Marcus Vance
 Oct 07, 2026How to Evaluate an HMI Panel Distributor for Industrial Automation ProjectsHMI panel distributor evaluation guide: verify technical compatibility, traceability, supply reliability, lifecycle support, and total cost for automation projects.Victor Lin (Chief Software Architect)
 Oct 06, 2026Navigation Fault Tolerance Standards for AMRs: What Safety Teams Must VerifyNavigation fault tolerance standards: learn what AMR safety teams must verify, from localization loss and sensor faults to stopping distance, safe restart, and site-specific validation.Chen Wei (Automation Lead Engineer)
 Oct 05, 2026Calculating Edge Computing Total Cost of Ownership Across Distributed SitesEdge computing ownership cost explained: calculate deployment, energy, connectivity, security, remote support, and refresh costs across distributed sites.TSV Data Lab
 Oct 04, 2026CAD/CAM Benchmarking in the GCC: What Manufacturers Should Ask a ConsultantCAD CAM benchmark consultant GCC guide: learn the key questions manufacturers should ask to validate post-processors, workflows, machine performance, and production risk.Victor Lin (Chief Software Architect)
 Oct 03, 2026Selecting Automotive Radar Sensor Modules for ADAS Range, Resolution, and IntegrationAutomotive radar sensor module selection guide for ADAS: compare range, resolution, field of view, latency, and integration to build safer, reliable vehicle systems.TSV Data Lab
 Oct 02, 2026How to Qualify Machined Parts Suppliers for Hard Tech ProgramsHard tech supply chain machined parts demand rigorous supplier qualification. Learn how to assess capability, traceability, quality controls, and delivery resilience.Dr. Marcus Vance
 Oct 01, 2026How to Select an Outdoor Security Radar Sensor for Perimeter Detection?Outdoor security radar sensor selection guide: compare range, accuracy, false-alarm control, integration, and field testing for reliable perimeter detection.TSV Data Lab
 Sep 30, 2026How to Evaluate Solid-State LiDAR Hardware for Outdoor Autonomous VehiclesSolid state LiDAR hardware evaluation guide for outdoor autonomous vehicles—compare range, point-cloud quality, environmental resilience, integration, and safety.TSV Data Lab