Servo Motor Torque Curve Analysis: How to Read Speed, Peak Torque, and Duty Limits
Publication Date
author
Servo Motor Torque Curve Analysis: How to Read Speed, Peak Torque, and Duty Limits
Servo motor torque curve analysis is essential when motion performance looks strong on paper but fails under production load.
The curve tells a more honest story than a headline torque number.
It shows where torque is sustainable, where overload is temporary, and where thermal or electrical limits take over.
For engineering teams, this matters because sizing errors create downtime, unstable control, and expensive redesign loops.
This guide explains servo motor torque curve analysis in a practical way, with focus on speed zones, peak torque, and duty limits.
What a Servo Motor Torque Curve Really Shows
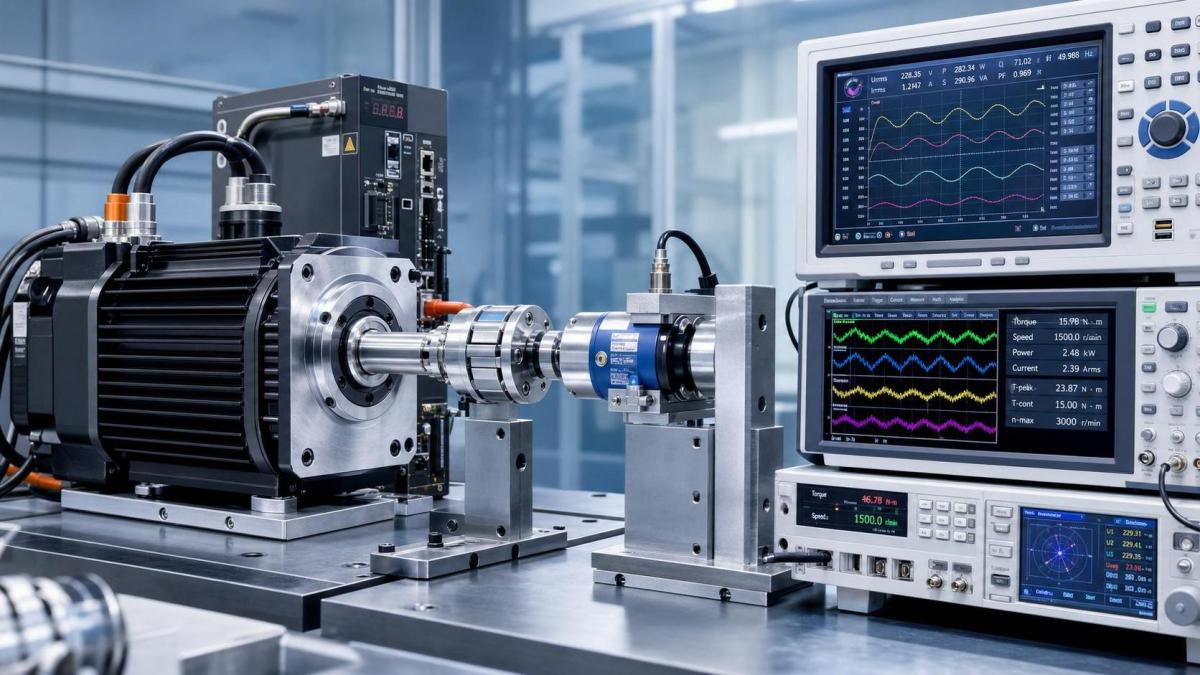
A torque curve plots available motor torque against rotational speed, usually in rpm.
Most charts include at least two lines: continuous torque and peak torque.
Continuous torque is the output the motor can hold without overheating during steady operation.
Peak torque is the short-duration overload capacity, usually available for acceleration, indexing, or disturbance rejection.
In servo motor torque curve analysis, the gap between those lines is often where misunderstandings begin.
A large peak number may look attractive, yet it says little about continuous production behavior.
That is especially true in robotics, packaging, machine tools, and UAV actuation systems.
A useful curve also reflects the drive voltage, cooling assumptions, and matching amplifier conditions.
Without that context, comparison across vendors becomes risky.
How to Read Speed Regions Without Guesswork
Most servo systems have a constant torque region and a field-weakening or torque-falloff region.
At lower speeds, the drive can usually provide rated current, so torque remains relatively flat.
Beyond base speed, available voltage becomes the limiting factor, and torque starts dropping.
This is one of the most important signals in servo motor torque curve analysis.
If the application requires high torque at elevated speed, the falling section may disqualify the motor.
A simple way to read the chart is to mark three operating points.
- Start torque during acceleration from rest.
- Running torque at normal process speed.
- Transient torque during shock, cut, clamp, or quick reversal.
Then compare those points against both continuous and peak boundaries.
If normal process torque sits near the continuous limit, thermal margin is already thin.
If transient events cross the peak line, the issue is not efficiency. It is feasibility.
Peak Torque Is Useful, but Only in the Right Time Window
Peak torque is not fake. It is simply conditional.
In servo motor torque curve analysis, the real question is how long that peak lasts and how often it repeats.
Some datasheets define peak torque for one second. Others allow several seconds under specific thermal models.
That difference can completely change application suitability.
For example, a pick-and-place axis may need high torque only during brief acceleration bursts.
In that case, peak torque can be a meaningful sizing resource.
A conveyor with frequent starts under heavy inertia is different.
Repeated overload pulses may accumulate heat faster than expected, even if each pulse looks compliant alone.
This is where spec sheet reading must shift from static numbers to cycle behavior.
A strong engineering review asks four direct questions.
- What is the exact peak-to-continuous torque ratio?
- How many seconds is peak torque allowed?
- What rest period is needed between overload events?
- Are values based on natural cooling or forced cooling?
Without those answers, peak torque can easily be overvalued during supplier comparison.
Duty Limits: The Hidden Boundary Behind Many Failures
Duty limit is the practical boundary between occasional overload and chronic thermal stress.
In servo motor torque curve analysis, duty cycle often matters more than isolated torque snapshots.
A motor may survive one demanding motion profile and still fail in continuous production repetition.
This usually comes from copper losses, motor heating, and drive current saturation.
The safer method is to calculate RMS torque across the real operating cycle.
RMS torque reflects the heating effect of varying loads better than average torque.
If RMS torque exceeds the continuous curve, the system is undersized even if peak events look acceptable.
In real procurement work, this is a common failure point.
One vendor presents excellent acceleration data. Another provides a lower peak number but stronger continuous duty stability.
The second option often performs better over long shifts.
Key checks for duty-limit review
- Confirm RMS torque against rated continuous torque.
- Check ambient temperature assumptions in the datasheet.
- Review enclosure ventilation and cabinet heat buildup.
- Verify repeated start-stop frequency and dwell times.
- Match motor limits with actual drive current capability.
How to Compare Supplier Curves More Rigorously
Not all torque curves are built on the same test assumptions.
That is why servo motor torque curve analysis should include source conditions, not just plotted shapes.
A fair comparison should standardize at least these variables.
This kind of normalization aligns well with TSV’s engineering-first view of supplier qualification.
Parameters only become useful when test conditions are transparent and comparable.
That approach reduces trial-and-error and prevents costly overconfidence in marketing claims.
Common Reading Mistakes in Servo Motor Torque Curve Analysis
Several mistakes appear again and again in technical reviews.
- Using peak torque as if it were continuous torque.
- Ignoring torque drop in the high-speed region.
- Skipping RMS calculations for repeated motion cycles.
- Comparing curves tested under different voltages.
- Forgetting gearbox, coupling, and reflected inertia effects.
More subtly, teams sometimes size close to the edge because the prototype runs acceptably for short periods.
Production shifts expose the weakness later through rising temperature, tuning instability, or nuisance alarms.
A conservative margin often saves more cost than a nominally smaller motor.
A Practical Review Workflow
A clean servo motor torque curve analysis process does not need to be complicated.
- Define actual motion segments, speeds, and load torques.
- Calculate acceleration torque and steady-state torque separately.
- Plot all operating points on the supplier torque curve.
- Check transient points against the peak torque envelope.
- Check RMS torque against the continuous duty limit.
- Verify voltage, temperature, and drive assumptions.
- Add margin for aging, friction growth, and process variation.
This workflow keeps the review grounded in engineering truth rather than catalog optimism.
It also makes supplier discussions more precise, because every challenge can be traced to a quantified condition.
Final Takeaway
Good servo motor torque curve analysis goes beyond reading a maximum number.
It connects speed, peak torque, and duty limits to the actual thermal and dynamic reality of the machine.
When the curve is read correctly, overload capacity becomes measurable, continuous boundaries become visible, and supplier risk drops sharply.
In practical terms, the best decision usually comes from the motor that survives the full duty cycle with margin, not the one with the loudest peak claim.
Use servo motor torque curve analysis as a filtering tool, and every specification review becomes faster, clearer, and more defensible.
Search News
Hot Articles
- Carbon Fiber StructuresHow to Specify Aerospace Carbon Fiber Assemblies for Lightweight, Load-Bearing PartsJul 11, 2026
- Machine VisionXiaomi, Alibaba DAMO Academy Drive Open-Source Robotics Model Ecosystem, Lowering Algorithm Development Barriers for Overseas SMEs Adopting Chinese Robotics SolutionsMar 30, 2026
- Cobots & ArmsShanxi 'AI+' Conference Showcases Embodied Intelligence with Multinational Buyer Engagement: Key Industry ImplicationsMar 30, 2026
Popular Tags
Recommended News
 Jul 11, 2026How to Specify Aerospace Carbon Fiber Assemblies for Lightweight, Load-Bearing PartsAerospace carbon fiber assemblies: learn how to specify laminate design, load data, joining methods, and inspection controls for lighter, reliable load-bearing aerospace parts.Elena Rostova (UAV Systems Researcher)
 Mar 30, 2026Xiaomi, Alibaba DAMO Academy Drive Open-Source Robotics Model Ecosystem, Lowering Algorithm Development Barriers for Overseas SMEs Adopting Chinese Robotics SolutionsXiaomi & Alibaba DAMO Academy's open-source robotics models lower algorithm barriers for global SMEs. Boost efficiency in manufacturing, logistics & smart retail with ROS 2 compatible solutions.TSV Data Lab
 Mar 30, 2026Shanxi 'AI+' Conference Showcases Embodied Intelligence with Multinational Buyer Engagement: Key Industry ImplicationsShanxi 'AI+' Conference highlights embodied intelligence with Tesla, Ubtech & Jiantao showcasing multimodal robotics. 40+ global buyers validated tech on-site, creating new B2B channels for industrial automation & AI solutions.Chen Wei (Automation Lead Engineer)
 Mar 30, 2026Zhongguancun Unveils 6G Integrated Sensing-Computing-Intelligence Platform to Empower Embodied Robots for Global Industrial ApplicationsZhongguancun's new 6G platform revolutionizes industrial robotics with <10ms latency, empowering global automotive, logistics & port automation. Discover how this tech boosts China's smart manufacturing exports.TSV Data Lab
 Mar 30, 2026Mech-Mind Tianjin Embodied Intelligence R&D and Production Base Goes Live, Cutting Delivery Time by 20%–30% for Global Customized AMR+Vision SolutionsMech-Mind's Tianjin AMR+Vision production base cuts delivery time by 20%-30% for欧美 & Latin American markets. Discover how this PLd-certified facility accelerates customized robotics solutions for smart manufacturing and logistics.Chen Wei (Automation Lead Engineer)
 Mar 30, 2026Boao Forum Reveals 'Co-evolution of Big and Small Brains' Trend in Humanoid Robots, China's Embodied Intelligence Accelerates Adaptation to Overseas Manufacturing Service ScenariosDiscover how China's humanoid robots, featuring 'Co-evolution of Big and Small Brains,' are revolutionizing global manufacturing. Learn about Embodied Tian Gong 3.0's ISO compliance and overseas deployment at Boao Forum 2026.Chen Wei (Automation Lead Engineer)
 Mar 30, 2026China Railway Industrial Secures Patent for Embodied Robotics in Material Handling, Boosting High-Precision Delivery Capabilities for Overseas Infrastructure and Manufacturing ProjectsChina Railway Industrial's new patent for embodied robotics in material handling boosts high-precision delivery for global infrastructure & manufacturing. Discover how this innovation enhances logistics accuracy in automotive, rail transit & EPC projects.Chen Wei (Automation Lead Engineer)
 Sep 22, 2026Drone Engine-T550CC Applications: Build the UAV Power System Around the MissionAn application guide for Drone Engine-T550CC integration, covering payload planning, airframe matching, cooling, fuel, vibration, test procedures, documentation, and service preparation.Elena Rostova (UAV Systems Researcher)
 Sep 22, 2026How to Evaluate Industrial Edge Computing Vendors for Factory DeploymentIndustrial edge computing vendor evaluation guide for factories: compare latency, protocol fit, reliability, security, and lifecycle support before deployment.TSV Data Lab
 Sep 21, 2026Drone Payload Integration: Matching Power, Data, and Center of Gravity for Reliable FlightsDrone payload integration made practical: balance power, data, center of gravity, and endurance to build safer, more reliable mission-ready flights.Elena Rostova (UAV Systems Researcher)
 Sep 20, 2026Autonomous Navigation Pricing: Cost Drivers and Budget Benchmarks for AMR ProjectsAutonomous navigation price explained: compare AMR cost drivers, software, sensors, integration, safety, and lifecycle budgets to build a scalable project plan.Chen Wei (Automation Lead Engineer)
 Sep 19, 2026How to Scope Automation Integration Services for Multi-System Factory ProjectsAutomation integration services: learn how to scope multi-system factory projects with clear workflows, interface contracts, safety boundaries, and acceptance criteria.Victor Lin (Chief Software Architect)
 Sep 18, 2026Selecting UAV Aerospace Structural Parts for Strength, Weight, and Fatigue LifeUAV aerospace structural parts guide: compare strength, weight, stiffness, fatigue life, joints, and traceability to select reliable flight-ready components.Elena Rostova (UAV Systems Researcher)
 Sep 17, 2026Selecting Commercial Drone Payloads for European Inspection ProjectsCommercial drone payloads Europe: learn how to select RGB, thermal and LiDAR systems for compliant, reliable inspection data and better project outcomes.Elena Rostova (UAV Systems Researcher)
 Sep 16, 2026Machining Tolerance Validation: How to Verify Critical Dimensions Before Production ReleaseMachining tolerance analysis validation: verify critical dimensions, measurement systems, process capability, and tolerance stacks before production release.Dr. Marcus Vance
 Sep 15, 2026AGV Tape Guidance vs Laser Navigation: Which Fits Your Warehouse Layout?AGV tape guidance comparison: discover how tape and laser navigation fit changing warehouse layouts, docking needs, floor conditions, maintenance, and route flexibility.Chen Wei (Automation Lead Engineer)
 Sep 14, 2026How Point Cloud Analytics Improves Asset Inspection Workflows Across GCC ProjectsPoint cloud analytics GCC helps project leaders improve asset inspections with accurate change detection, safer workflows, and faster maintenance decisions.TSV Data Lab
 Sep 13, 2026How Aerospace Manufacturers Can Build a Digital Thread From Design to Certified ProductionDigital manufacturing for aerospace: learn how to build a traceable digital thread from design through certified production, supplier control, and audit-ready compliance.Victor Lin (Chief Software Architect)
 Sep 12, 2026How to Select a Thermal Sensor for Mapping Drones in Surveying ProjectsMapping drone thermal sensor selection made simple: compare GSD, radiometric data, NETD, calibration, and workflow fit for accurate, survey-ready thermal maps.Elena Rostova (UAV Systems Researcher)
 Sep 11, 2026Integrating Photogrammetry Workflows into Digital Twin Projects Without Data BottlenecksPhotogrammetry workflow integration for digital twins: learn how to streamline capture, validation, versioning, and delivery to prevent data bottlenecks.Victor Lin (Chief Software Architect)
 Sep 10, 2026Hard-Tech Supply Chain Procurement: Qualifying Suppliers to Cut Lead-Time RiskHard-tech supply chain procurement guide: qualify suppliers with proven process, traceability, capacity, and change control to reduce lead-time risk.Chen Wei (Automation Lead Engineer)
 Sep 09, 2026Industrial Application Notes: Cost Factors That Shape Automation Project BudgetsIndustrial application notes cost factors explained: uncover the engineering, safety, integration, and commissioning variables that shape accurate automation budgets.Victor Lin (Chief Software Architect)
 Sep 08, 2026Supplier Discovery for Sourcing: How Buyers Can Verify Capability and Supply RiskSupplier discovery for sourcing: learn how to verify supplier capability, traceability, quote assumptions, and supply risk before placing production orders.TSV Data Lab
 Sep 07, 2026What Determines Process Control Systems Pricing? A Buyer’s Cost GuideProcess control systems pricing explained: compare hardware, engineering, integration, cybersecurity, validation, and lifecycle costs to choose the right-value solution.Victor Lin (Chief Software Architect)